Asset
The Asset service enables you to easily and thoroughly visualize your cloud resources. At a glance, you can view the relationships between your cloud assets and discover opportunities to optimize resource usage and reduce costs through our automated analysis.
Quick Start Guide
This guide covers the fundamentals of asset management. Start by registering your cloud accounts and configuring the necessary settings. For detailed instructions on the registration and configuration process, refer to the Configurations Quick Start Guide.
- Dashboard
The Dashboard offers graphical displays of the total collected resources for your cloud services and related information. Additionally, it presents recent weekly usage and performance trends through the collection and analysis of resources. For more details about server, database & storage, network usage, performance, and resource information, please refer to the Dashboard section.
- Service Group
This is a feature that allows users to freely categorize resources according to their needs. Users can create service groups based on criteria they define, such as by account, product, or region. This enables them to monitor resource usage and costs effectively. For instructions on how to utilize service groups, please refer to Service Group.
- Usage
You can check the resource usage and usage history for each cloud service. It provides information about the status, region, type, and other details of the resources being used, along with past usage records. To view the resource usage, please refer to Usage.
Dashboard
Asset > Dashboard
In the Dashboard, you can access tables and charts displaying an overall summary and collected data of resources.
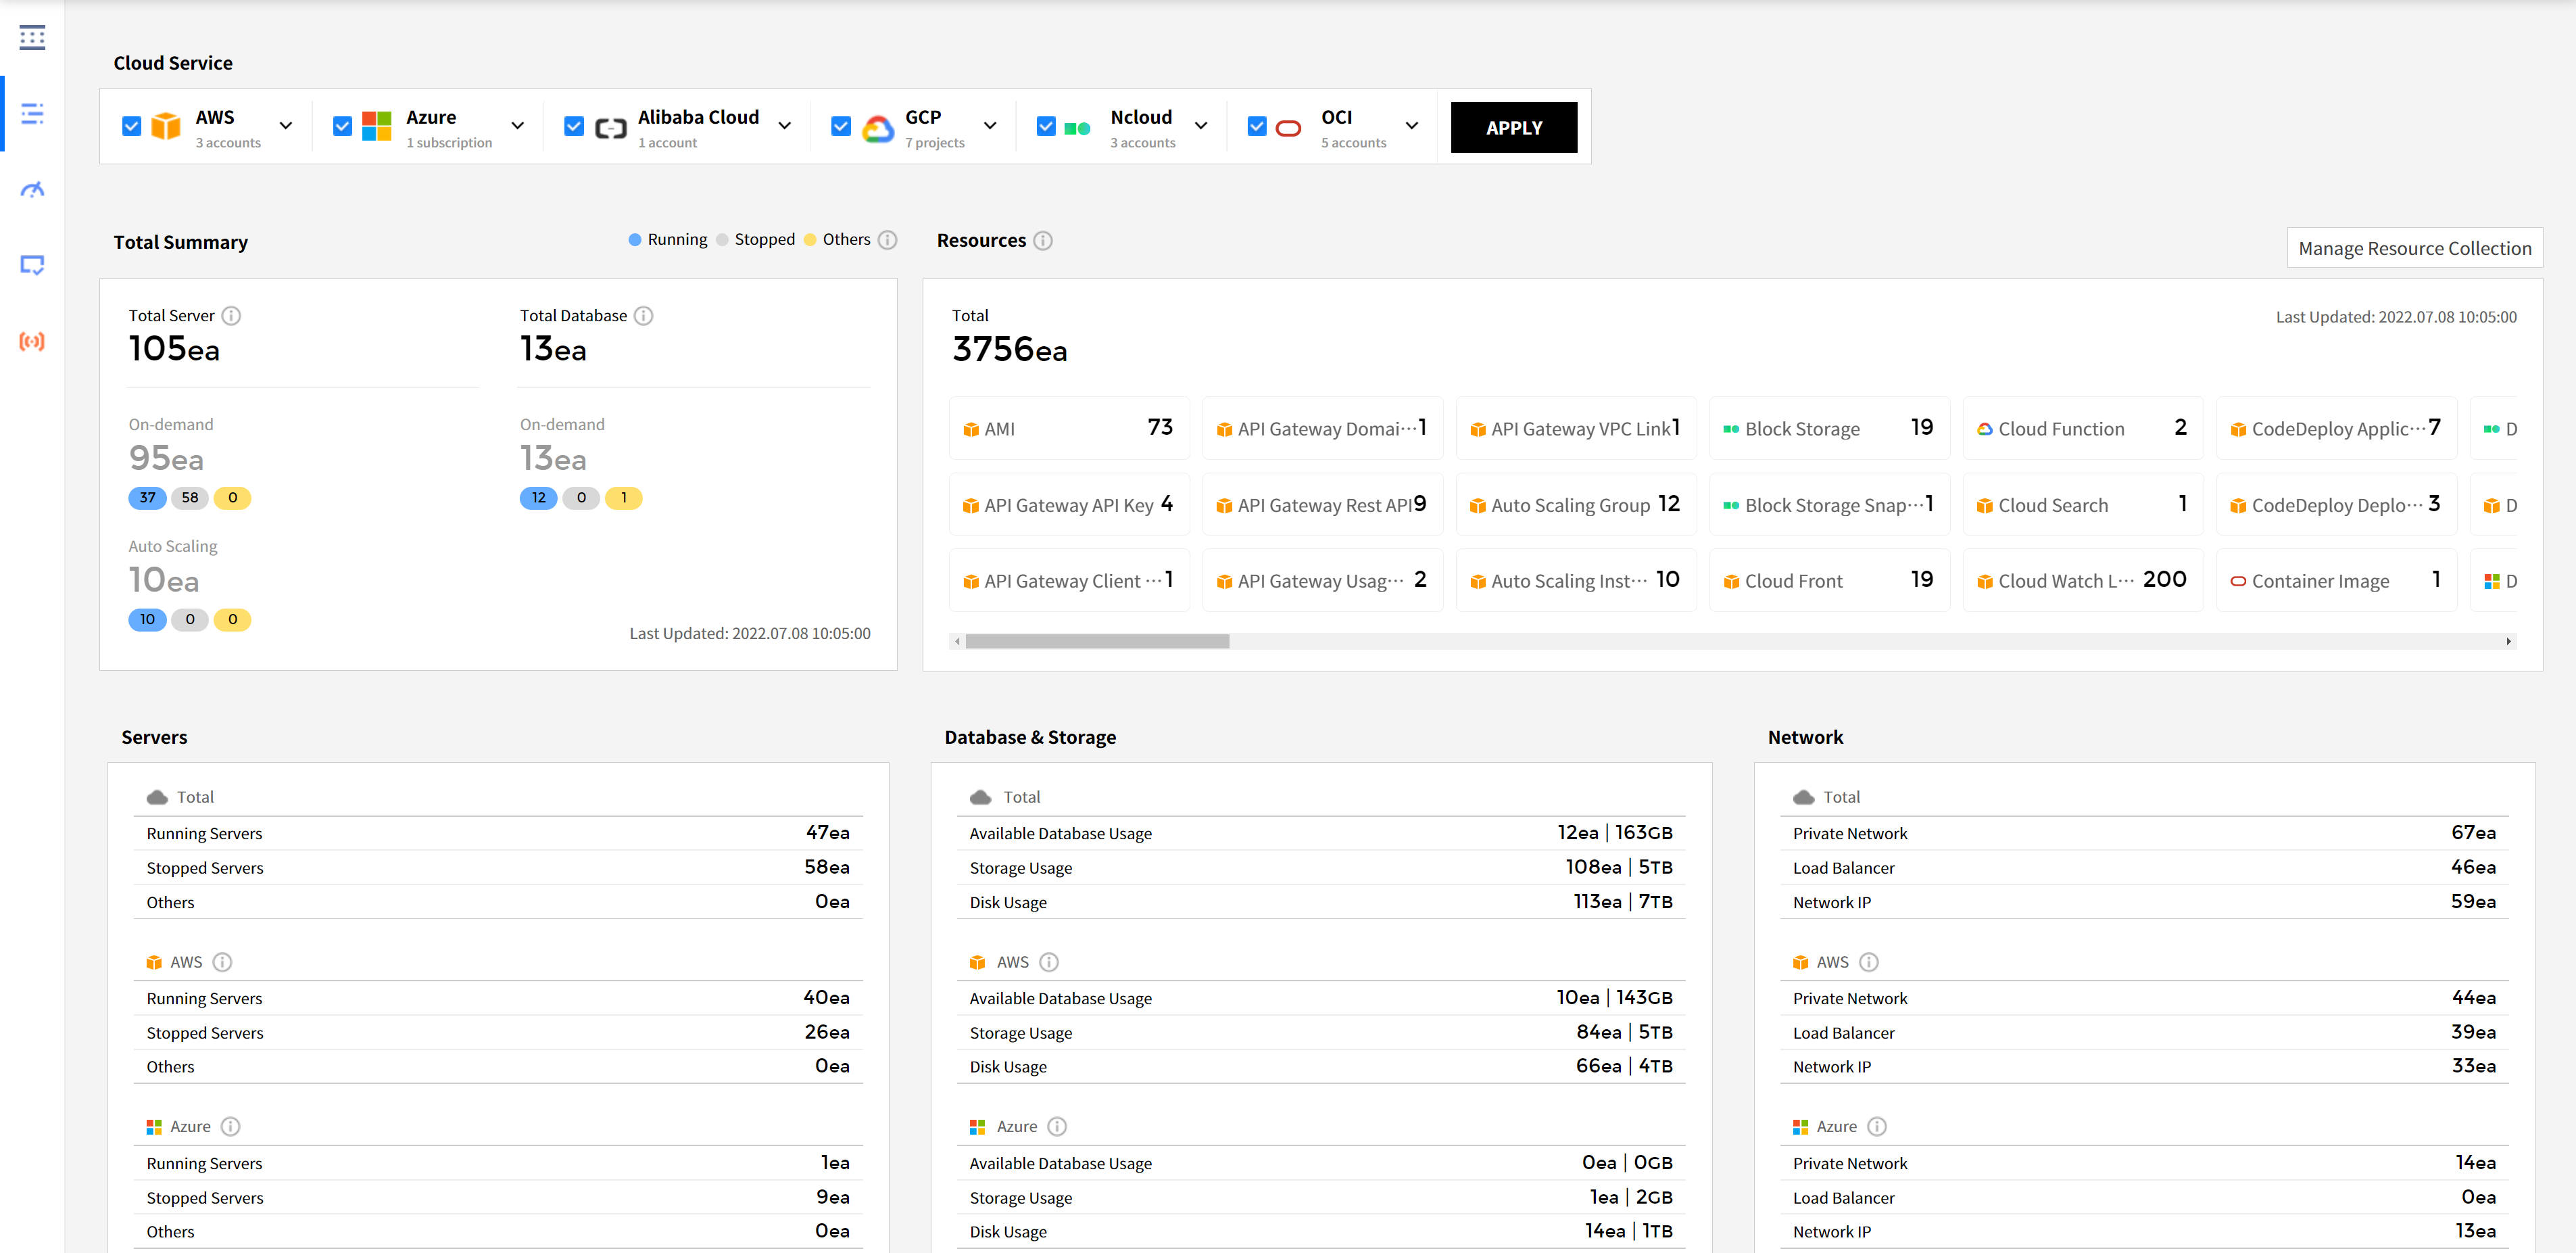
Cloud Service
You can see the cloud services currently in use along with the number of resources for each service. After selecting a cloud service and clicking the [Apply] button, the resource status for that particular service will be displayed.

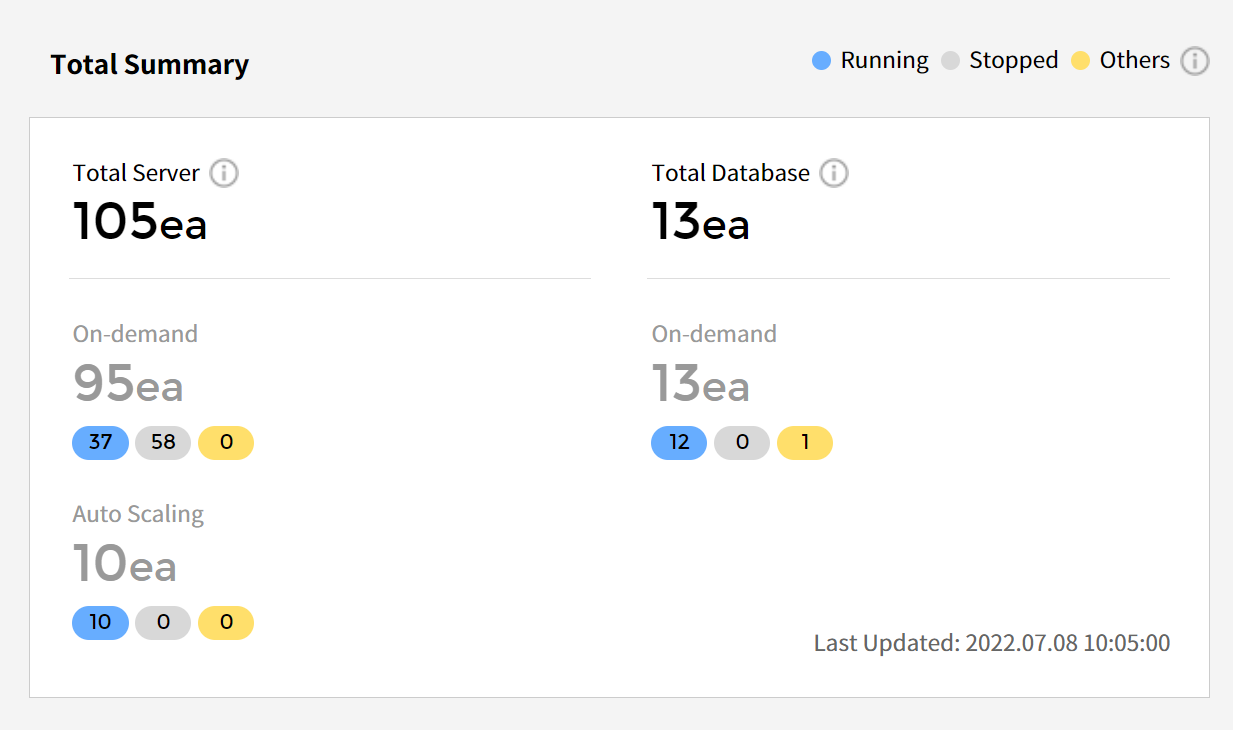
Total Summary
It shows the number of servers and databases for the selected cloud service. It also displays the total count and status breakdown of items related to On-Demand and Auto Scaling.
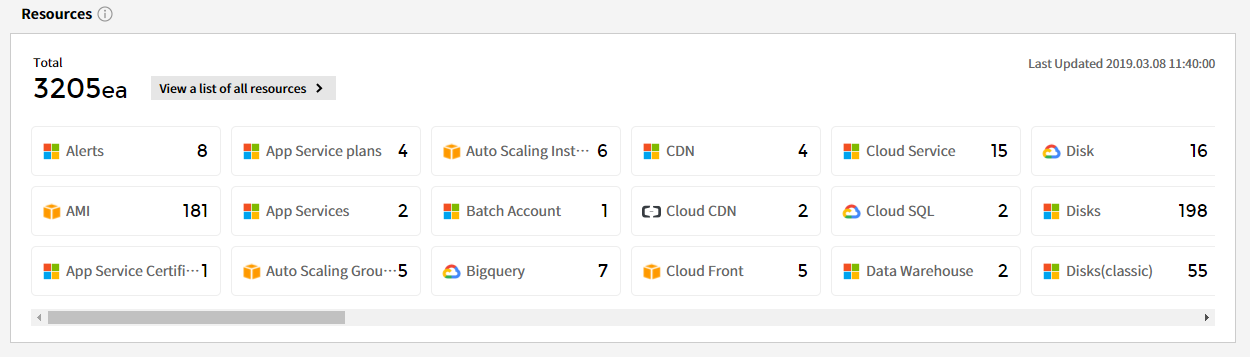
Resources
The cloud service periodically updates all resource data in use, displaying the resource list along with the current usage count for each resource. To access resources that are not shown here, you will need to add permissions in the cloud service provider’s management console.
Manage Your AWS Policies to Add the Permissions
You can expand the range of resources visible on the dashboard screen by modifying IAM policies in the AWS management console.
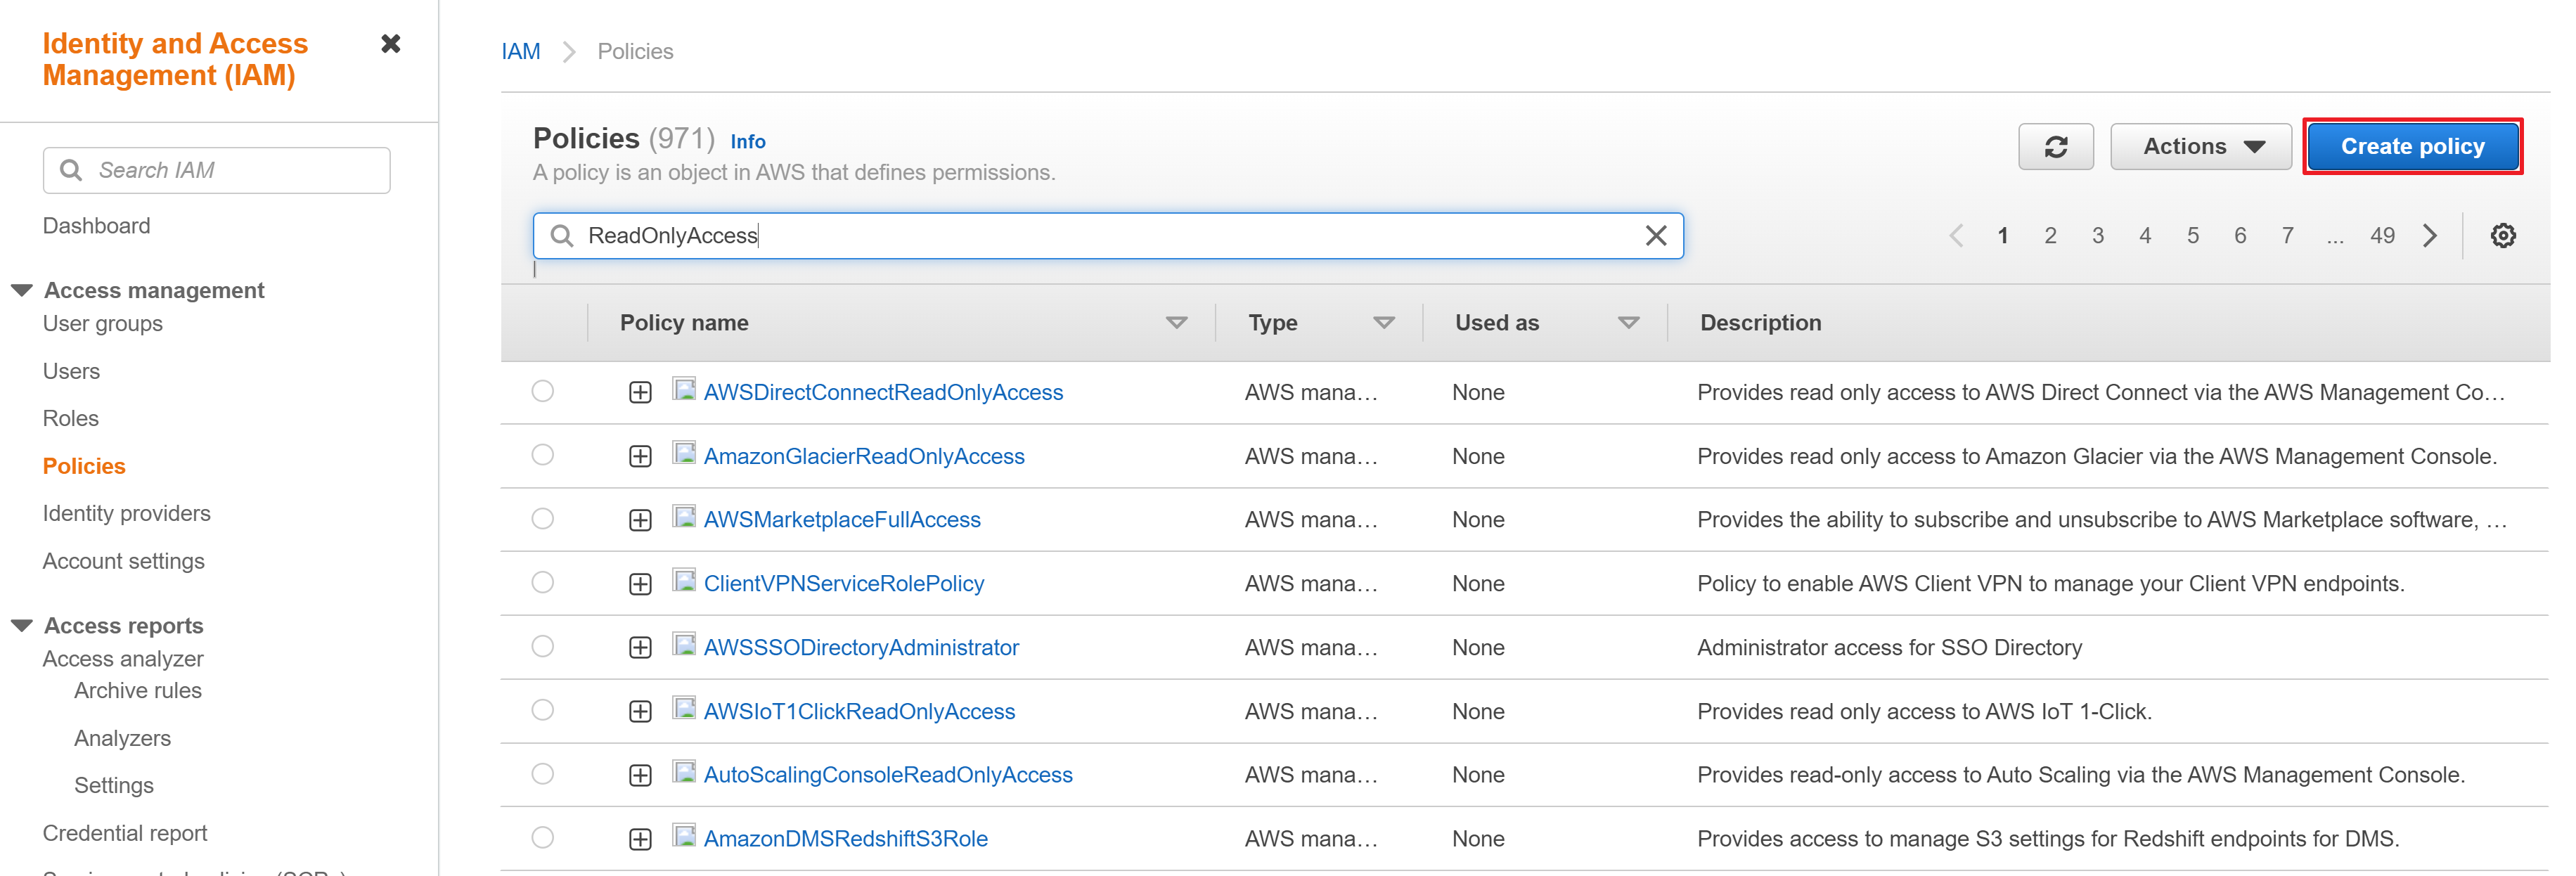
⑴ Sign in to the AWS management console, then navigate to the IAM menu. From the left-hand side menu, select Policies and then search for the policies associated with your cloud account. Most commonly, you will find the policy named [ReadOnlyAccess], so you can search for or filter the policy list accordingly.
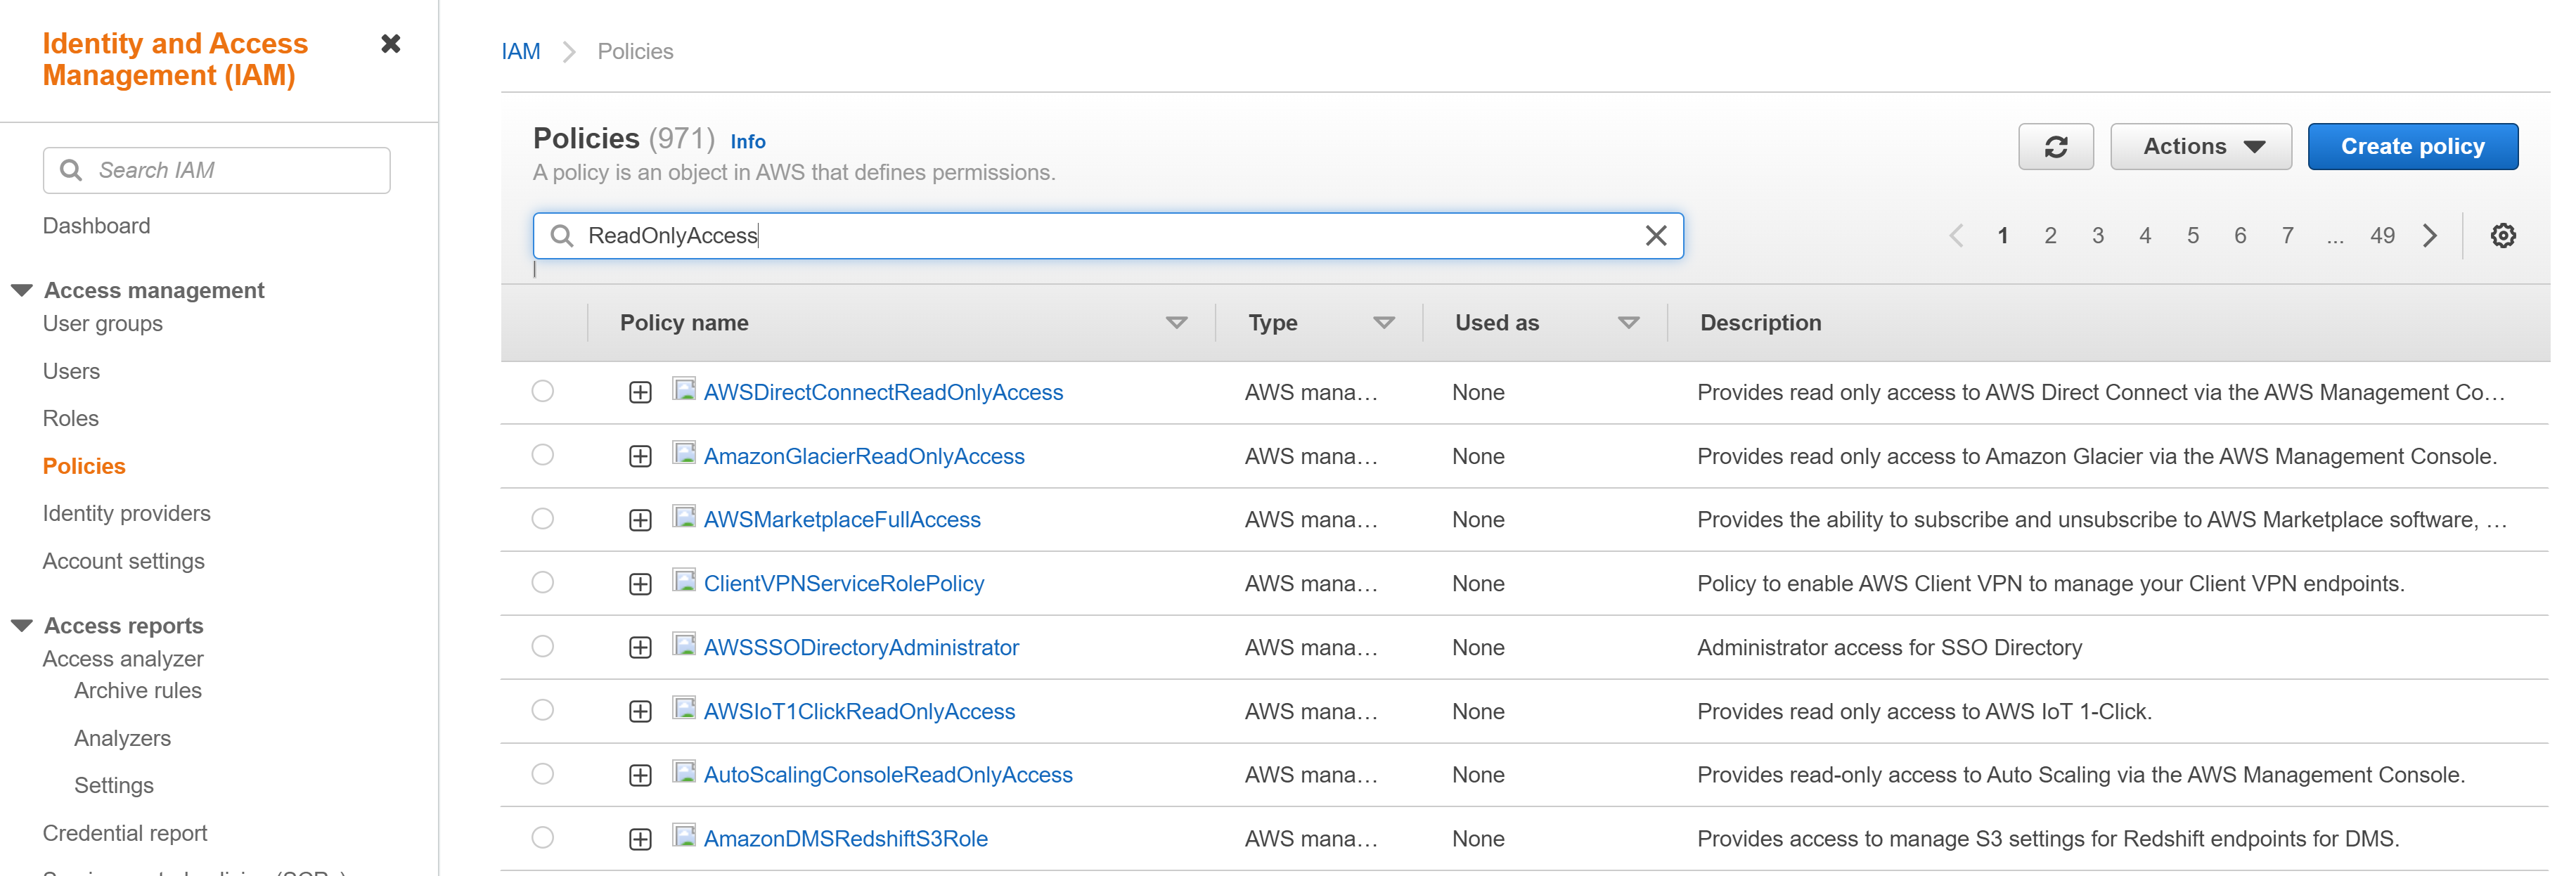
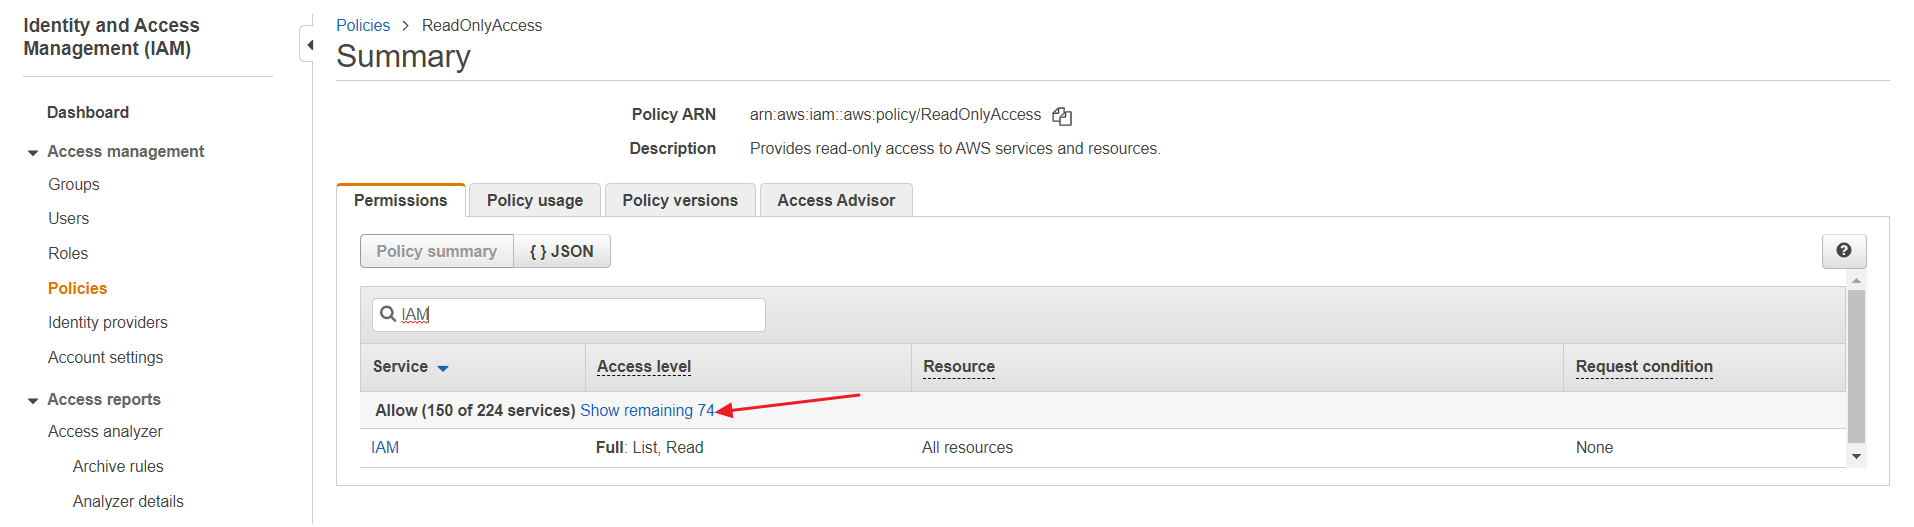
⑵ When you click on the [ReadOnlyAccess] policy, you can review the permissions configured for that policy. Among those permissions, search for [IAM] and click on it to see the resources with IAM permissions.
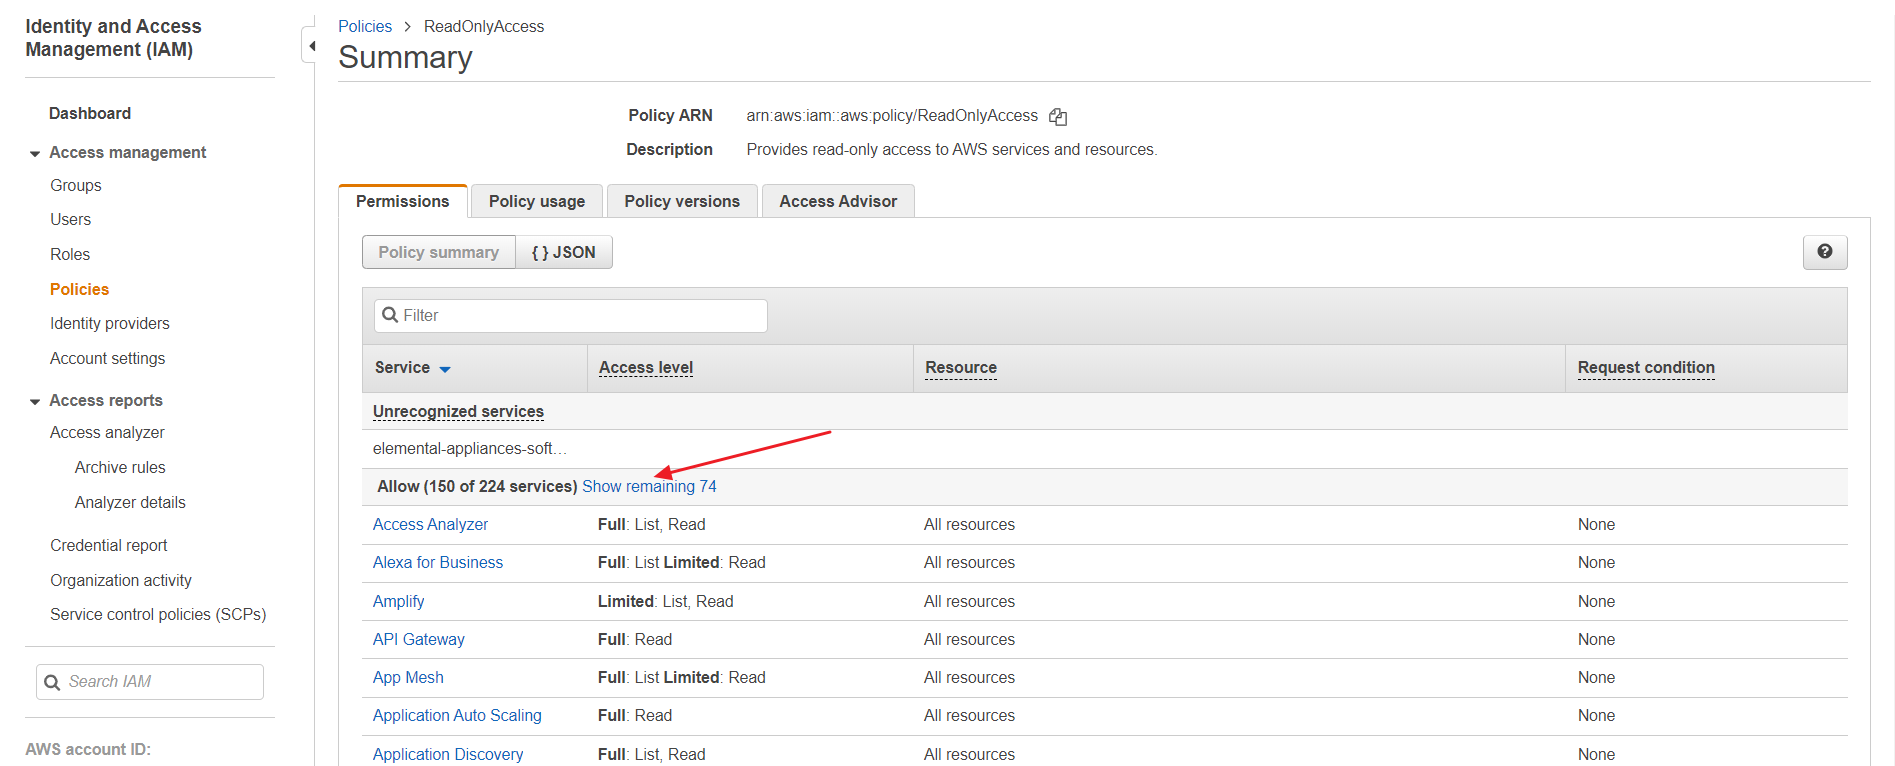
⑶ Click on [Show remaining OO] to check if there are any resources for which you lack permissions to collect data. Since the [ReadOnlyAccess] policy is an AWS managed policy and its permissions cannot be modified, if there are resources for which you lack permissions, you need to create a new policy and add the necessary permissions for those resources. Please follow the steps ① to ⑥ below to set it up:
① In the [IAM] menu, go to [Policies] page, and click [Create policy].
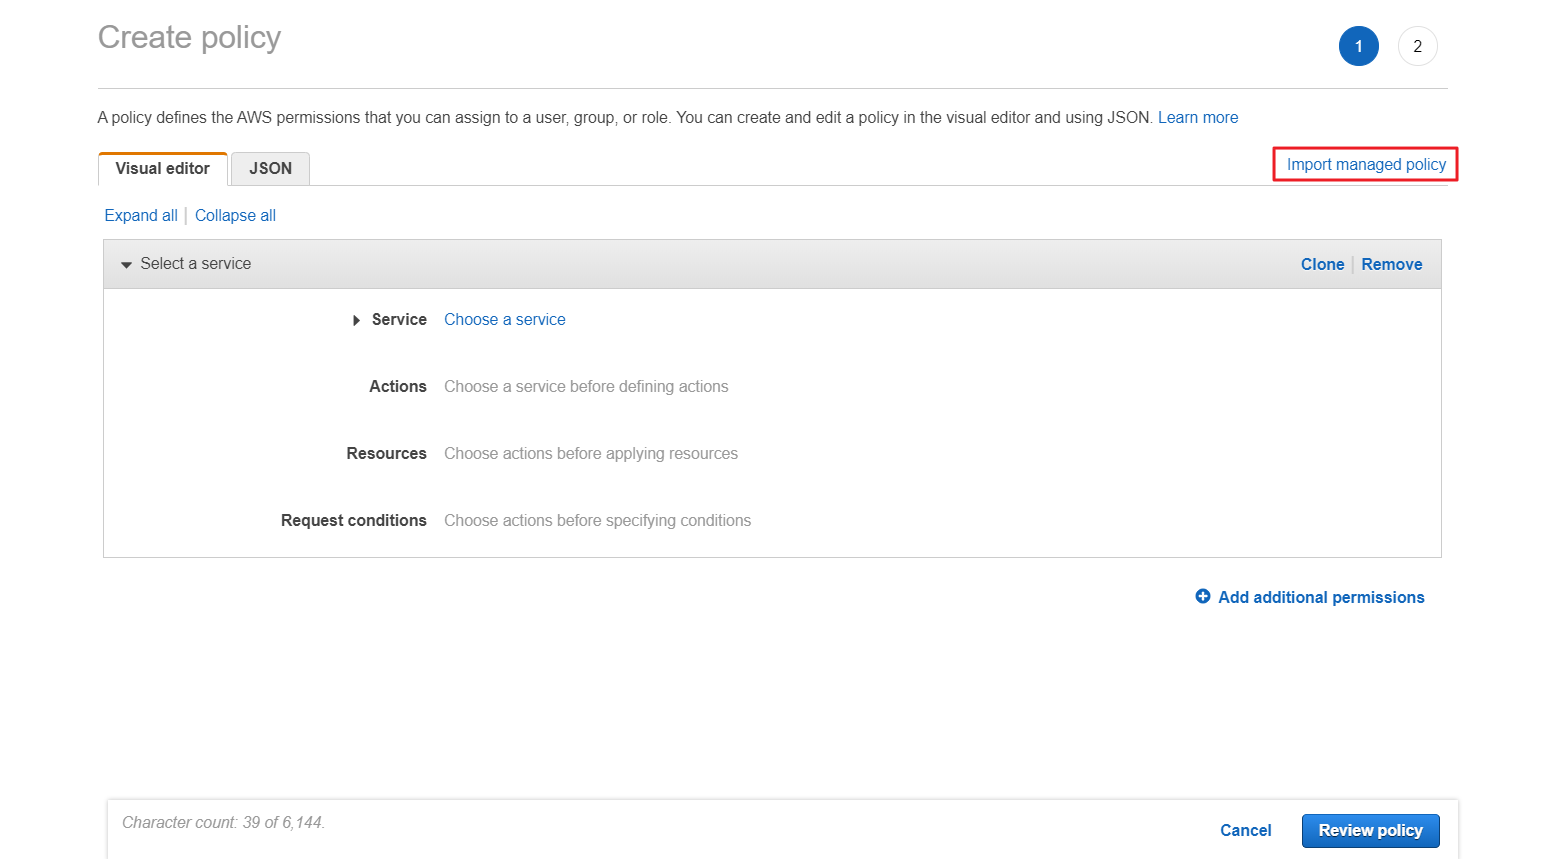
② Click [Import managed policy].
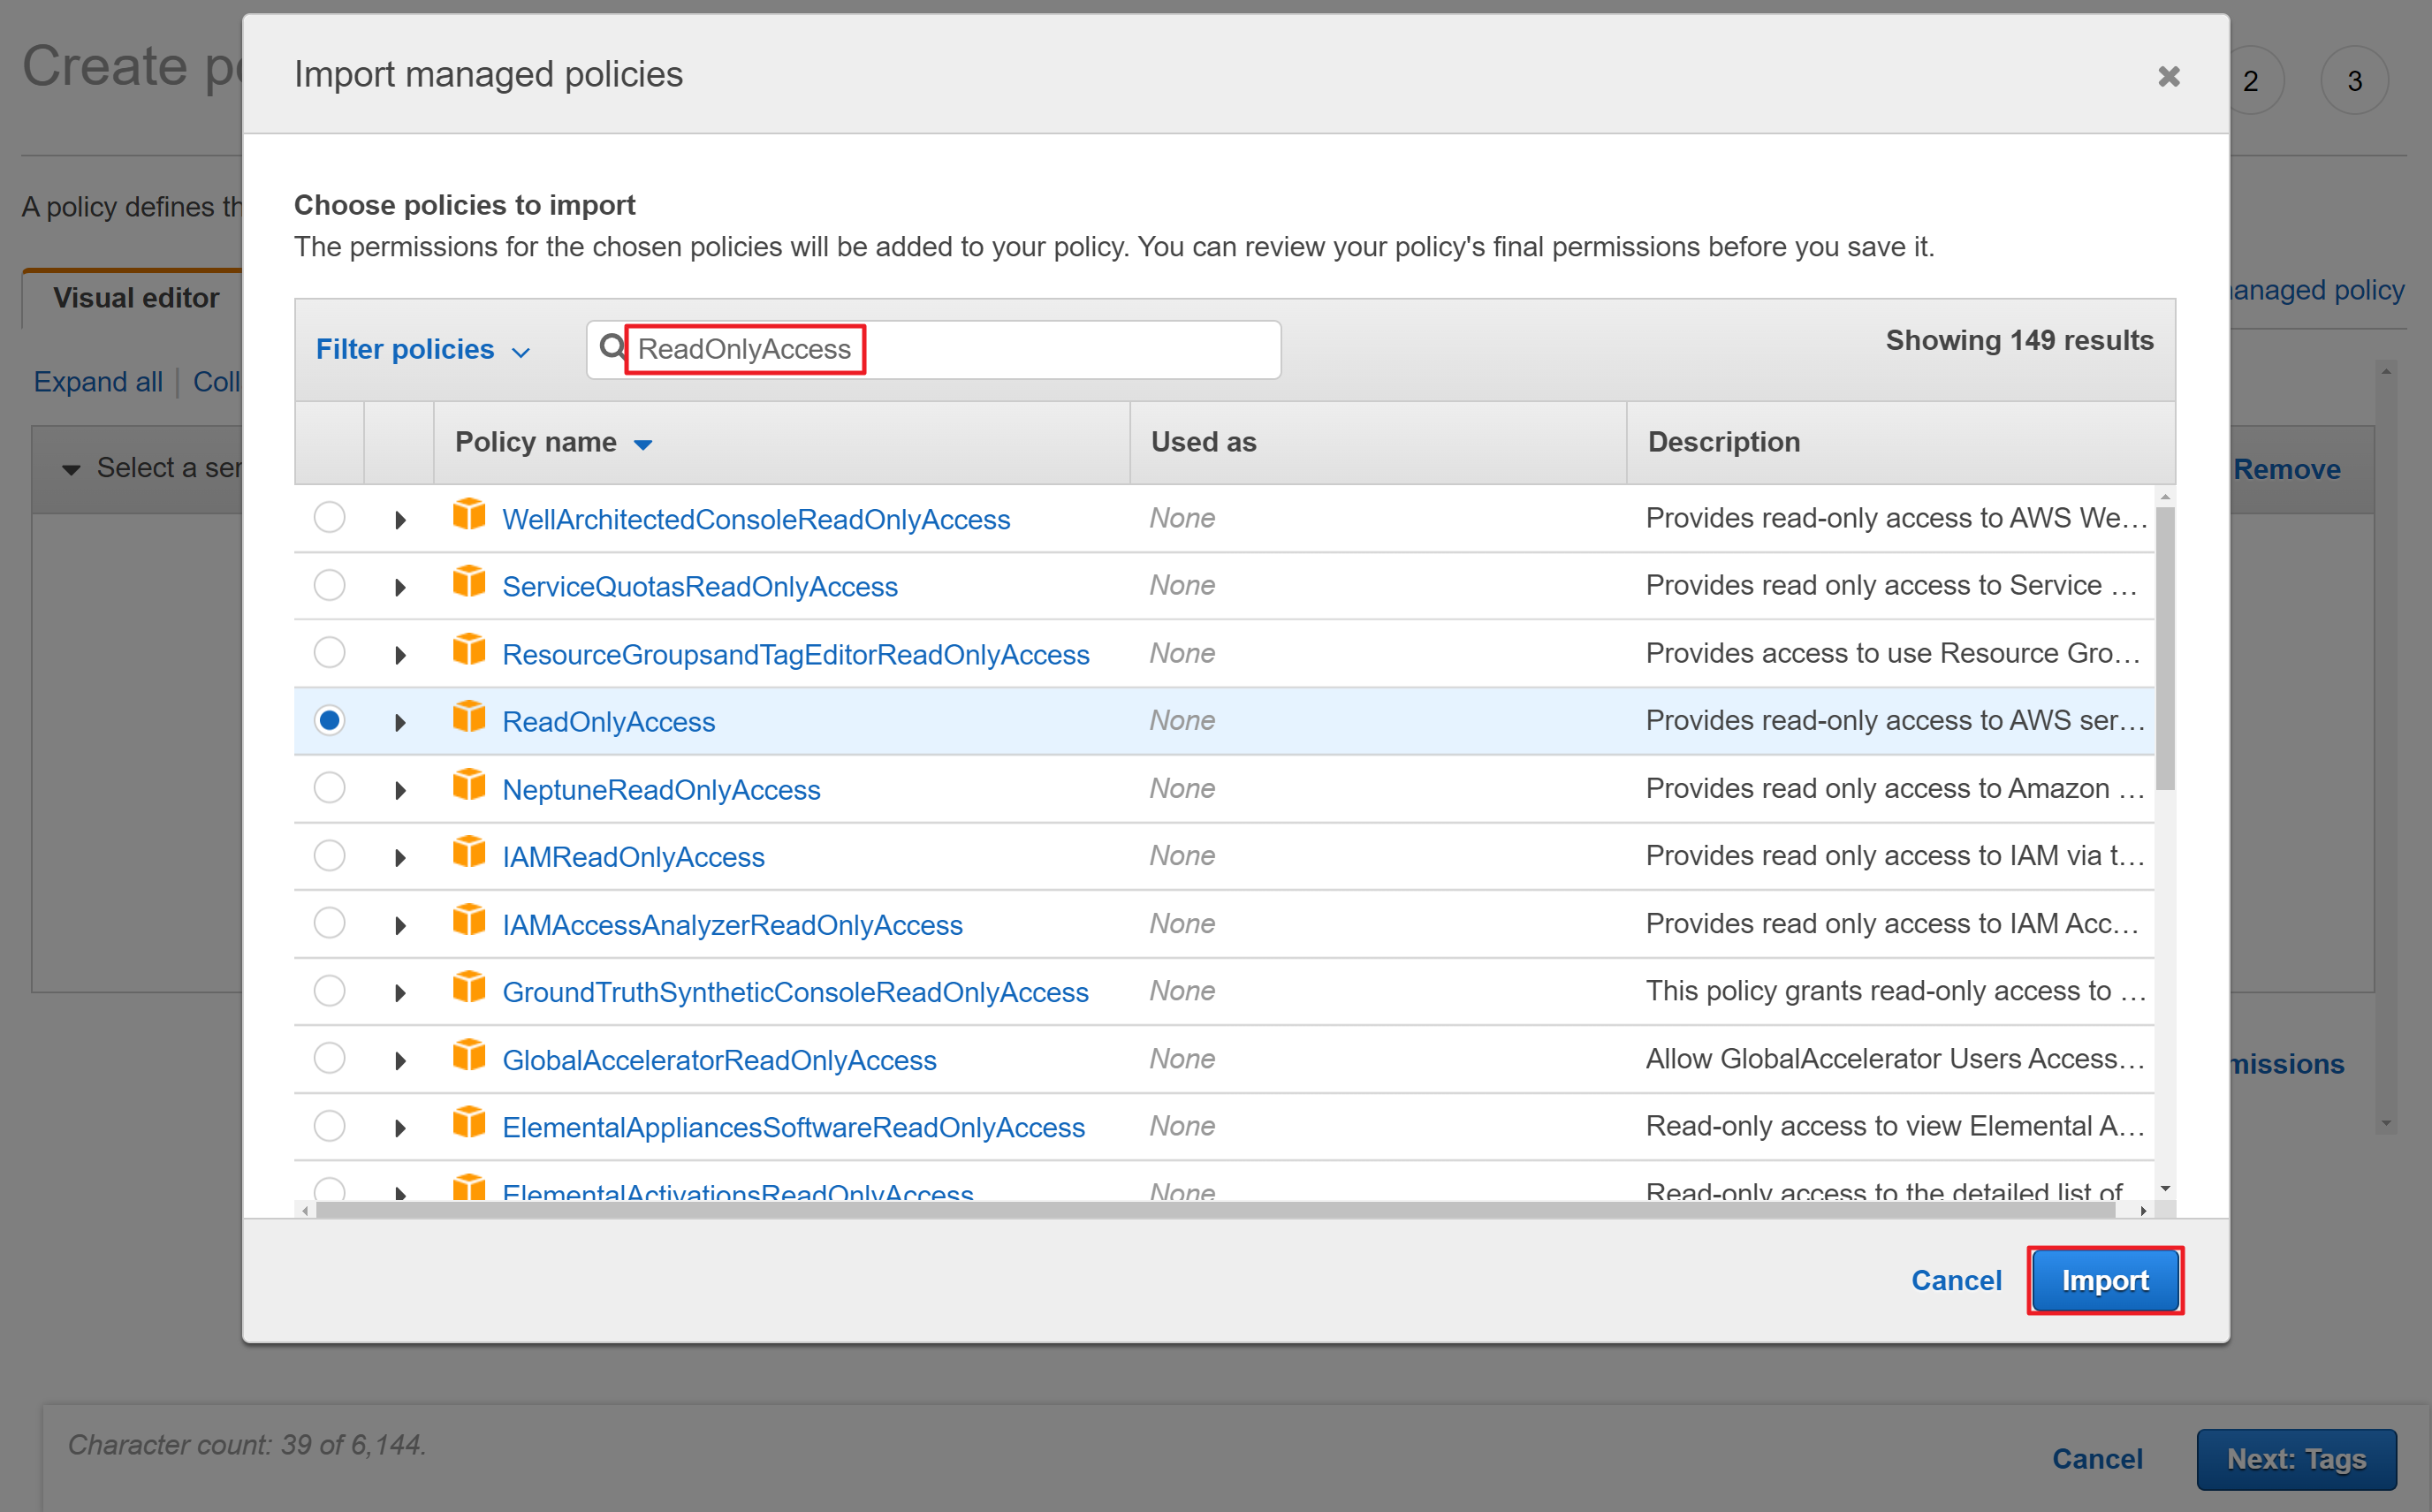
③ Search [ReadOnlyAccess] and click [Import] to import the [ReadOnlyAccess] policy.
④ Click [Add additional permissions] to select the service you want to add permission.
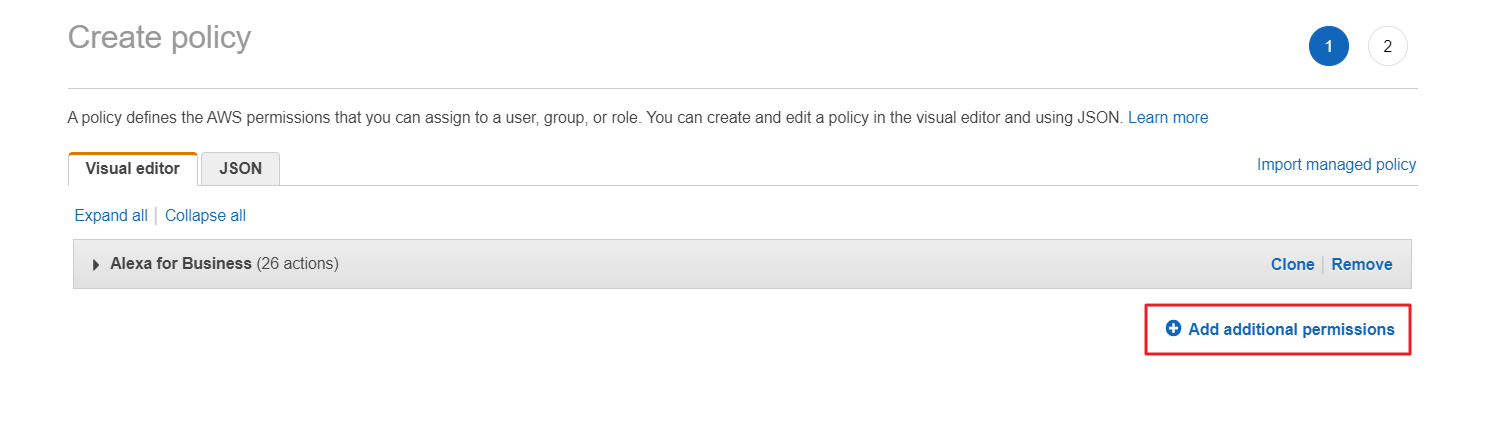
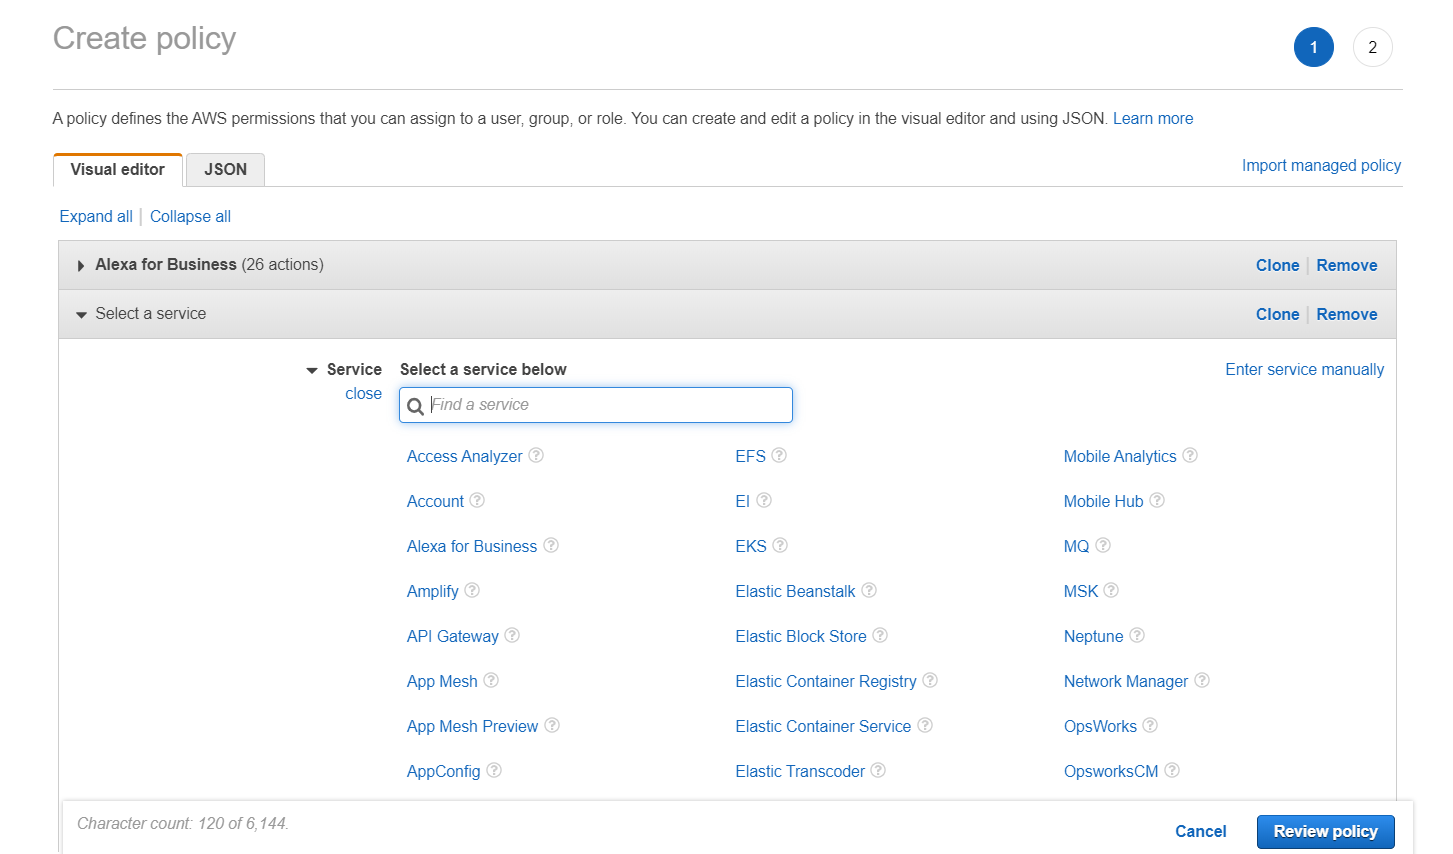
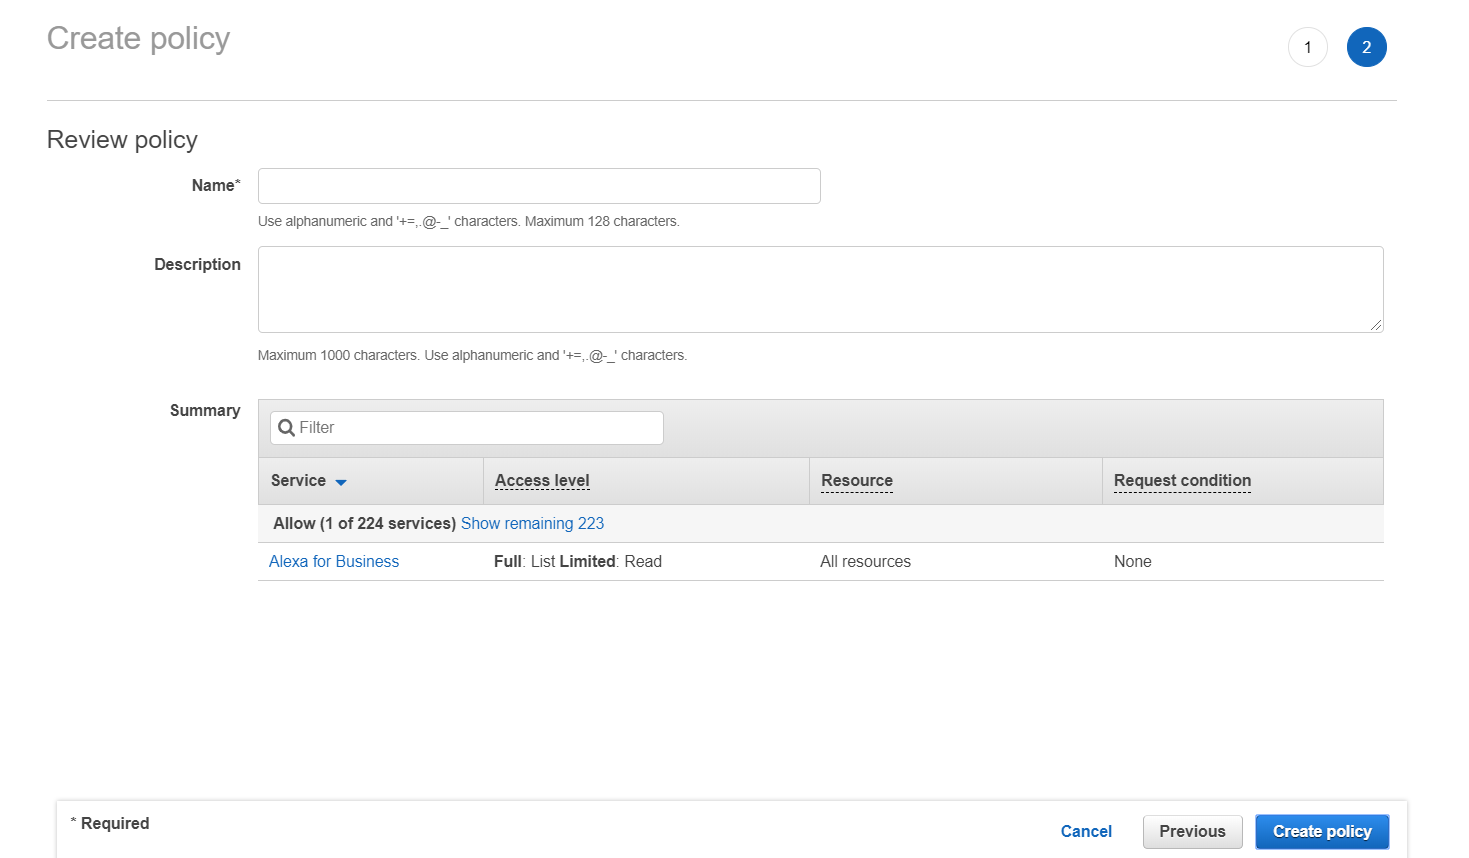
⑤ Once you have finished selecting the services for which you want to add permissions, click [Review policy] to review the policy. After reviewing the policy, click [Create policy] to generate the new policy.
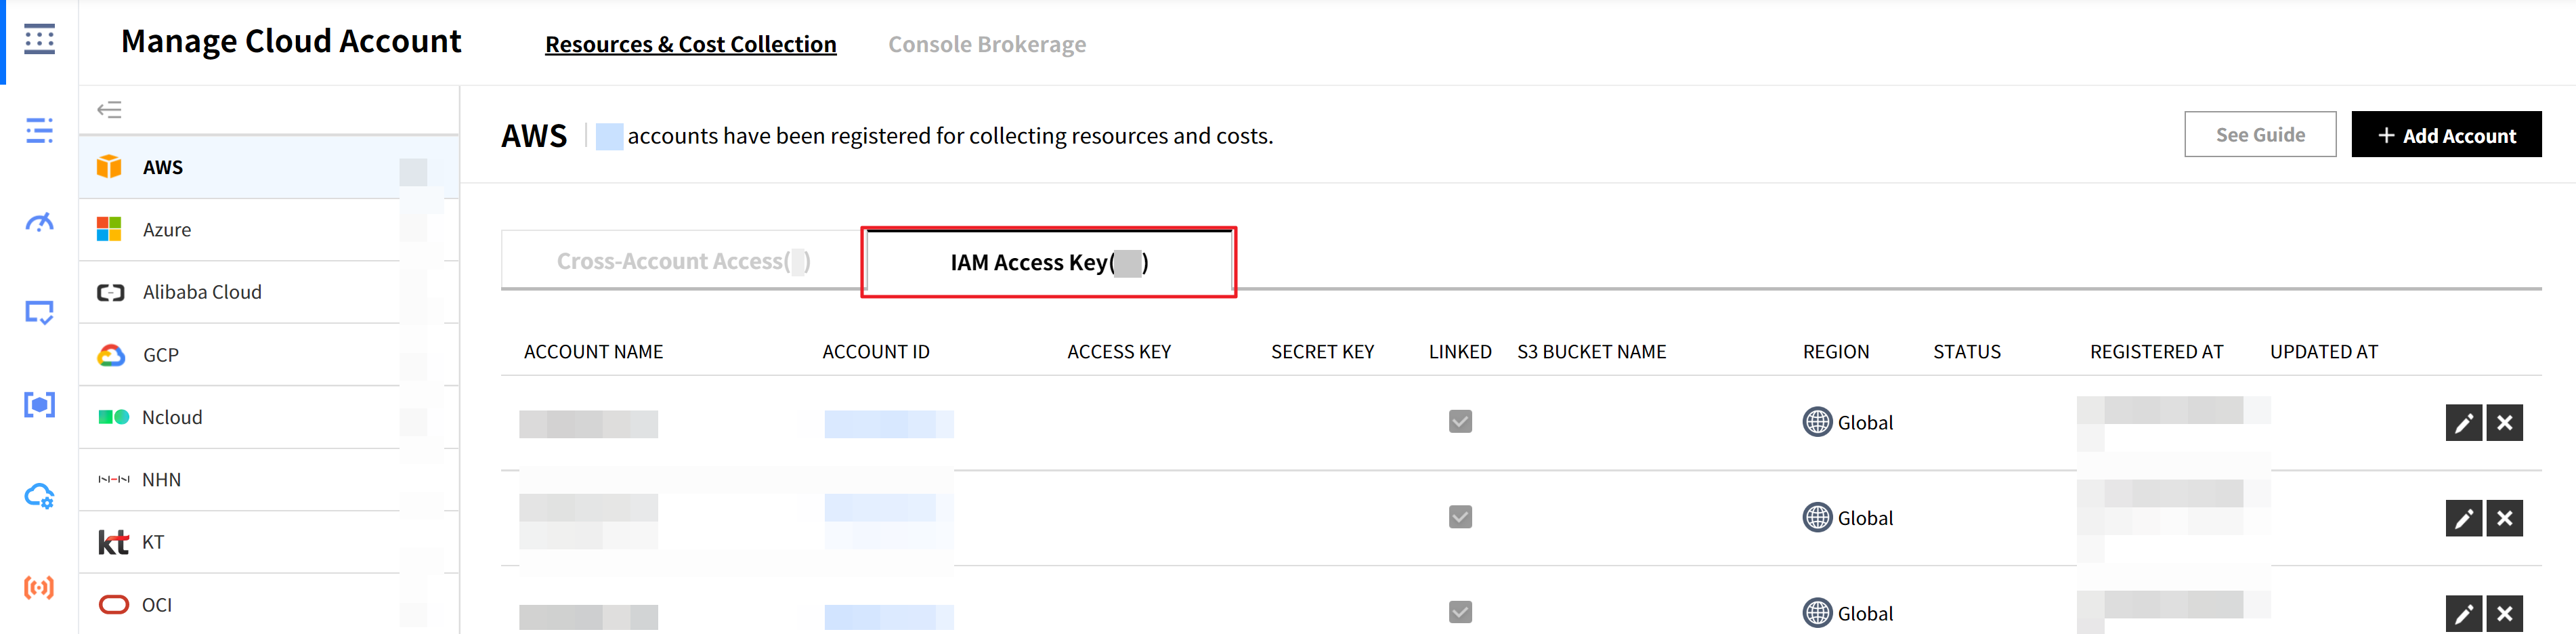
⑥ Since you updated the IAM policy permissions in the AWS management console, you also need to update the existing account information registered in the Service Portal > Cloud Account Management. For detailed instructions, please refer to the guide on Register AWS Accounts > Register with IAM Access Key.
⑷ You should check the Policy Versions tab in the policy summary to ensure that the latest version is set as the default. Click on the version name to verify if there are any resources for which you lack permissions to collect data.
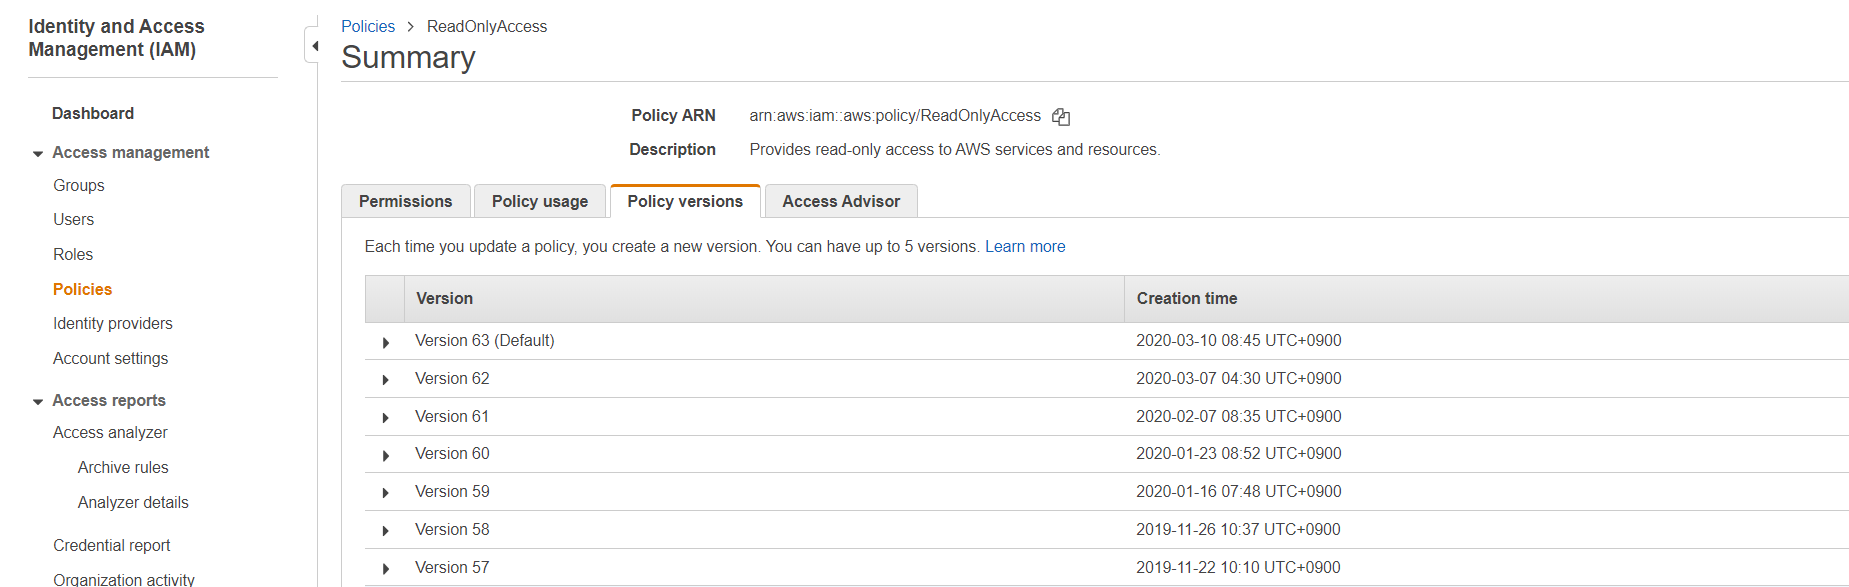
⑸ If there are still resources for which you lack permissions to collect data, you should repeat the process of creating a new policy and adding the necessary permissions for those resources following the steps ① to ⑥ described earlier.
Manage IAM Policies to Add the Permissions
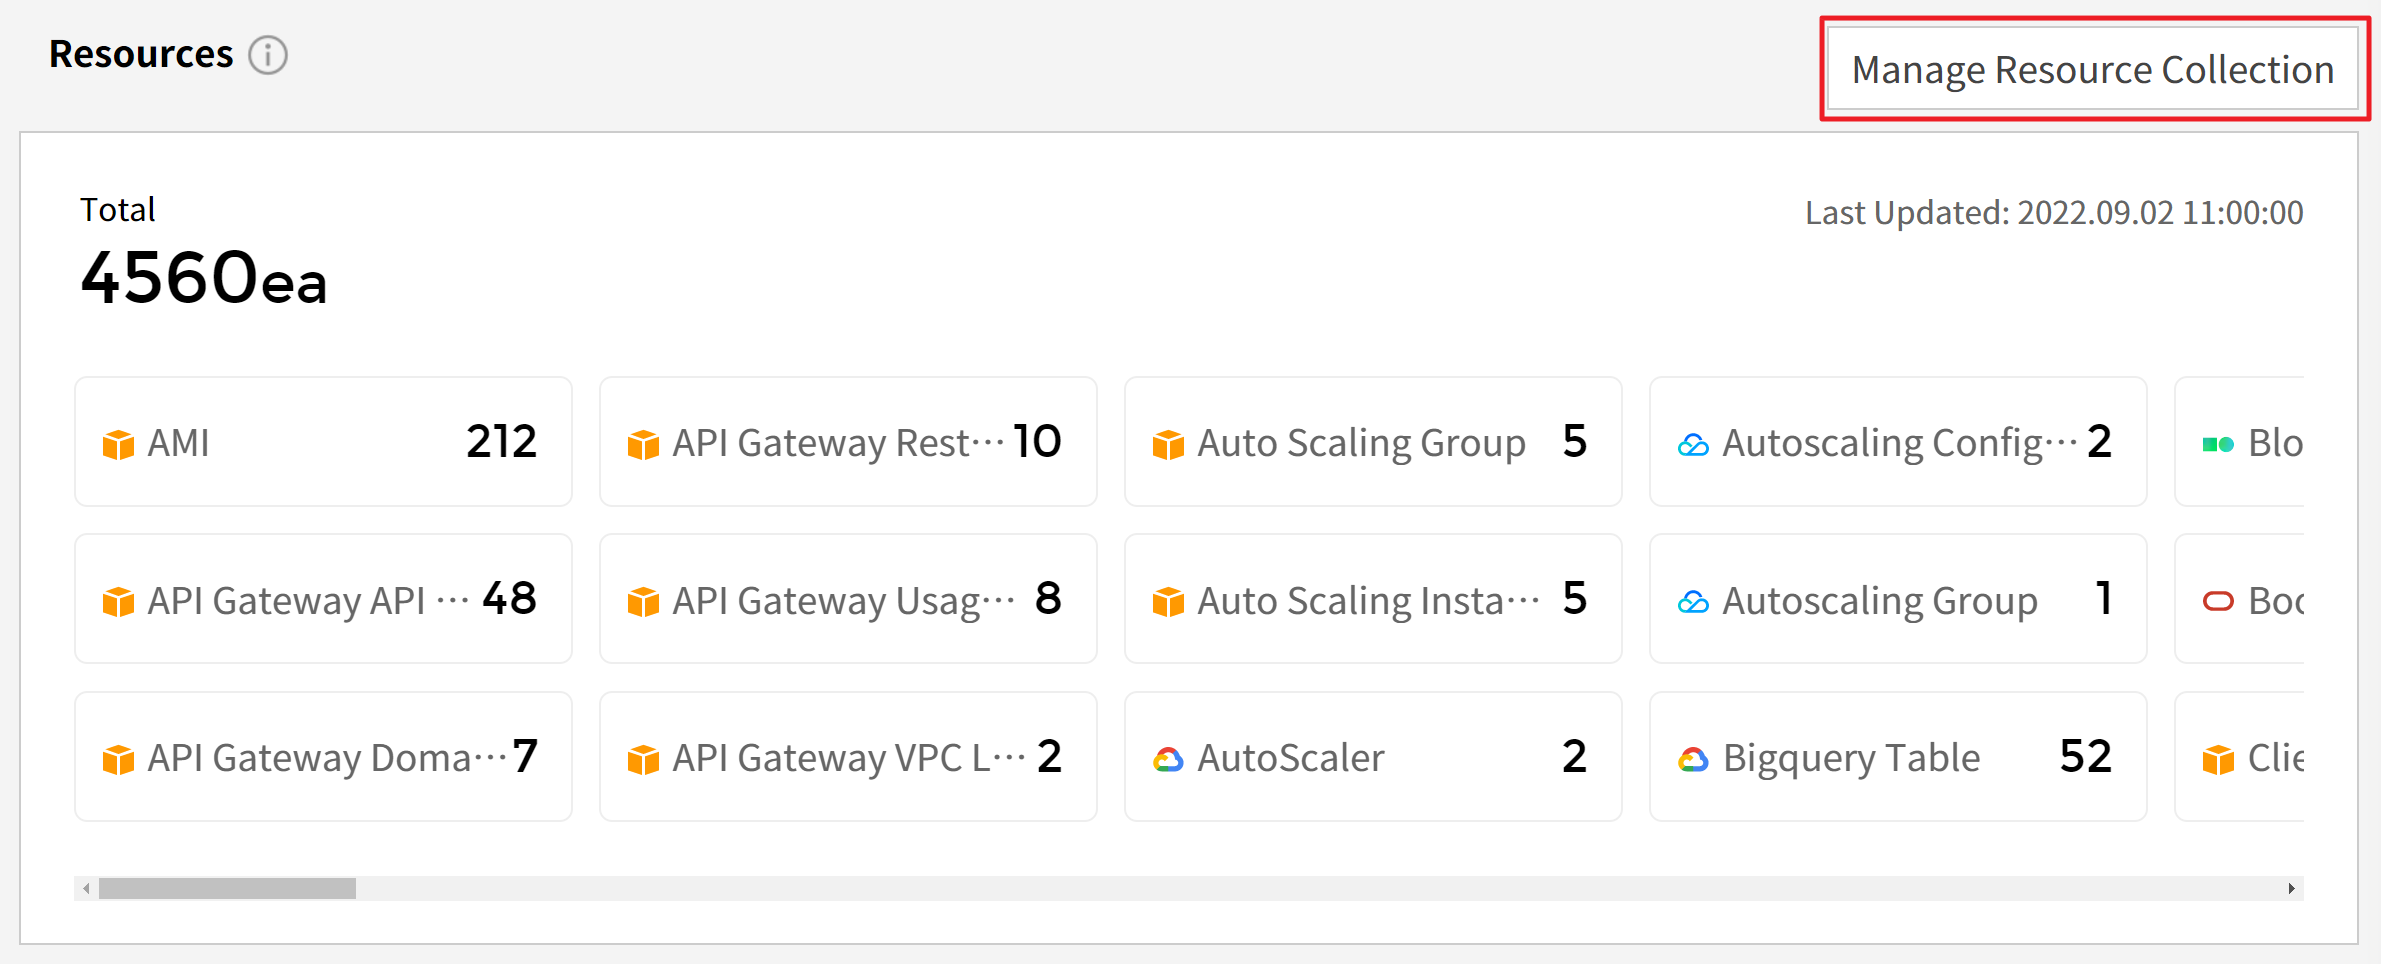
On the Asset Dashboard screen, you can click the [Manage Resource Collection] button located at the top right of the Resources section. By doing so, you can access Asset Management, where you can view and manage the list of resources being periodically updated and their policy permissions. If the view permission is displayed as No IAM Permission, you can follow the guide below to change the IAM permissions in the AWS management console and configure the resource data collection settings.
⑴ Sign in to the AWS management console, then navigate to the IAM menu. From the left-hand side menu, select Policies and then search for the policies associated with your cloud account. Most commonly, you will find the policy named [ReadOnlyAccess], so you can search for or filter the policy list accordingly.
⑵ When you click on the [ReadOnlyAccess] policy, you can review the permissions set for that policy. From there, you can search for [IAM] and click on it to view the resources for which IAM permissions are granted.
⑶ Click [Show remaining OO] to see if there are any uncollected resources because of the lack of permission. If so, you need to create a policy and then add permission to the resource because you cannot directly change the ReadOnlyAccess permission for it is an AWS-managed policy. Follow the step ① to ⑥ below:
① In the [IAM] menu, go to [Policies] page, and click [Create policy].
② Click [Import managed policy].
③ Search [ReadOnlyAccess] and click [Import] to import the [ReadOnlyAccess] policy.
④ Click [Add additional permissions] to select the service you want to add permission.
⑤ When you are done with adding permissions, click [Review policy] to review the policy, and then click [Create policy].
⑥ Since you updated the IAM policy permissions in the AWS management console, you also need to update the existing account information registered in the Service Portal > Cloud Account Management. For detailed instructions, please refer to the guide on Register AWS Accounts > Register with IAM Access Key.
📌 Important! AWS S3 Resource Collection Incurs Costs
When collecting data from AWS S3, there may be charges according to AWS’s pricing policies. AWS imposes fees based on the number of requests made to S3 buckets and objects using API/SDK. The fees vary depending on the type and quantity of S3 usage. For detailed information, please refer to the Amazon S3 pricing. If you have any further questions, please feel free to contact our support team.
Servers
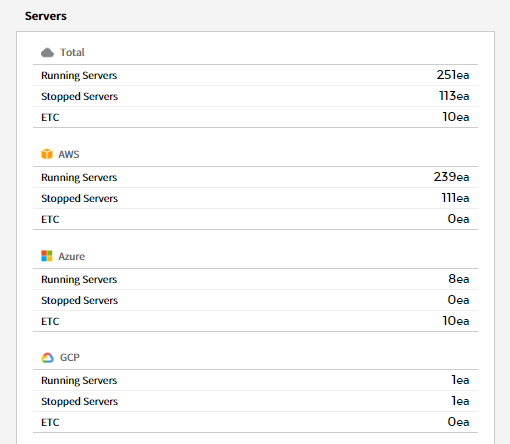
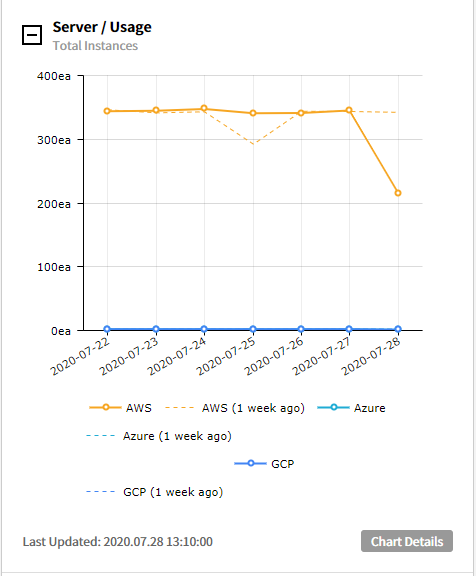
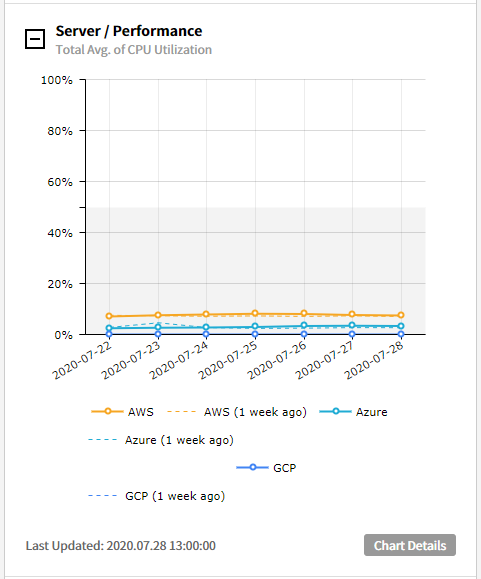
You can view the number of servers for each cloud service categorized by their status, along with usage and performance information presented in graphs.
⑴ Server/Usage - Total Instances: Graphs are provided for server usage over the last 7 days and the previous week.
⑵ Server/Performance - Total Avg. of CPU Utilization: Average CPU Usage over the last 7 days and the previous week is presented in graphs.
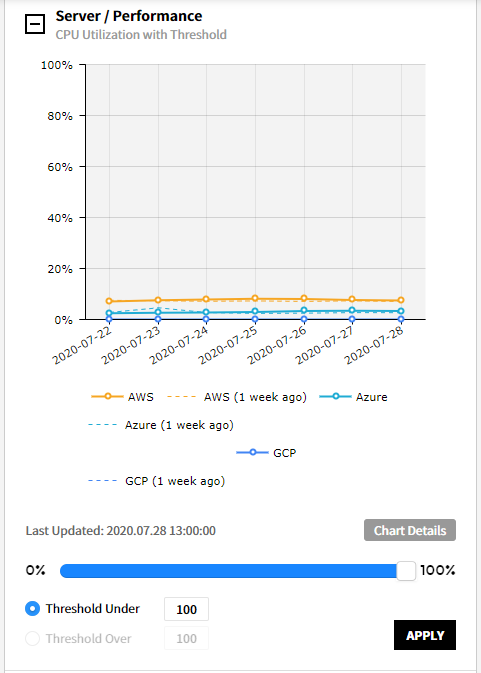
⑶ Server/Performance - CPU Utilization with Threshold: Graphs are provided to display CPU usage exceeding or falling below the configured threshold values.
⑷ Server/Performance - Memory Utilization with Threshold: Graphs are provided to display memory usage exceeding or falling below the configured threshold values.
⑸ Server/Performance - Disk Utilization with Threshold: Graphs are provided to display disk usage exceeding or falling below the configured threshold values.
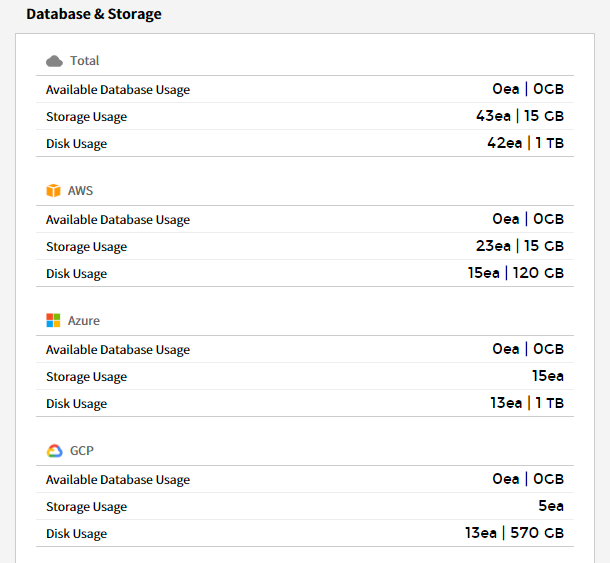
Database & Storage
You can view graphs presenting the usage and performance information of the databases, storage, and disks in use.
⑴ Database/Usage - Total Instances: Graphs are provided to display the database usage over the last 7 days and the previous week.
⑵ Storage/Usage - Total Instances: Graphs are provided to display the storage usage over the last 7 days and the previous week.
⑶ Disk/Usage - Total Instances: Graphs are provided to display the disk usage over the last 7 days and the previous week.
⑷ Database/Performance - CPU Utilization with Threshold: Graphs are provided to display CPU usage exceeding or falling below the configured threshold values.
⑸ Database/Performance - Average Read IOPS/Write IOPS: Graphs are provided to display read IOPS and write IOPS usage exceeding or falling below the configured threshold values.
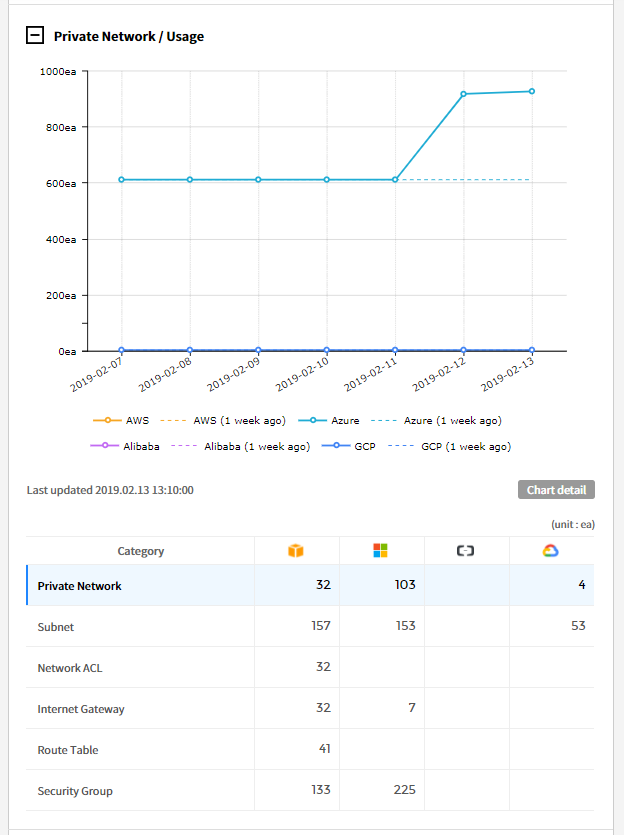
Network
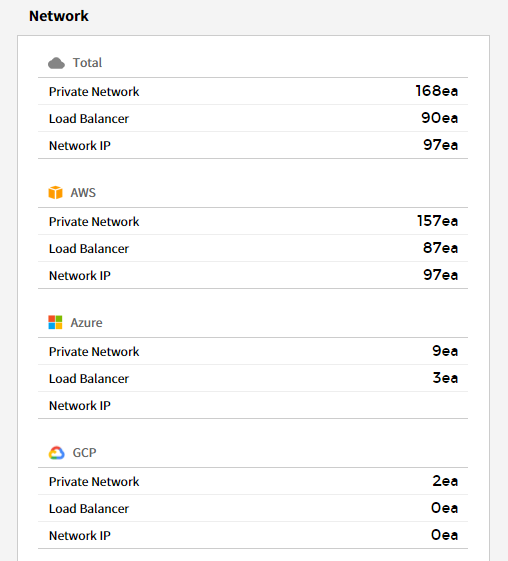
You can check the currently used network usage in a graph.
⑴ Private Network/Usage: Graphs are provided for private network usage over the last 7 days and the previous week. The bottom of the graph displays a list of cloud services along with the number of resources. You can select each resource from the table to view its corresponding graph.
⑵ Network IP/Usage: Graphs are provided for network IP usage over the last 7 days and the previous week. The bottom of the graph displays a list of cloud services along with the number of resources. You can select each resource from the table to view its corresponding graph.
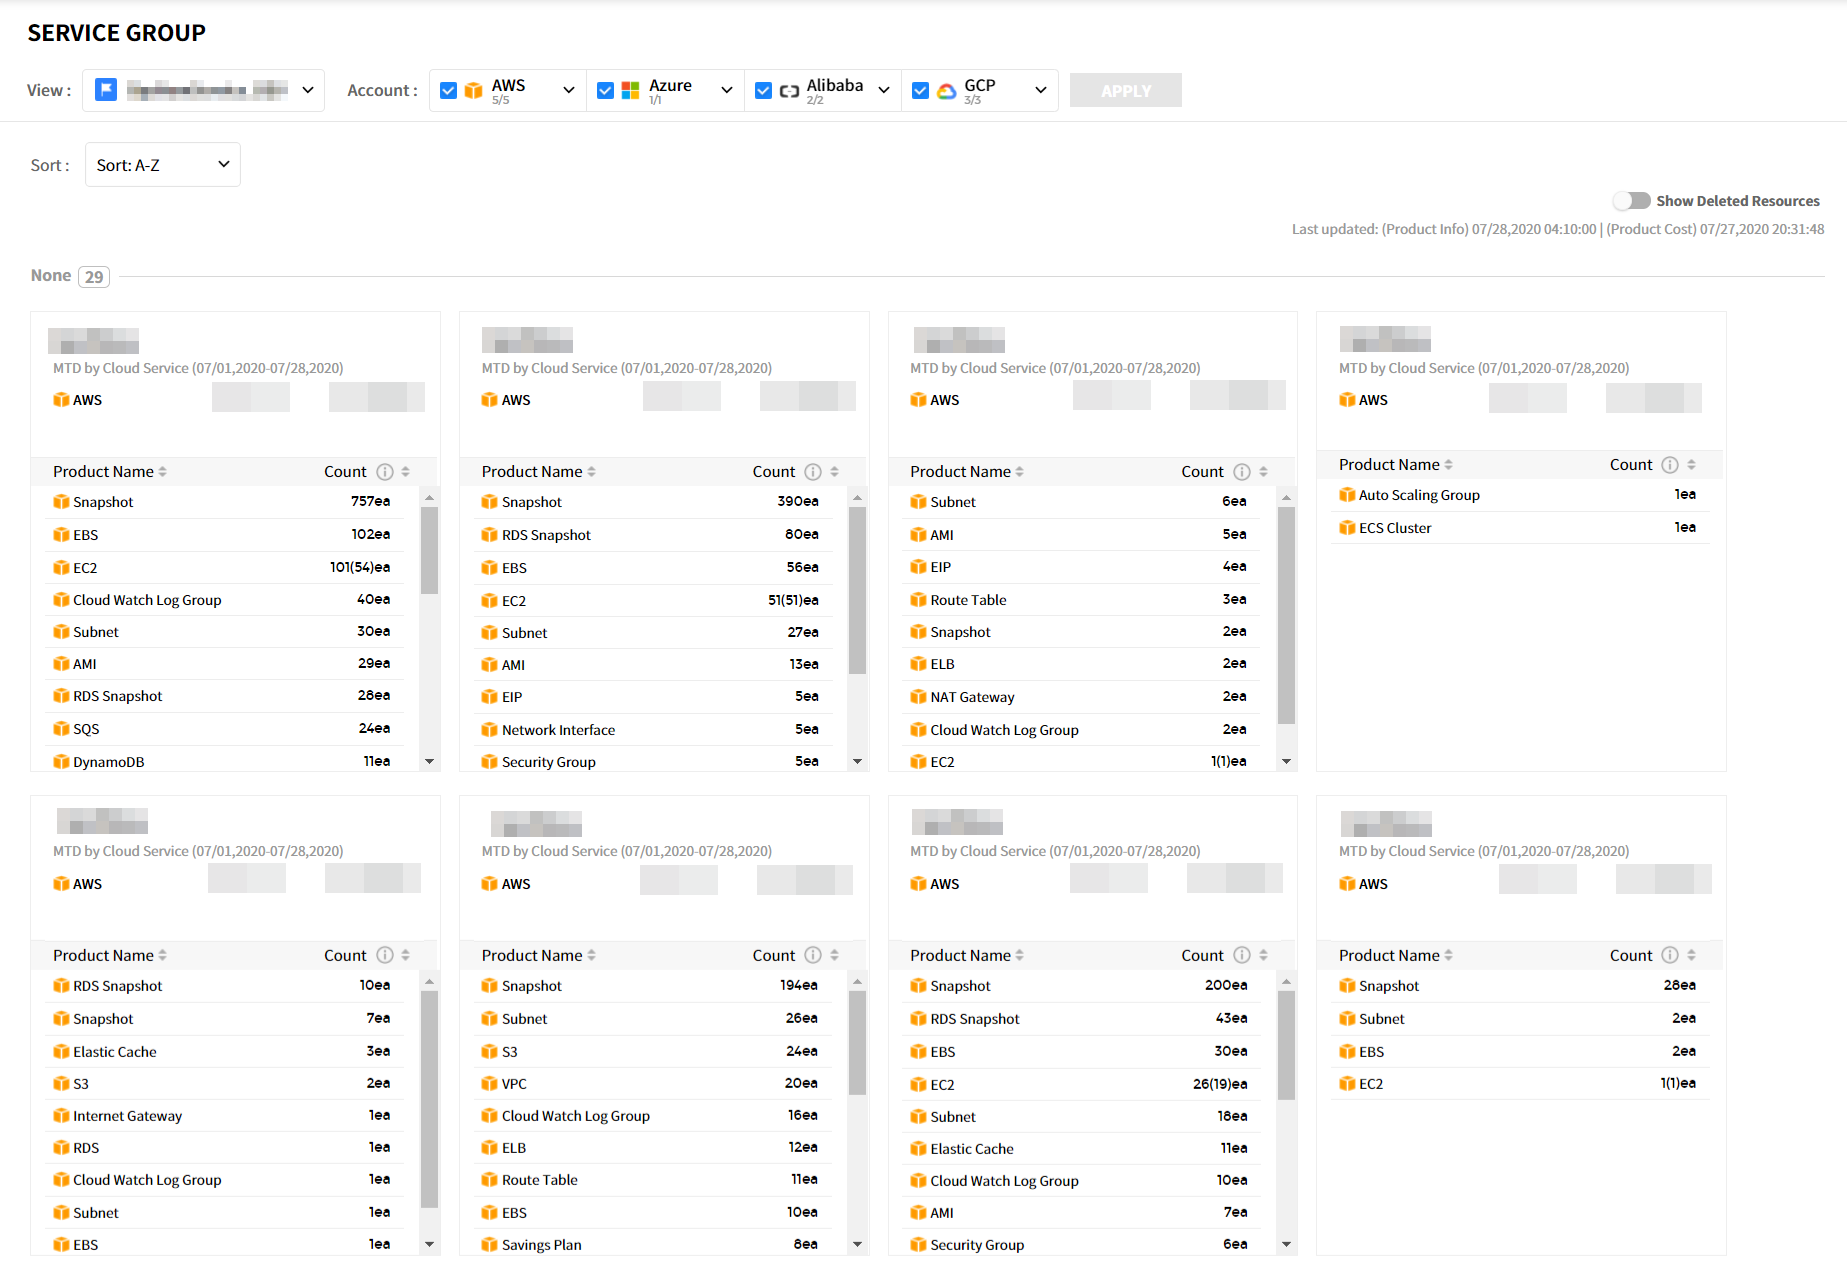
Service Group
Asset > Service Group
Users have the flexibility to categorize and group resources in their entire cloud environment based on their specific needs. By creating Views according to different criteria, resources can be grouped and categorized using Categories and Service Groups within each View. The Service Groups are structured as follows:
| Item | Description |
|---|---|
| View | You can create views by resources. If you select the created view and click the [Apply] button, you can check the category, resource status per service group, and MTD by Cloud Service. The default View is displayed as the default value. |
| Cloud Service | The cur | rently used cloud services and the number of resources for each service are displayed. |
| Show Deleted Resou | rces | If you switch the toggle button for displaying deleted resources to the “On” position, deleted resources will be displayed within each service group. |
| Service Group Card | Service | groups display the number and types of resources in use, along with the associated costs incurred. |
| - Service Group Name: The user-defined service group names are displayed.
+———————————+———————————————————————————————————————————–+
📌 Important! f there are no resources in the service group, you need to add them through the Service Group Management menu in the Service Portal. For detailed instructions on adding resources, please refer to the Service Portal User Guide > Service Group > Adding Resources.
Usage
Asset > Usage
You can check the resource usage and usage history for each cloud service.
Current
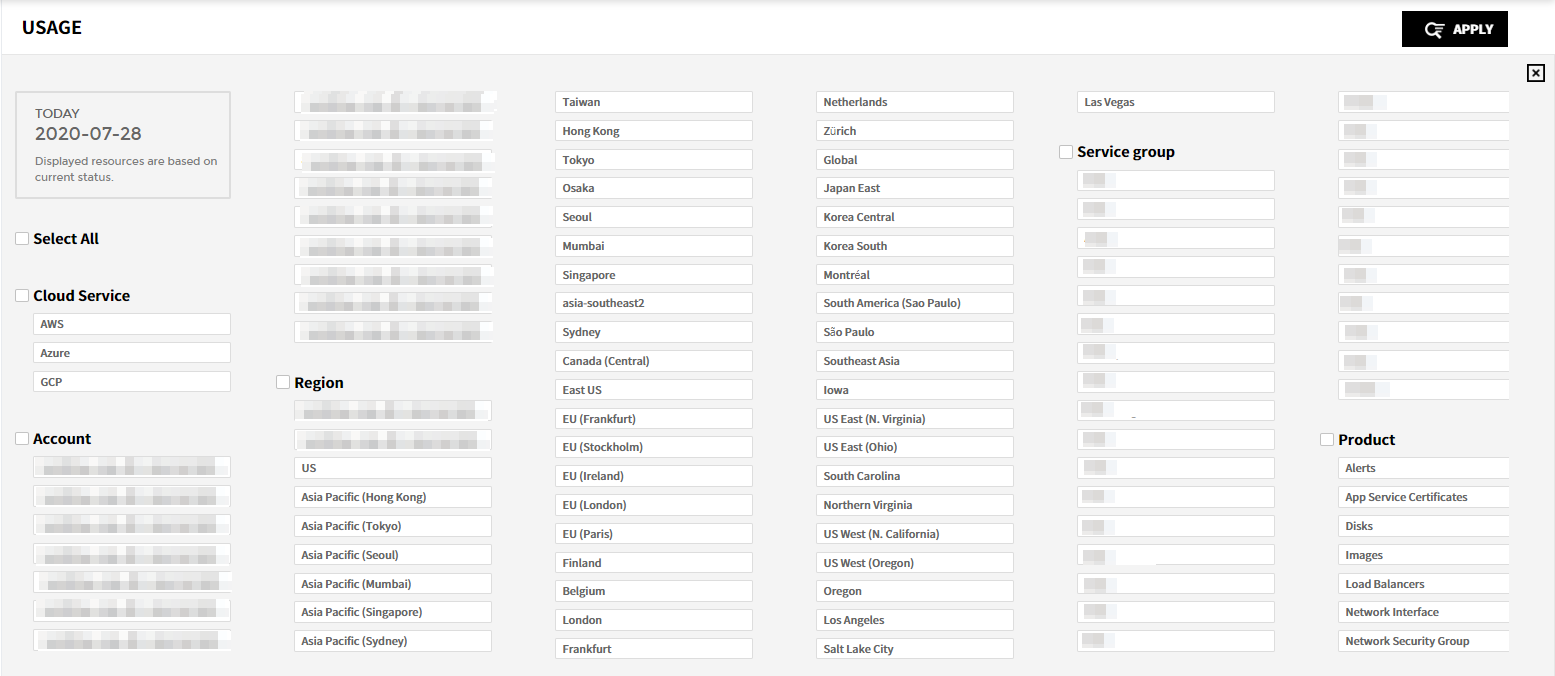
You can check resource usage for each cloud service.
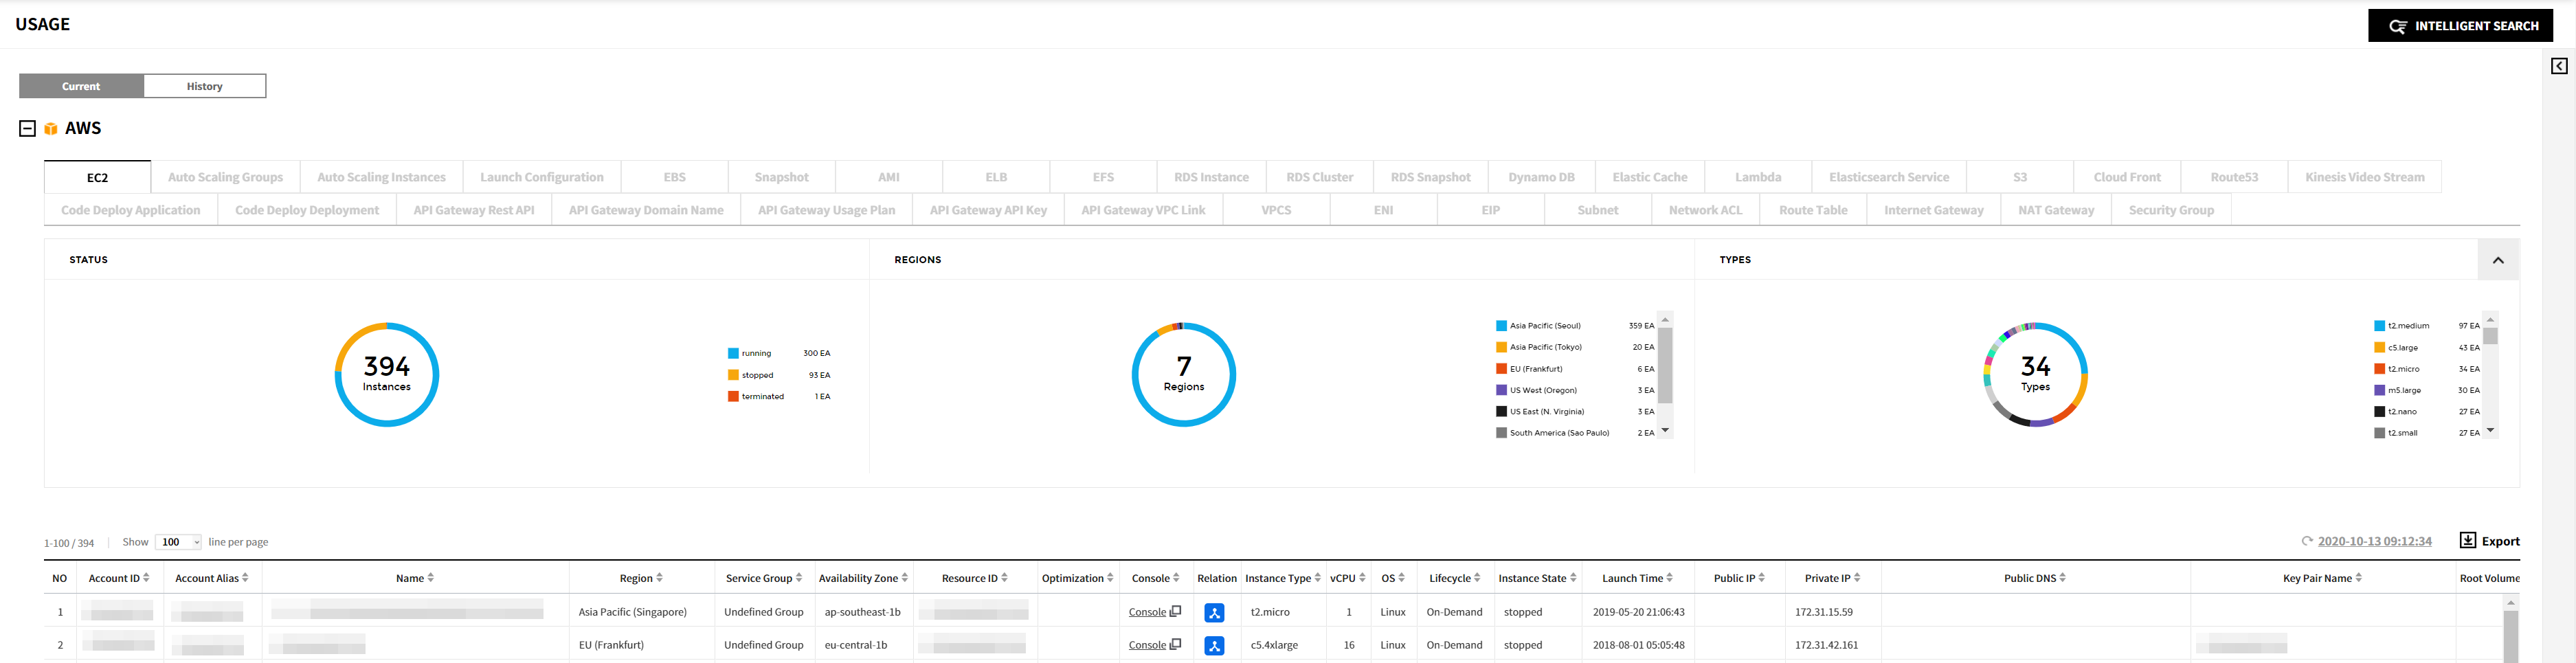
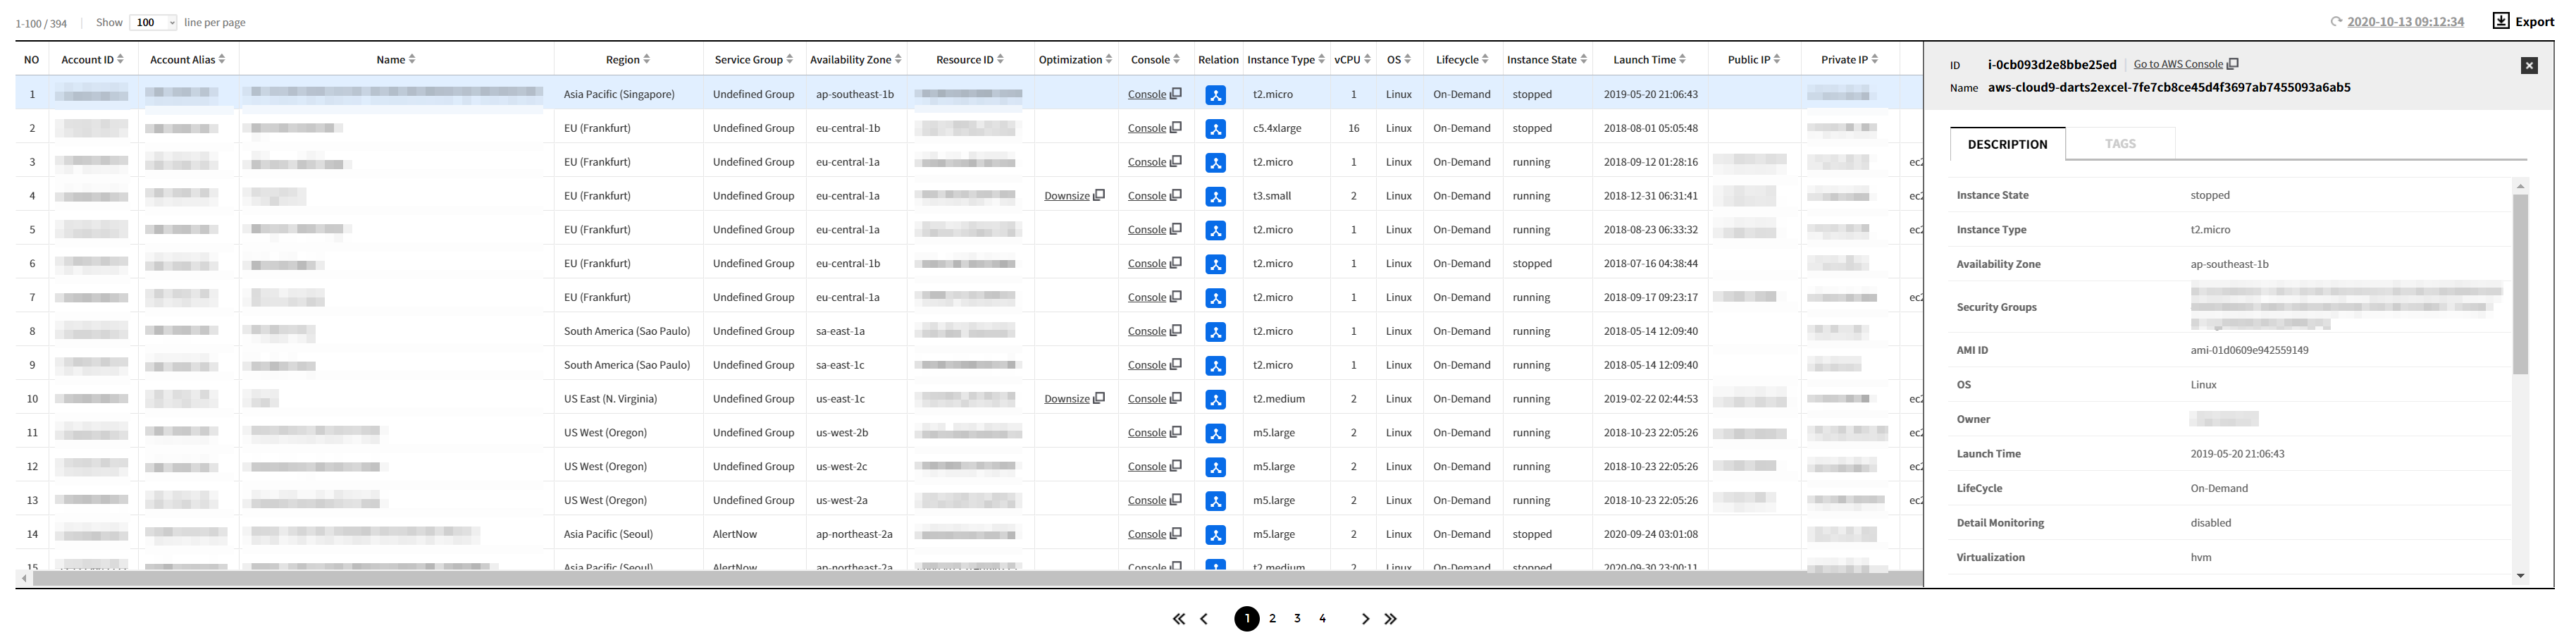
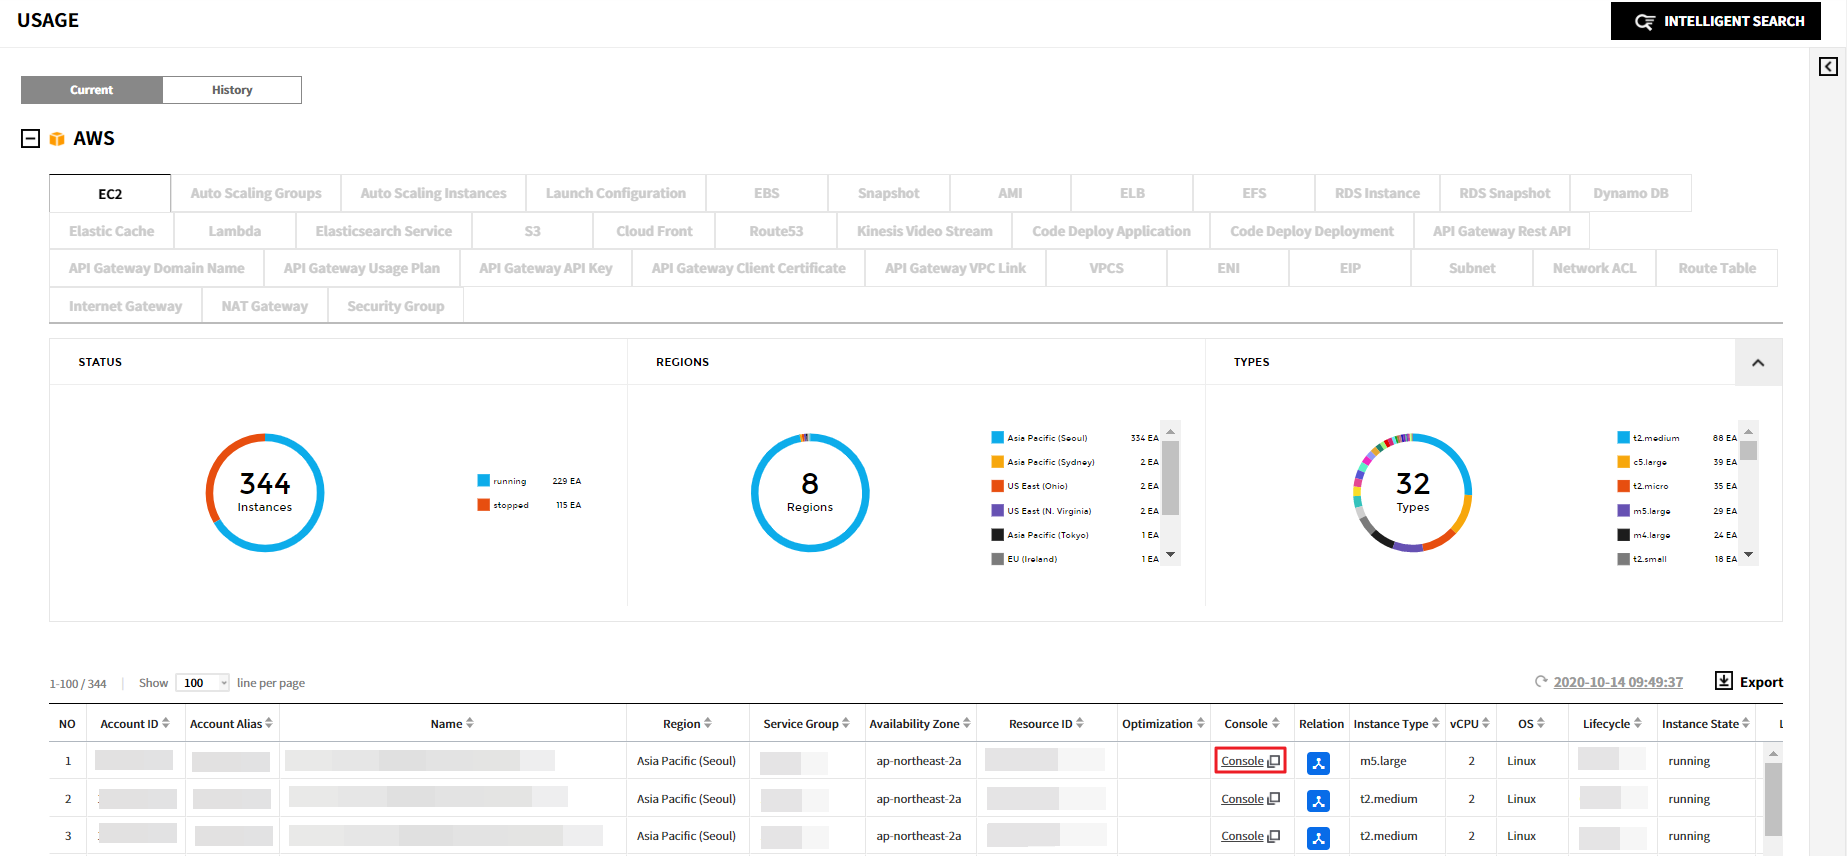
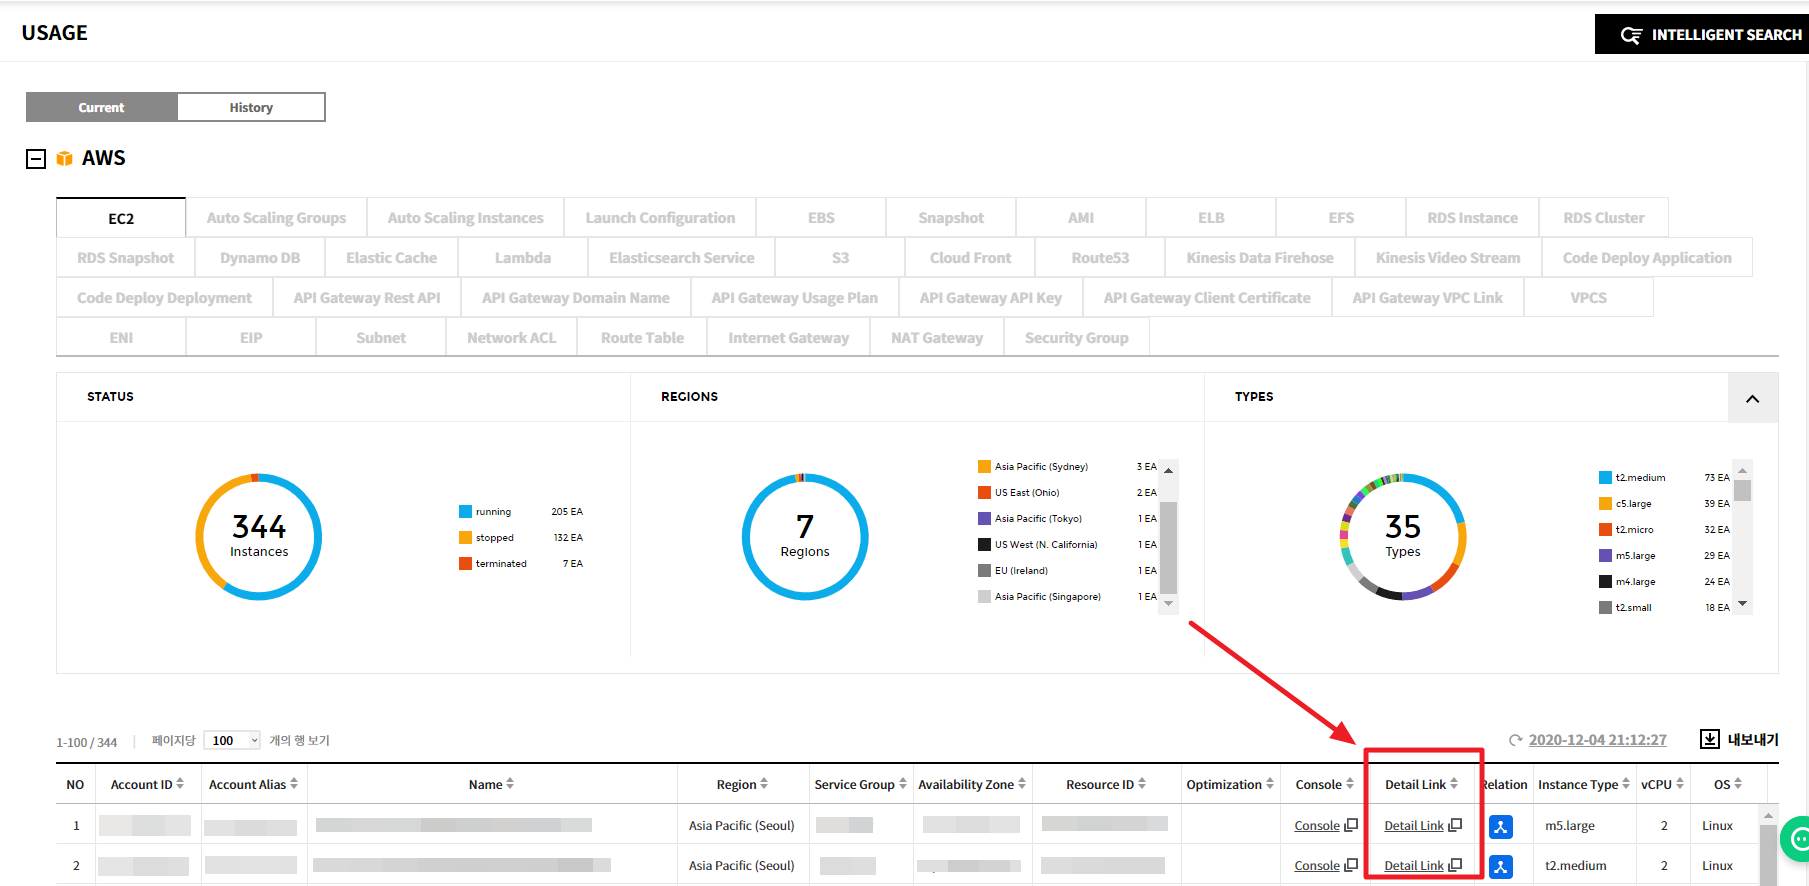
Pie charts are provided to display the number of resources by their status, region, and type. The table below shows the list of resources in use, and by clicking on a resource from the list, you can view its detailed information. For certain resources within AWS, Azure, GCP, Ncloud, and Alibaba Cloud services, you can also explore the Relation Map.
AWS
You can check the resource usage for the following AWS resources.
AMI, EBS, EC2, EIP, Internet Gateway, Lambda, Network ACL, RDS, Route Table, S3, Security Group, Snapshot, Subnet, VPCS, ELB, Dynamo DB, Elastic Cache, CloudFront, Kinesis Data Stream, ENI, NAT Gateway
Go to the AWS Console
We provide the functionality to directly access the AWS console so that users can verify information for the desired resources. You can use either of the following two methods to navigate to the AWS console:
A. Go to the AWS console by clicking the [Console] link in the Resource List’s Console column.
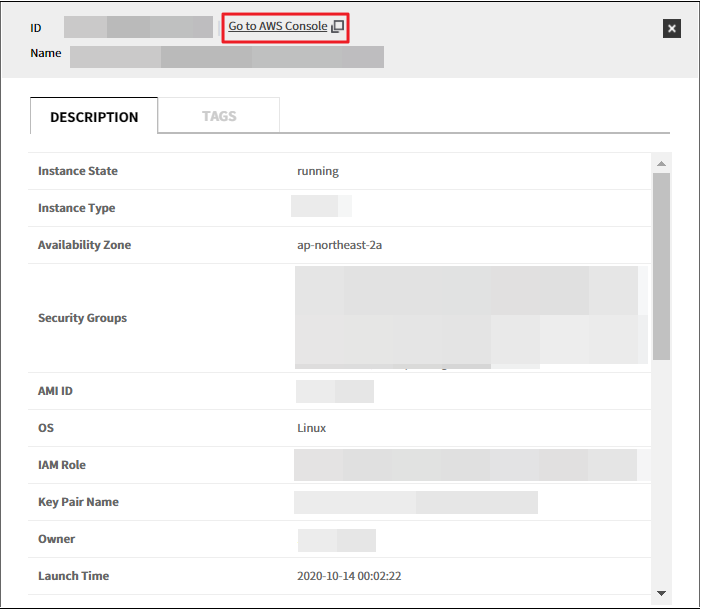
B-1. When you click on a resource in the resource list, a details screen appears. At the top of the details screen, there is a [Go to AWS Console] button. Click on this button to navigate to the AWS console.
B-2. If you select one of two ways above, the following pop up message will appear and then you’ll be taken to the AWS Console. If you are not signed in to the AWS console, you will go to the sign in page.
After clicking [Go to AWS Console], a popup message appears with the following options:
To view the resource details on AWS, click View Product Details.
To monitor the resource’s performance information, click View Monitoring Information.
If you are not already logged into the AWS console, you will be redirected to the AWS login page.
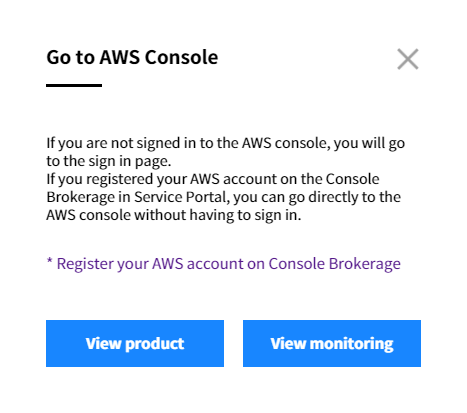
💡 Notification: If an account is registered in the Service Portal’s Console Brokerage, you can directly access the AWS Console without logging in. For detailed information about registering an account in the Console Brokerage, please refer to the Service Portal User Guide > Console Brokerage.
Azure
You can check the usage status of the following resources in Azure.
CDN, Cloud Service, Database, Virtual Network Gateway, Network Security Group, Storage, Virtual Network Subnet, Traffic Manager, Virtual Network, Virtual Machine
GCP
You can check the usage status of the following resources in GCP.
VM Instance, Compute Disk, Big Table, Big Query, SQL Instance, Storage Bucket, VPC, Subnet
Go to GCP Console
Currently, you can directly navigate to the GCP console to check information about the desired resources using one of the following two methods.
A. Click the Console link from the resource list to nagigate to the GCP Console.
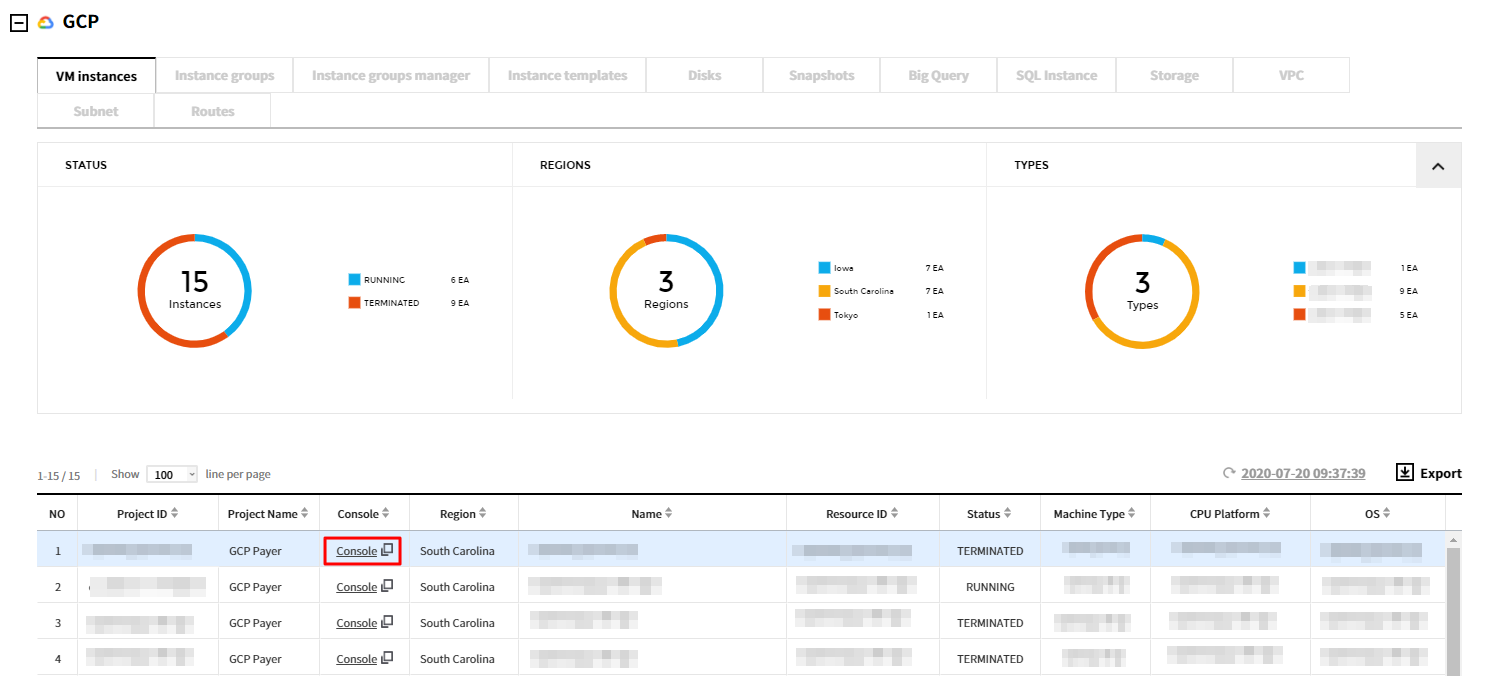
B-1. Click a resource from the list to view the detail page, and then select Go to GCP Console button.
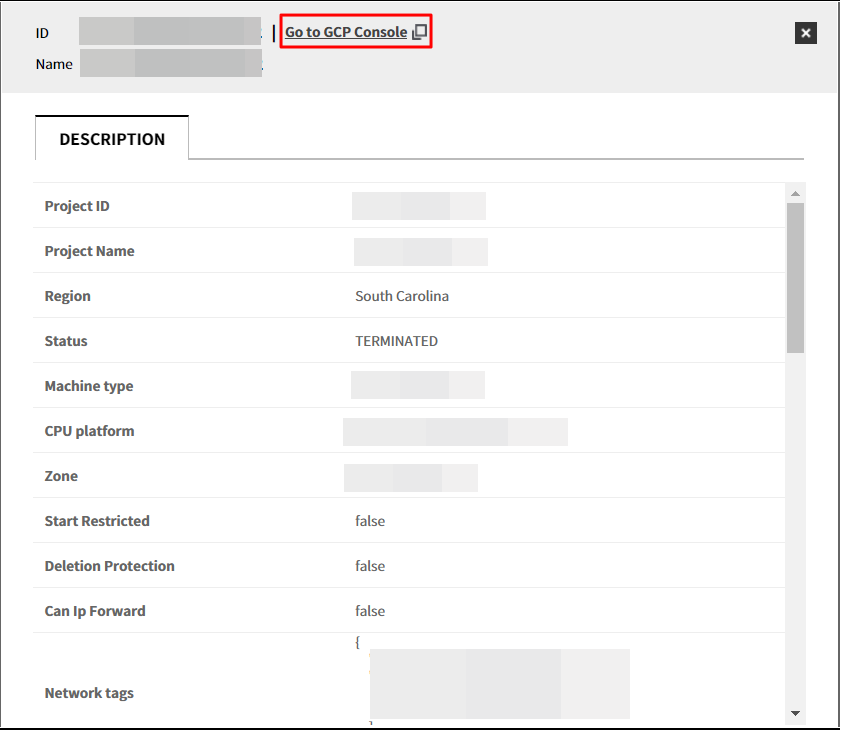
B-2. When you select Go to GCP Console, a popup message will appear. To view the resource details in GCP, click View product, and to check the performance information of the resource, click View monitoring.
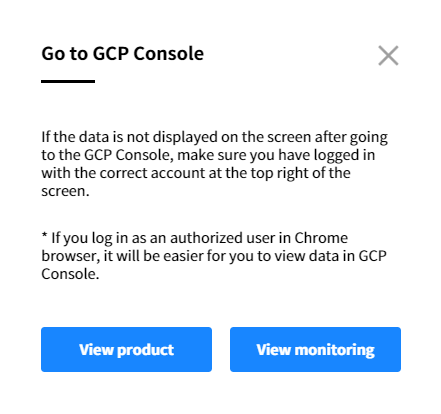
⚠️ Attention: If the data is not displayed in the GCP console, check the account information in the top right corner of the screen to ensure that you are logged in with the correct account. You need to log in with an account that has the appropriate permissions to view the data.
💡 Notification: When logged in as an authorized user in the Chrome browser, you can directly access and view the data in the GCP console, making it more convenient for you.
Alibaba Cloud
You can check the usage status of the following resources in Alibaba Cloud.
Elastic Compute Service, Cloud Disk, Launch Template, Server Load Balancer, Scaling Group, Scaling Instance, Scaling Configuration, Snapshot, Snapshot Chain, Image, ApsaraDB for RDS, ApsaraDB for MongoDB, ApsaraDB for Redis, ApsaraDB for Memcache, HybridDB for MySQL, HybridDB for PostgreSQL, POLARDB Cluster, POLARDB Instance, Object Storage Service, Alibaba Cloud CDN, Elastic IP Address, Security Group, Virtual Private Cloud, NAT Gateway, VPN Gateway, Network Interface
History
You can check the usage history of resources for each cloud service.
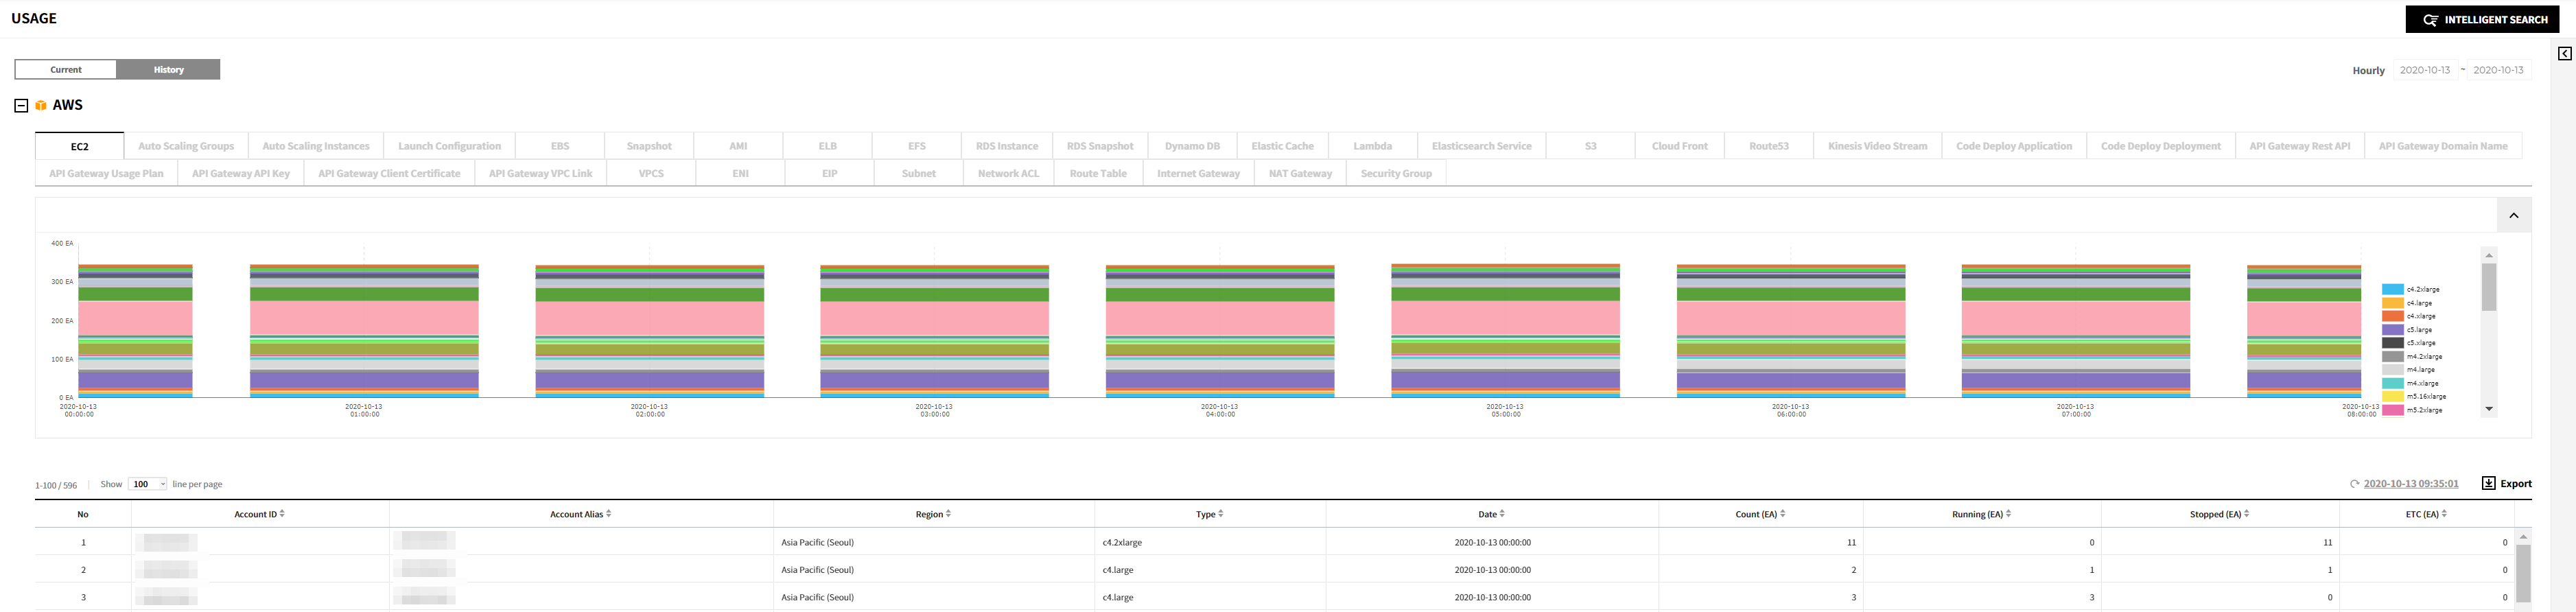
The usage history of resources is provided in graphs, showing the usage on a date-by-date basis. Below the graphs, a table displays the list of resources currently in use.
AWS
You can check the usage history of the following resources in AWS.
AMI, EBS, EC2, EIP, Internet Gateway, Lambda, Network ACL, RDS, Route Table, S3, Security Group, Snapshot, Subnet, VPCS, ELB, Dynamo DB, Elastic Cache, CloudFront, Kinesis Data Stream, ENI, NAT Gateway
Azure
You can check the usage history of the following resources in Azure.
Database, Storage, Virtual Machine
GCP
You can check the usage history of the following resources in GCP.
VM Instance, Compute Disk, Big Table, Big Query, SQL Instance, Storage Bucket, VPC, Subnet
Alibaba Cloud
You can check the usage history of the following resources in Alibaba Cloud.
Elastic Compute Service, Cloud Disk, Launch Template, Server Load Balancer, Scaling Group, Scaling Instance, Scaling Configuration, Snapshot, Snapshot Chain, Image, ApsaraDB for RDS, ApsaraDB for MongoDB, ApsaraDB for Redis, ApsaraDB for Memcache, HybridDB for MySQL, HybridDB for PostgreSQL, POLARDB Cluster, POLARDB Instance, Object Storage Service, Alibaba Cloud CDN, Elastic IP Address, Security Group, Virtual Private Cloud, NAT Gateway, VPN Gateway, Network Interface
Resource Detail
The Resource Detail feature helps users easily view detailed information about the desired resources, including tags, service groups, usage, performance, and activity history, all in one place.
💡 Notification: In the Asset service, you can directly navigate to the Resource Detail from the Usage or Right Sizing menu. To access the Resource Detail, click on the Detail Link for the resource ID you want to view in the Asset console.
Details
You can view resource details on the this tab. This table contains basic information of the resource such as account ID, life cycle, OS, status, instance type, and region. In the body section, you can find detailed information about AWS method calls as well.
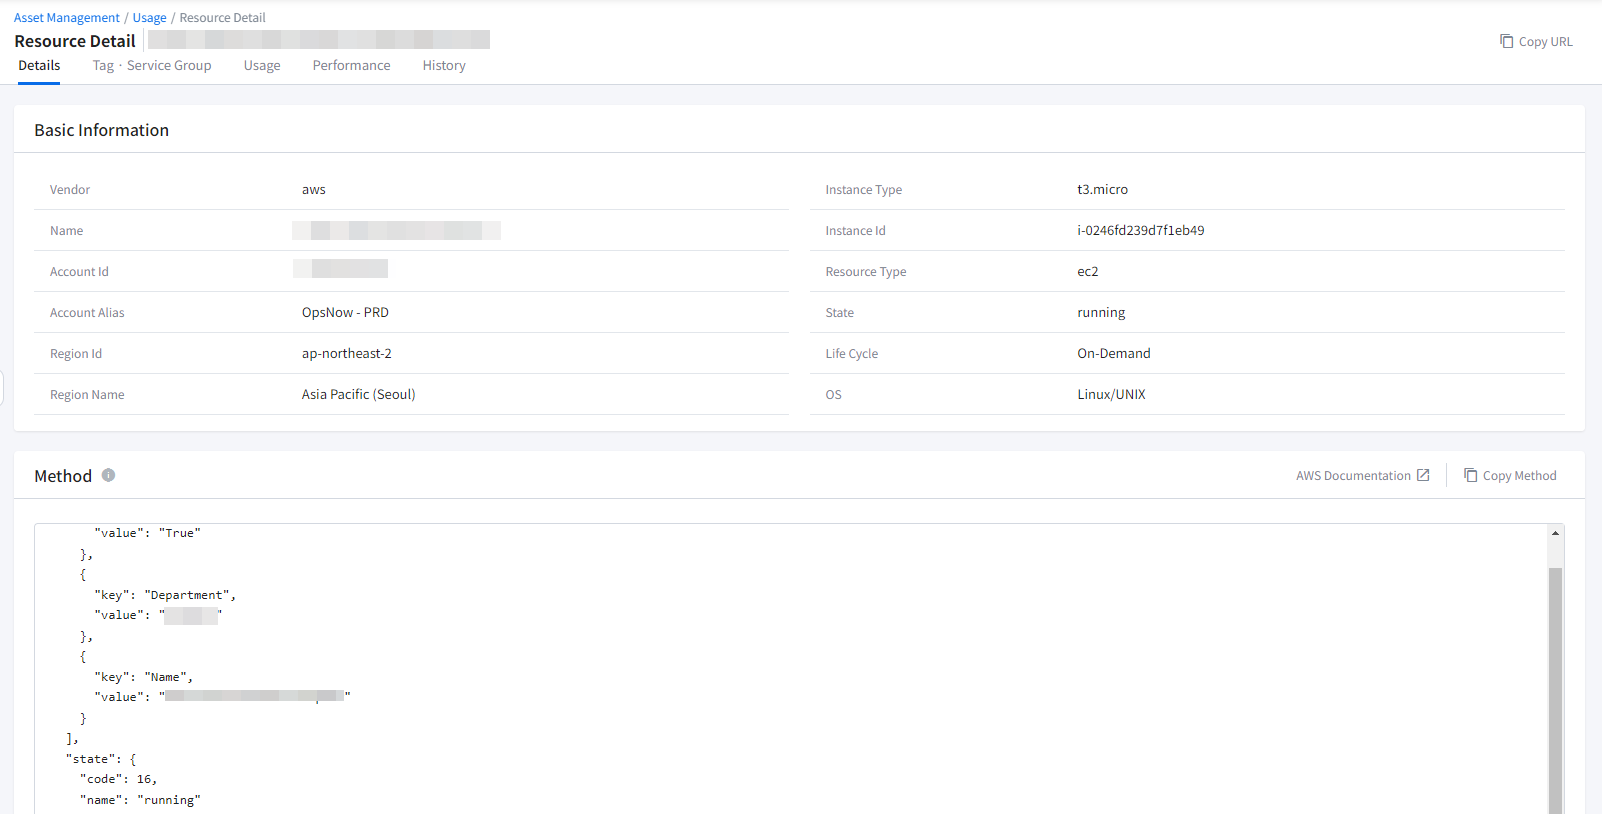
💡 Notification: Click [Go to AWS Documentation] to find out more about the method.
Service Group
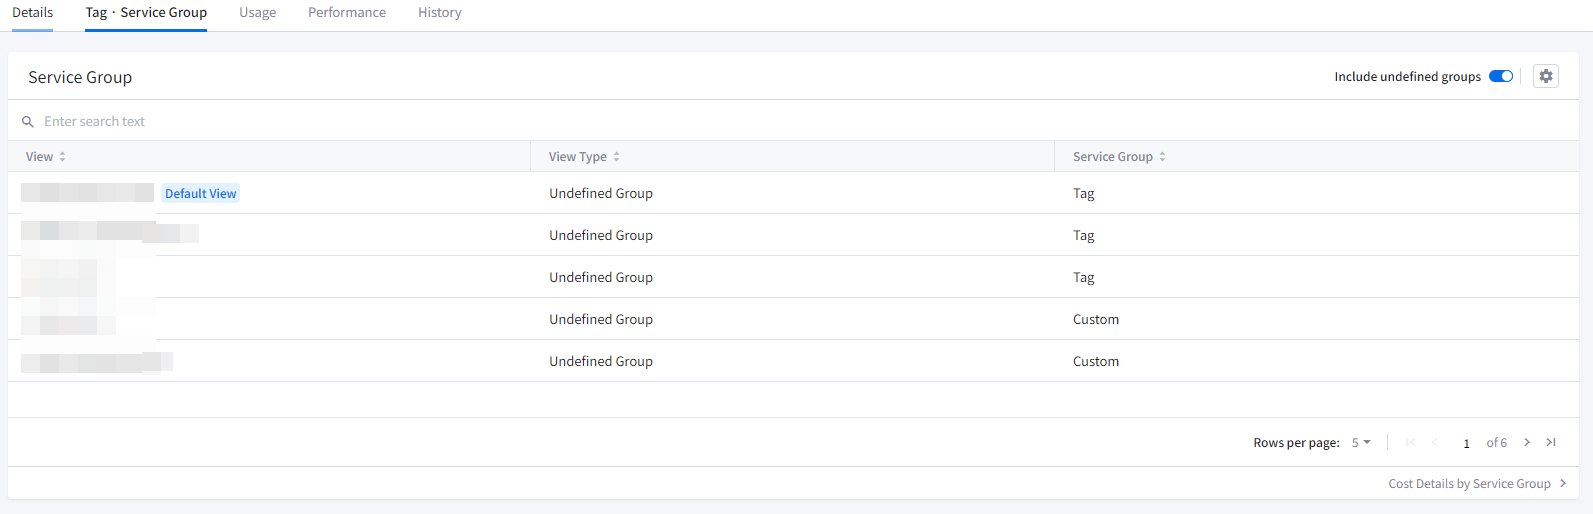
If you have created service groups, you can retrieve the list of service groups for that resource. You can check the view type of the service group, the view it pertains to, the service group’s name, and whether it is set as the default view. The view types are indicated as Custom, Tag, or Account.
By checking the Include undefined groups option, you can also see groups that haven’t been assigned to a service group.
Clicking on the gear icon in the top right corner of the card allows you to swiftly navigate to the service group management menu. You can view the sub-service groups and history of the View that has been set as the default, perform actions like configuring categories, moving groups, deleting and creating service groups. Moreover, you can also download the list of viewed service groups as a CSV file for your reference.
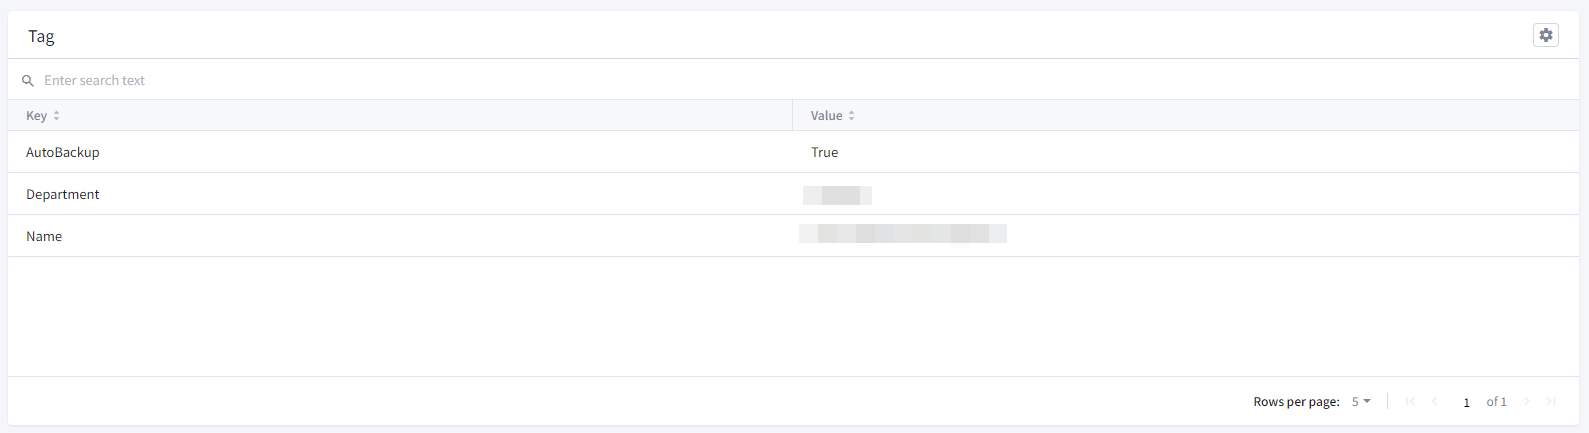
Tag
In the tag card, you can view a list of tags displaying tag keys and tag values. Clicking on the gear icon in the top right corner of the card takes you to the tag assistant, where you can set tags for the resource. Furthermore, you can also download the detailed information of the currently viewed tag list as a CSV file for review.
Usage
Cost Trend
- You can view the cost trend of the specific resource. Choose the desired period for analysis, select daily, weekly, or monthly chart viewing options, and then choose the grouping criteria. The available grouping criteria include Name, Resource ID, Usage Type, Record Type, Operation Name, Product, Sub Product and Region. For example, if you select Name as the grouping criterion and set the chart to display daily trends for this month, you will be able to see a chart similar to the image below.
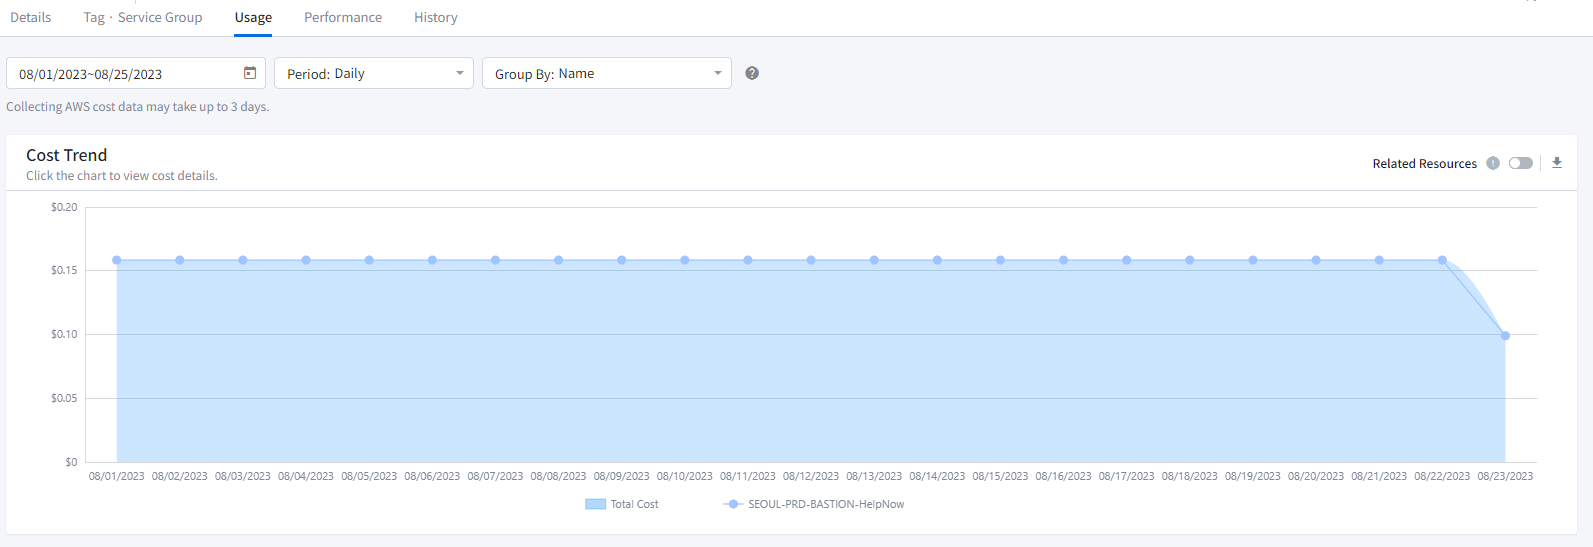
📜 Note: It may take up to three days to collect costs from AWS.
- By selecting Related Resources, you can also view the costs of resources related to the specific resource. For example, you can view the costs of snapshots or EBS volumes associated with an EC2 instance. When you hover over a data point on the cost trend chart, you can instantly see detailed information about that field in a tooltip. Clicking on each point on the chart generates a popup with a detailed description of the cost, allowing you to examine the information closely, and you can download the details of that point as a CSV file. Furthermore, you can also download a detailed CSV file for the entire cost trend chart that you’ve queried.
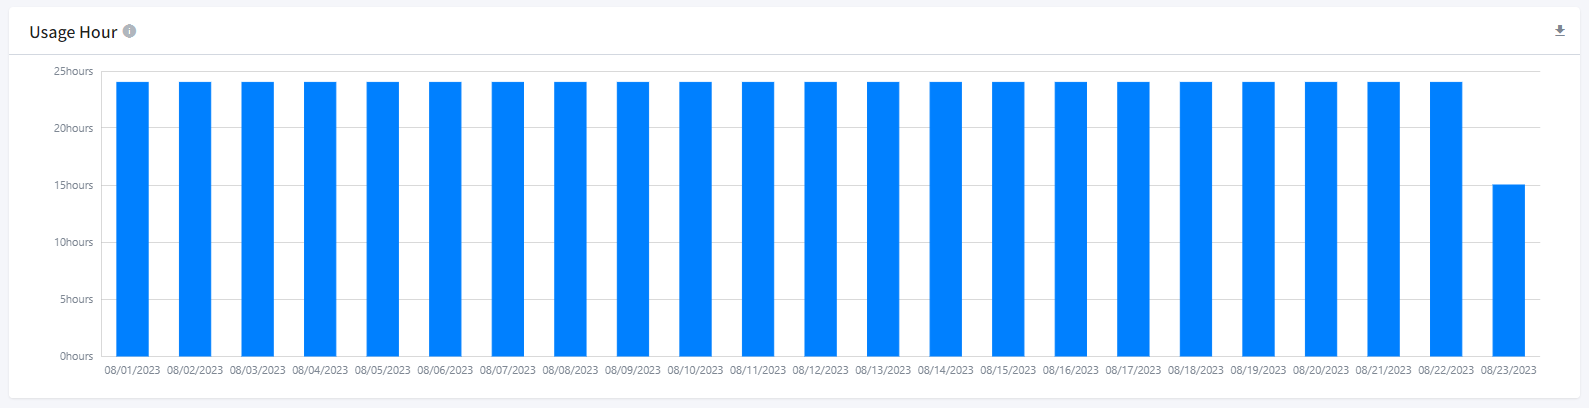
Usage Hour
The Usage Time Chart displays the total time an instance has been running within a day.
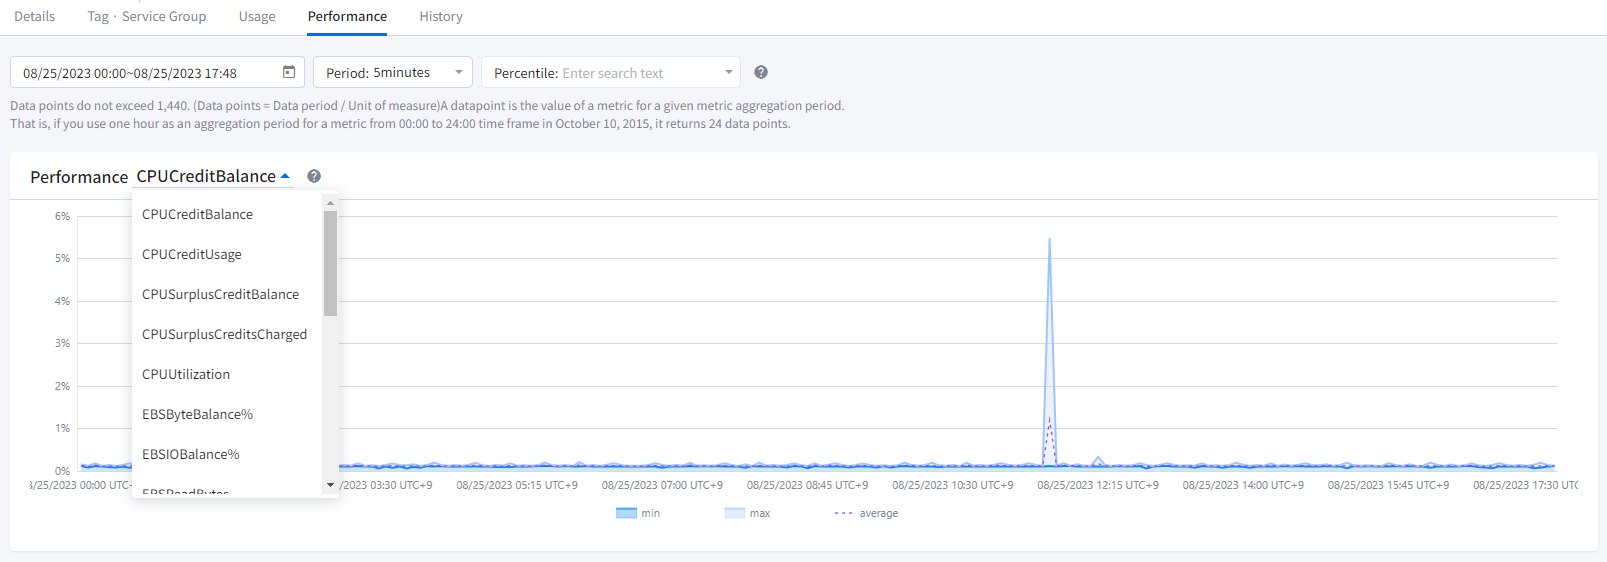
Performance
You can view data points within a specified period for a resource’s performance, differentiated by metrics, in percentiles. Percentiles are statistical measures that show how data points compare to the overall distribution over time. When unusual values outside the range distort the distribution displayed on the chart, making it difficult to understand patterns or average values, you can visualize the data distribution by excluding outliers and showing the 5th to 95th percentiles. You can drag the gray bars above the graph to adjust the period again within the queried results.
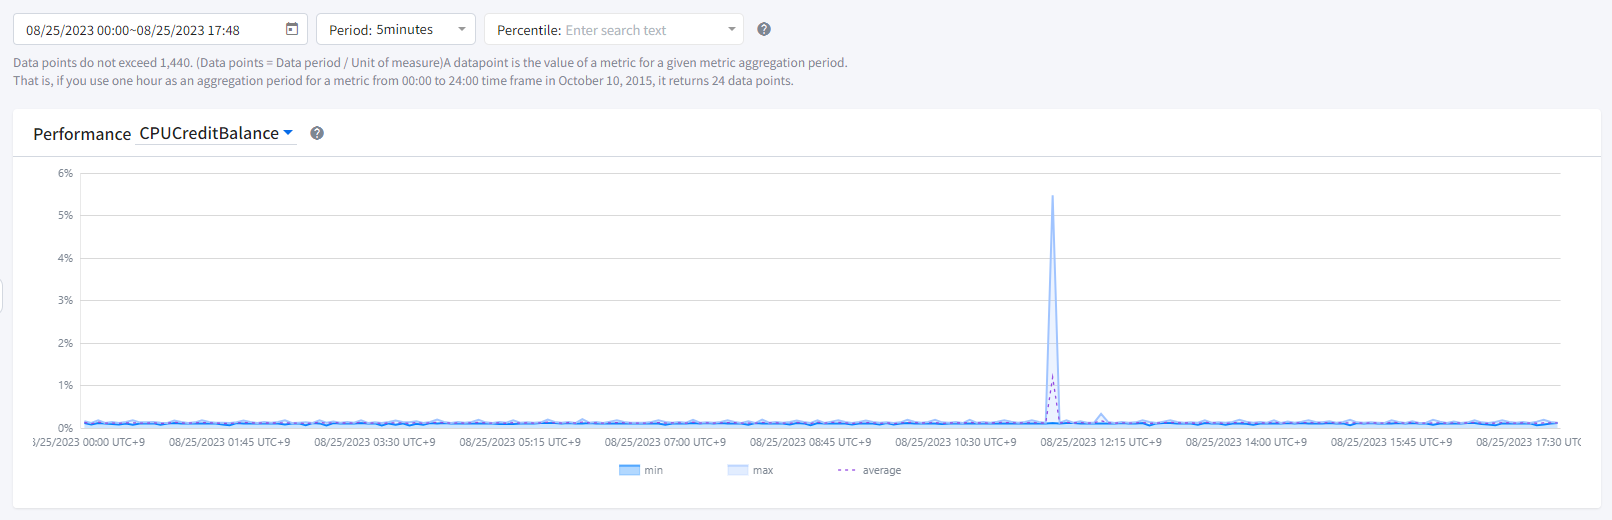
The maximum number of data points returned in a single call is 1,440. If you request more than this, an error will be returned. To reduce the number of data points, you can narrow the specified period range or increase the query time interval. You can query data from a minimum of 1 second up to a maximum of 30 days.
📜 Note: Metrics such as CPUUtilization and NetworkIn, used for performance querying, are directly retrieved from AWS data.
History
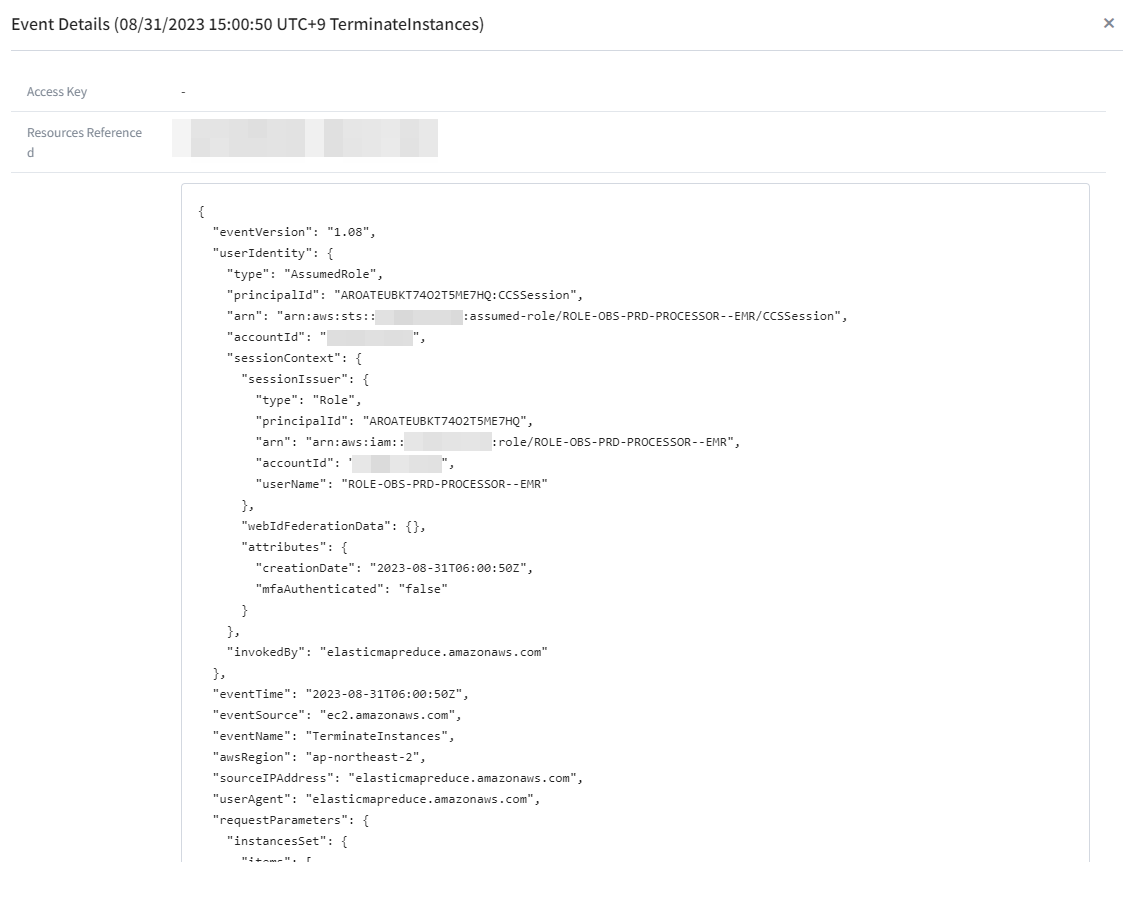
You can review and search the event and activity history of the resource you are querying. Select the desired period and event names for your search. You can retrieve all event names or choose specific ones for viewing. However, filtering and searching are only possible within the currently displayed screen. Also, please note that AWS CloudTrail retains events related to the resource for up to 90 days, so you can only view activity history within the last 90 days. If you click on a specific event in the list, the detailed event information screen will be displayed on the right. On the right-wing screen, you can see the access key, referenced resources, and event records.
If you click the help button represented by the question mark icon, a window will be displayed on the right side of the screen. This window provides descriptions about the LookupEvent feature and the table entries.
| Item | Description |
|---|---|
| Event Time | The local time that the event occurred. |
| Event Name | The name of the event occurred in the resources. This is typically the API name that is associated with the event, such as CreateTrail. |
| User Name | The name of the user who triggered the event or the User ID referenced in the event. For example, this can be an IAM user, an IAM role name, or a service role. |
| Event Source | The AWS API endpoint where the event originated, such as ec2.amazonaws.com |
| Resources Referenced | Resources referenced describes the name or ID of resources that are referenced by the event. For example, the resource name might be auto-scaling-test-group for an Auto Scaling group, or i-123456789012 for an Amazon EC2 instance. Resources referenced can be resources that were read or changed by an event. |
| Event Record | The Event record, sometimes called the event payload, is the full JSON text of an event. The record contains fields that help you determine the requested action as well as when and where the request was made. |
| Access Key | The AWS access key ID that was used to sign the request. If the request was made with temporary security credentials, this is the access key ID of the temporary credentials. |
| Read Only | The read type of the event. Events are categorized as read events or write events. |
Performance
Asset > Performance
You can view the performance of all your resources.
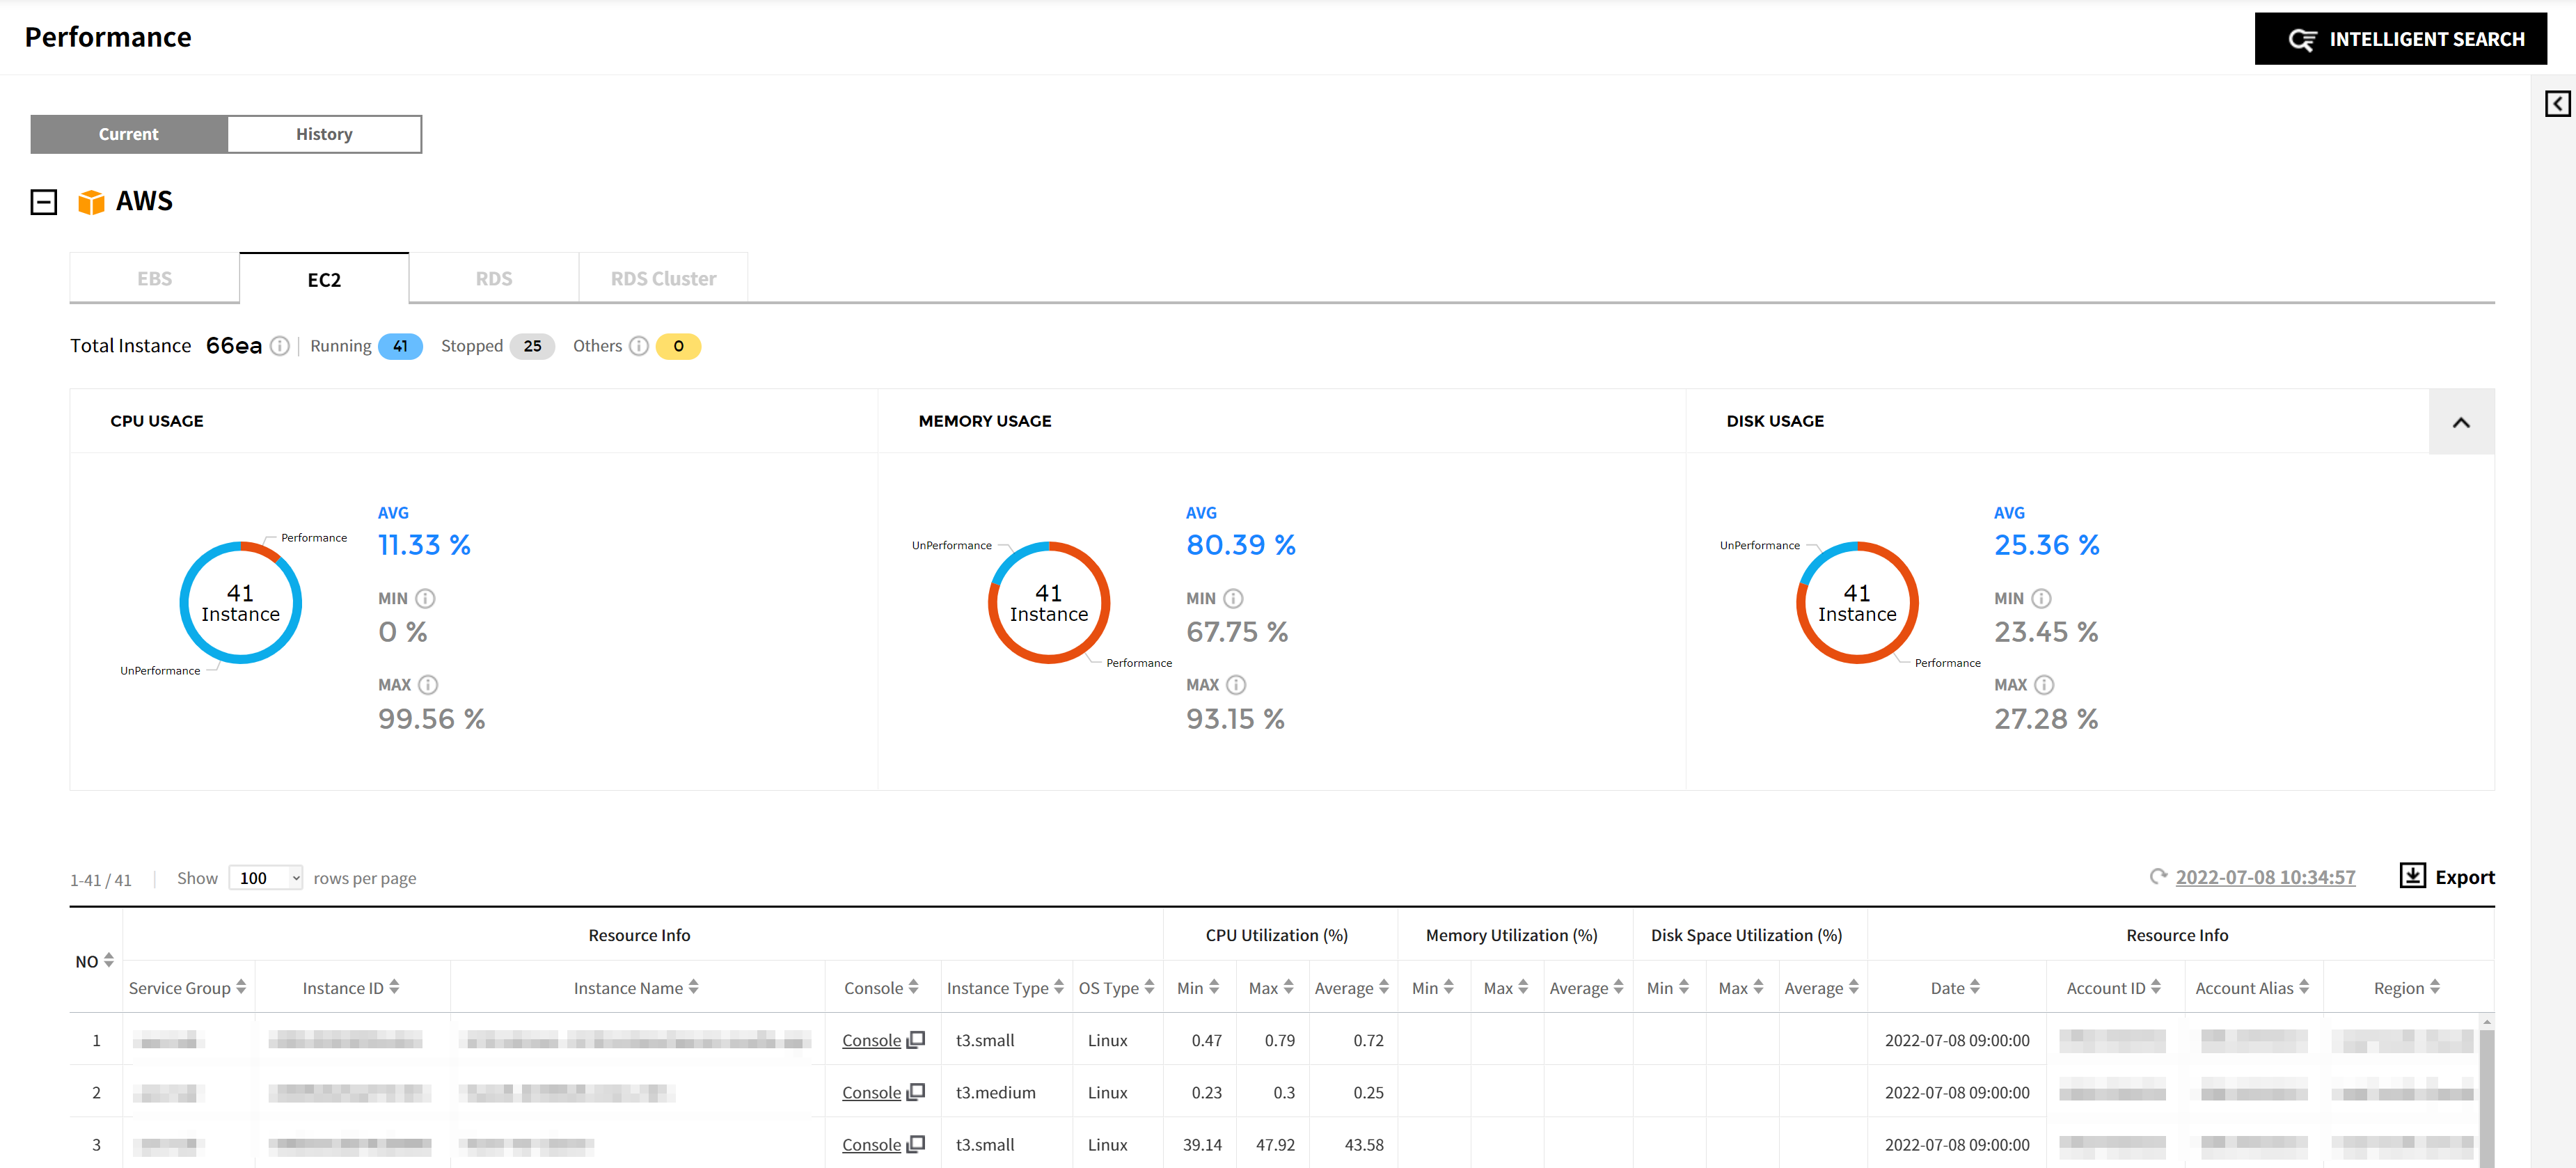
Current
You can view the performance of resources that you are currently using. If you have registered your AWS account in Cloud Account on the Service Portal, you can view CPU Usage by default. In order to view both Memory Usage and Disk Usage, you need to install AWS CloudWatch agent. Refer to the installation guide of each cloud vendor.
AWS
You can check performance status of AWS resources listed below.
| Resource | Item | Note |
|---|---|---|
| EC2 | Resource Info | |
| CPU Utilization (%) | Min, Max, Avg | |
| Memory Utilization (%) | Min, Max, Avg | |
| Disk Space Utilization (%) | Min, Max, Avg | |
| EBS | Resource Info | |
| VolumeQueue Length (EA) | Min, Max, Avg | |
| VolumeRead IOPS (EA) | Min, Max, Avg | |
| VolumeWrite Bytes (MB) | Min, Max, Avg | |
| VolumeWrite IOPS (EA) | Min, Max, Avg | |
| RDS | Resource Info | |
| CPU Utilization (%) | Min, Max, Avg | |
| Freeable Memory (MB) | Min, Max, Avg | |
| Free Storage Space (MB) | Min, Max, Avg | |
| Read IOPS (EA) | Min, Max, Avg | |
| Write IOPS (EA) | Min, Max, Avg |
Prerequisites for Installing the AWS CloudWatch Agent
⑴ Step 1. Create IAM Roles to Use with the CloudWatch Agent on Amazon EC2 Instances
To create the IAM role necessary for each server to run the CloudWatch agent:
① Sign in to the AWS Management Console and open the IAM console.
② In the navigation pane, choose Roles and then click Create role.
③ Under Select type of trusted entity, choose AWS service.
④ Immediately under Common use cases, choose EC2, and then click Next: Permissions.
⑤ In the list of policies, select the check box next to CloudWatchAgentServerPolicy. If necessary, use the search box to find the policy.
⑥ Choose Next: Tags.
⑦ (Optional) Add one or more tag-key value pairs to organize, track, or control access for this role, and then choose Next: Review.
⑧ For Role name, enter a name for your new role, such as CloudWatchAgentServerRole or another name that you prefer.
⑨ (Optional) For Role description, enter a description.
⑩ Confirm that CloudWatchAgentServerPolicy appear next to Policies.
⑪ Choose Create role.
⑵ Step 2. Attach an IAM Role
Attach the IAM role that you created in the Step 1 to the EC2 instances that you intend to install the CloudWatch Agents on.
① Open the EC2 Management Console.
② In the navigation pane, choose Instances and check instances to attach the IAM Role to.
③ Click Actions > Security > Modify IAM Role.
④ Choose the CloudWatchAgentServerRole in the select box and Save it.
Installing AWS CloudWatch Agent - Linux
⑴ Step 1: Install CloudWatch Agent on Server
The CloudWatch agent is available as a package in Amazon Linux 2. If you are using this operating system, you can install the package by entering the following command. You must also make sure that the IAM role attached to the instance has the CloudWatchAgentServerPolicy attached. For more information, see the AWS documentation.
sudo yum install amazon-cloudwatch-agent
On all supported operating systems, you can download and install the CloudWatch agent using the command line.
| Architecture | Platform | Download Link |
|---|---|---|
| x86-64 | Amazon Linux and Amazon Linux 2 | https://amazoncloudwatch-agent.s3.amazonaws.com/amazon_linux/amd64/latest/amazon-cloudwatch-agent.rpm |
| x86-64 | Centos | https://amazoncloudwatch-agent.s3.amazonaws.com/centos/amd64/latest/amazon-cloudwatch-agent.rpm |
| x86-64 | Redhat | https://amazoncloudwatch-agent.s3.amazonaws.com/redhat/amd64/latest/amazon-cloudwatch-agent.rpm |
| x86-64 | SUSE | https://amazoncloudwatch-agent.s3.amazonaws.com/suse/amd64/latest/amazon-cloudwatch-agent.rpm |
| x86-64 | Debian | https://amazoncloudwatch-agent.s3.amazonaws.com/debian/amd64/latest/amazon-cloudwatch-agent.deb |
| x86-64 | Ubuntu | https://amazoncloudwatch-agent.s3.amazonaws.com/ubuntu/amd64/latest/amazon-cloudwatch-agent.deb |
| x86-64 | Oracle | https://amazoncloudwatch-agent.s3.amazonaws.com/oracle_linux/amd64/latest/amazon-cloudwatch-agent.rpm |
| x86-64 | macOS | https://amazoncloudwatch-agent.s3.amazonaws.com/darwin/amd64/latest/amazon-cloudwatch-agent.pkg |
| ARM64 | Amazon Linux 2 | https://amazoncloudwatch-agent.s3.amazonaws.com/amazon_linux/arm64/latest/amazon-cloudwatch-agent.rpm |
| ARM64 | Redhat | https://amazoncloudwatch-agent.s3.amazonaws.com/redhat/arm64/latest/amazon-cloudwatch-agent.rpm |
| ARM64 | Ubuntu | https://amazoncloudwatch-agent.s3.amazonaws.com/ubuntu/arm64/latest/amazon-cloudwatch-agent.deb |
| ARM64 | SUSE | https://amazoncloudwatch-agent.s3.amazonaws.com/suse/arm64/latest/amazon-cloudwatch-agent.rpm |
| ARM64 | MacOS | https://amazoncloudwatch-agent.s3.amazonaws.com/darwin/arm64/latest/amazon-cloudwatch-agent.pkg |
① From the previous table, use the appropriate download link for download-link and run the command.
wget download-link
② Install the package by entering the following command.
- If you downloaded an RPM package, run the following command.
sudo rpm -U ./amazon-cloudwatch-agent.rpm
- If you downloaded a DEB package, run the following command.
sudo dpkg -i -E ./amazon-cloudwatch-agent.deb
⑵ Step 2: Configure the CloudWatch Agent
In AWS Systems Manager > Parameter Store, save the following JSON value as plain text to the key /AmazonCloudWatch-OpsNow/EC2/Linux.
{"agent":{"run_as_user":"cwagent"},"metrics":{"namespace": "OpsNow/EC2","metrics_collected":{"disk":{"measurement":[{"name":"used_percent","rename":"DiskSpaceUtilization"}],"resources":["/"]},"mem":{"measurement":[{"name": "mem_used_percent", "rename": "MemoryUtilization"}]}},"append_dimensions":{"AutoScalingGroupName":"${aws:AutoScalingGroupName}","ImageId":"${aws:ImageId}","InstanceId":"${aws:InstanceId}","InstanceType":"${aws:InstanceType}"}}}
⑶ Step 3: Start the CloudWatch Agent
① Execute the following command to start the CloudWatch agent.
sudo /opt/aws/amazon-cloudwatch-agent/bin/amazon-cloudwatch-agent-ctl -a fetch-config -m ec2 -s -c ssm:/AmazonCloudWatch-OpsNow/EC2/Linux
If you want to keep the existing config.json in your running CloudWatch Agent environment and add a new OpsNow config, you should change the “fetch-config” to “append-config” in the command above and then execute it as follows.
sudo /opt/aws/amazon-cloudwatch-agent/bin/amazon-cloudwatch-agent-ctl -a append-config -m ec2 -s -c ssm:/AmazonCloudWatch-OpsNow/EC2/Linux
② Execute the following command to check if the service is running.
$systemctl status amazon-cloudwatch-agent
③ You can check the service status as follows.
                    ● amazon-cloudwatch-agent.service - Amazon CloudWatch Agent
                         Loaded: loaded (/etc/systemd/system/amazon-cloudwatch-agent.service; enabled; vendor preset: enabled)
                         Active: active (running) since Tue 2022-01-11 05:54:56 UTC; 10min ago
                       Main PID: 263313 (amazon-cloudwat)
                          Tasks: 8 (limit: 1124)
                         Memory: 13.9M
                         CGroup: /system.slice/amazon-cloudwatch-agent.service
                                 └─263313 /opt/aws/amazon-cloudwatch-agent/bin/amazon-cloudwatch-agent -config /opt/aws/amazon-cloudwatch-agent/etc/amazon-cloudwatch-agent.toml -envconfig /opt/aws/amazon-clo>

                    Jan 11 05:54:56 ip-**-***-***-*** systemd[1]: Started Amazon CloudWatch Agent.
                    Jan 11 05:54:56 ip-**-***-***-*** start-amazon-cloudwatch-agent[263313]: /opt/aws/amazon-cloudwatch-agent/etc/amazon-cloudwatch-agent.json does not exist or cannot read. Skipping it.
                    Jan 11 05:54:56 ip-**-***-***-*** start-amazon-cloudwatch-agent[263313]: Valid Json input schema.
                    Jan 11 05:54:56 ip-**-***-***-*** start-amazon-cloudwatch-agent[263313]: I! Detecting run_as_user...
⑷ Step 4: Check Collected Metrics in the CloudWatch Console
💡 Notification: Check metrics in the CloudWatch Console.
Installing AWS CloudWatch Agent - Windows
⑴ Step 1: Install CloudWatch Agent on Server
① Open a powershell window as administrator and execute the following command to download installation file.
Invoke-WebRequest https://s3.amazonaws.com/amazoncloudwatch-agent/windows/amd64/latest/amazon-cloudwatch-agent.msi -OutFile C:\Users\Administrator\amazon-cloudwatch-agent.msi
② If you downloaded an MSI package on a server running Windows Server, change to the directory containing the package and enter the following:
msiexec /i amazon-cloudwatch-agent.msi
⑵ Step2: Configure the CloudWatch Agent
In AWS Systems Manager > Parameter Store, save the following JSON value as plain text to the key /AmazonCloudWatch-OpsNow/EC2/Linux.
{"metrics":{"namespace":"OpsNow/EC2","metrics_collected":{"LogicalDisk":{"measurement":[{"name":"% Free Space","rename":"DiskFreeSpaceUtilization"}],"resources":["*"]},"Memory":{"measurement":[{"name":"% Committed Bytes In Use","rename":"MemoryUtilization"}]}},"append_dimensions":{"AutoScalingGroupName":"${aws:AutoScalingGroupName}","ImageId":"${aws:ImageId}","InstanceId":"${aws:InstanceId}","InstanceType":"${aws:InstanceType}"}}}
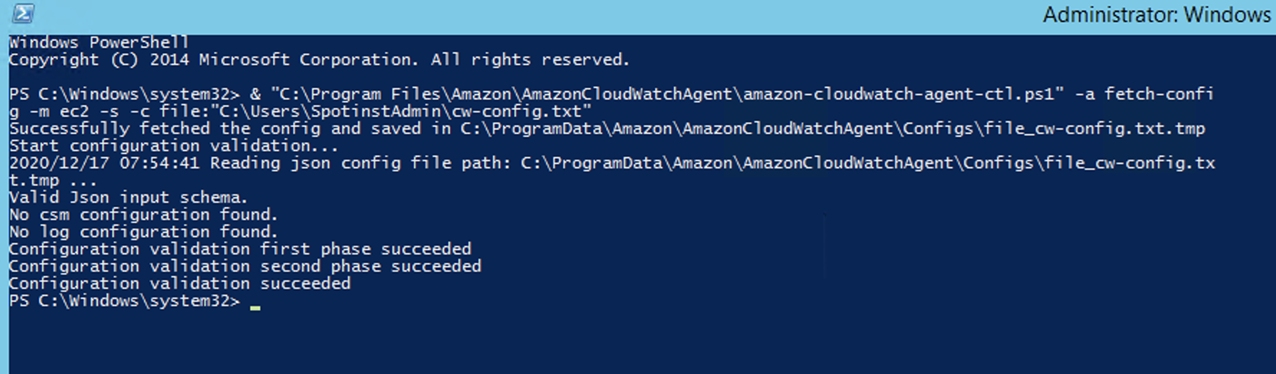
⑶ Step 3: Start the CloudWatch Agent
Execute the following command to start the CloudWatch agent.
& "C:\Program Files\Amazon\AmazonCloudWatchAgent\amazon-cloudwatch-agent-ctl.ps1" -a fetch-config -m ec2 -s -c ssm:/AmazonCloudWatch-OpsNow/EC2/Windows
If you want to keep the existing config.json in your running CloudWatch Agent environment and add a new OpsNow config, you should change the “fetch-config” to “append-config” in the command above and then execute it as follows.
& "C:\Program Files\Amazon\AmazonCloudWatchAgent\amazon-cloudwatch-agent-ctl.ps1" -a append-config -m ec2 -s -c ssm:/AmazonCloudWatch-OpsNow/EC2/Windows
⑷ Step 4: Check Collected Metrics in the CloudWatch Console
💡 Notification: Check it on the CloudWatch Console.
Azure
You can check the performance of Azure resources listed below. If you have registered your Azure account in Cloud Account on the Service Portal, you can view CPU Usage by default. In order to view both Memory Usage and Disk Usage, you need to install Azure Monitor agent.
| Resource | Item | Note |
|---|---|---|
| Virtual Machine | Resource Info | |
| CPU Utilization (%) | Min, Max, Avg | |
| Memory Utilization (%) | Min, Max, Avg | |
| Disk Space Utilization (%) | Min, Max, Avg | |
| SQL Database | Resource Info | |
| CPU Utilization (%) | Min, Max, Avg | |
| Physical Data Read Percent (%) | Min, Max, Avg | |
| Connection Success (EA) | Min, Max, Avg | |
| Connection Fail (EA) | Min, Max, Avg | |
| DTU Consumption (%) | Min, Max, Avg | |
| DeadLock (EA) | Min, Max, Avg |
Prerequisites for Installing the Azure Monitor Agent
⑴ Step 1: Enable Guest Level Monitoring
① Login to your Azure Portal.
② Click on a VM.
③ Select Diagnostics settings from the Azure UI blade.
④ Under the Overview tab:
⑤ Pick a Storage account: Select your storage account so that the metrics stats can be stored.
⑥ Click on Enable guest level monitoring and wait for the process to complete.
⑦ Under the Overview tab:
⑧ Pick a Storage account: Select your storage account so that the metrics stats can be stored.
⑨ Click on Enable guest level monitoring and wait for the process to complete.
⑩ Check the Confirmation Message.
⑪ Click on the Performance Counters tab of the VM and ensure Memory is checked.
⑵ Step 2: Check Metrics
① Navigate to Metrics under Monitoring.
② Choose Guest (Classic) for Metric Namespace.
③ Choose (_Total)% Free Space for Metric.
④ Choose Aggregation Type depending on your needs.
⑤ Navigate to Metrics under Monitoring.
⑥ Choose Guest (Classic) for Metric Namespace.
⑦ Choose % Committed Bytes In Use for Metric.
⑧ Choose Aggregation Type depending on your needs.
GCP
You can check performance status of GCP resources listed below.
| Resource | Item | Note |
|---|---|---|
| VM Instance | Resource Info | |
| CPU Utilization (%) | Min, Max, Avg | |
| Memory Utilization (%) | Min, Max, Avg | |
| Disk Space Utilization (%) | Min, Max, Avg | |
| Compute Disk | Resource Info | |
| Read IOPS | Min, Max, Avg | |
| Write IOPS | Min, Max, Avg | |
| SQL Instance | Resource Info | |
| CPU Utilization (%) | Min, Max, Avg | |
| Memory Utilization (%) | Min, Max, Avg | |
| Disk Space Utilization (%) | Min, Max, Avg |
Prerequisites for Installing the GCP Ops Agent
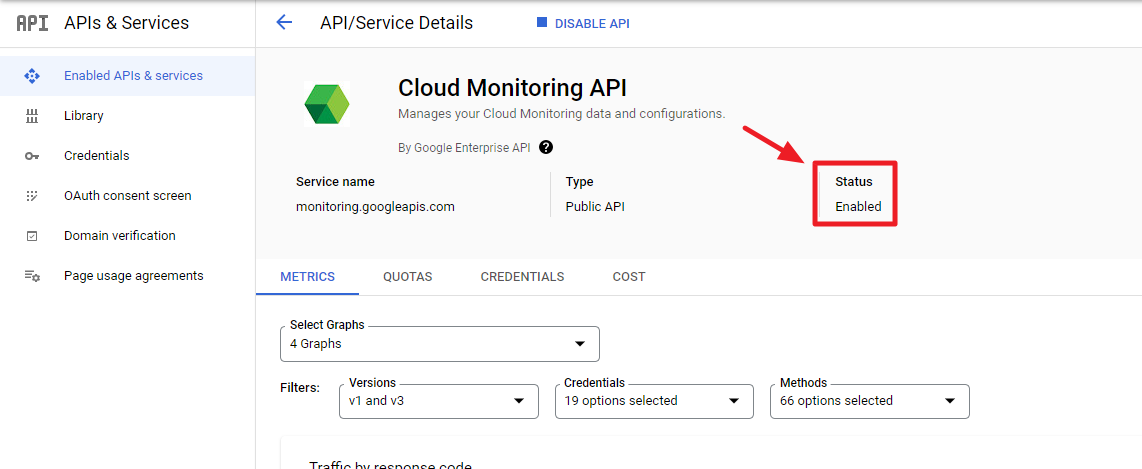
To collect Disk and Memory metrics on VM instances, GCP provides the Ops Agent. Before install the Agent, it is required to configure the settings below for Linux and Windows VM instances.
① Go to GCP console > APIs & Services > Enabled APIs & services, and select [Cloud Monitoring API] and set the status to [Enabled].
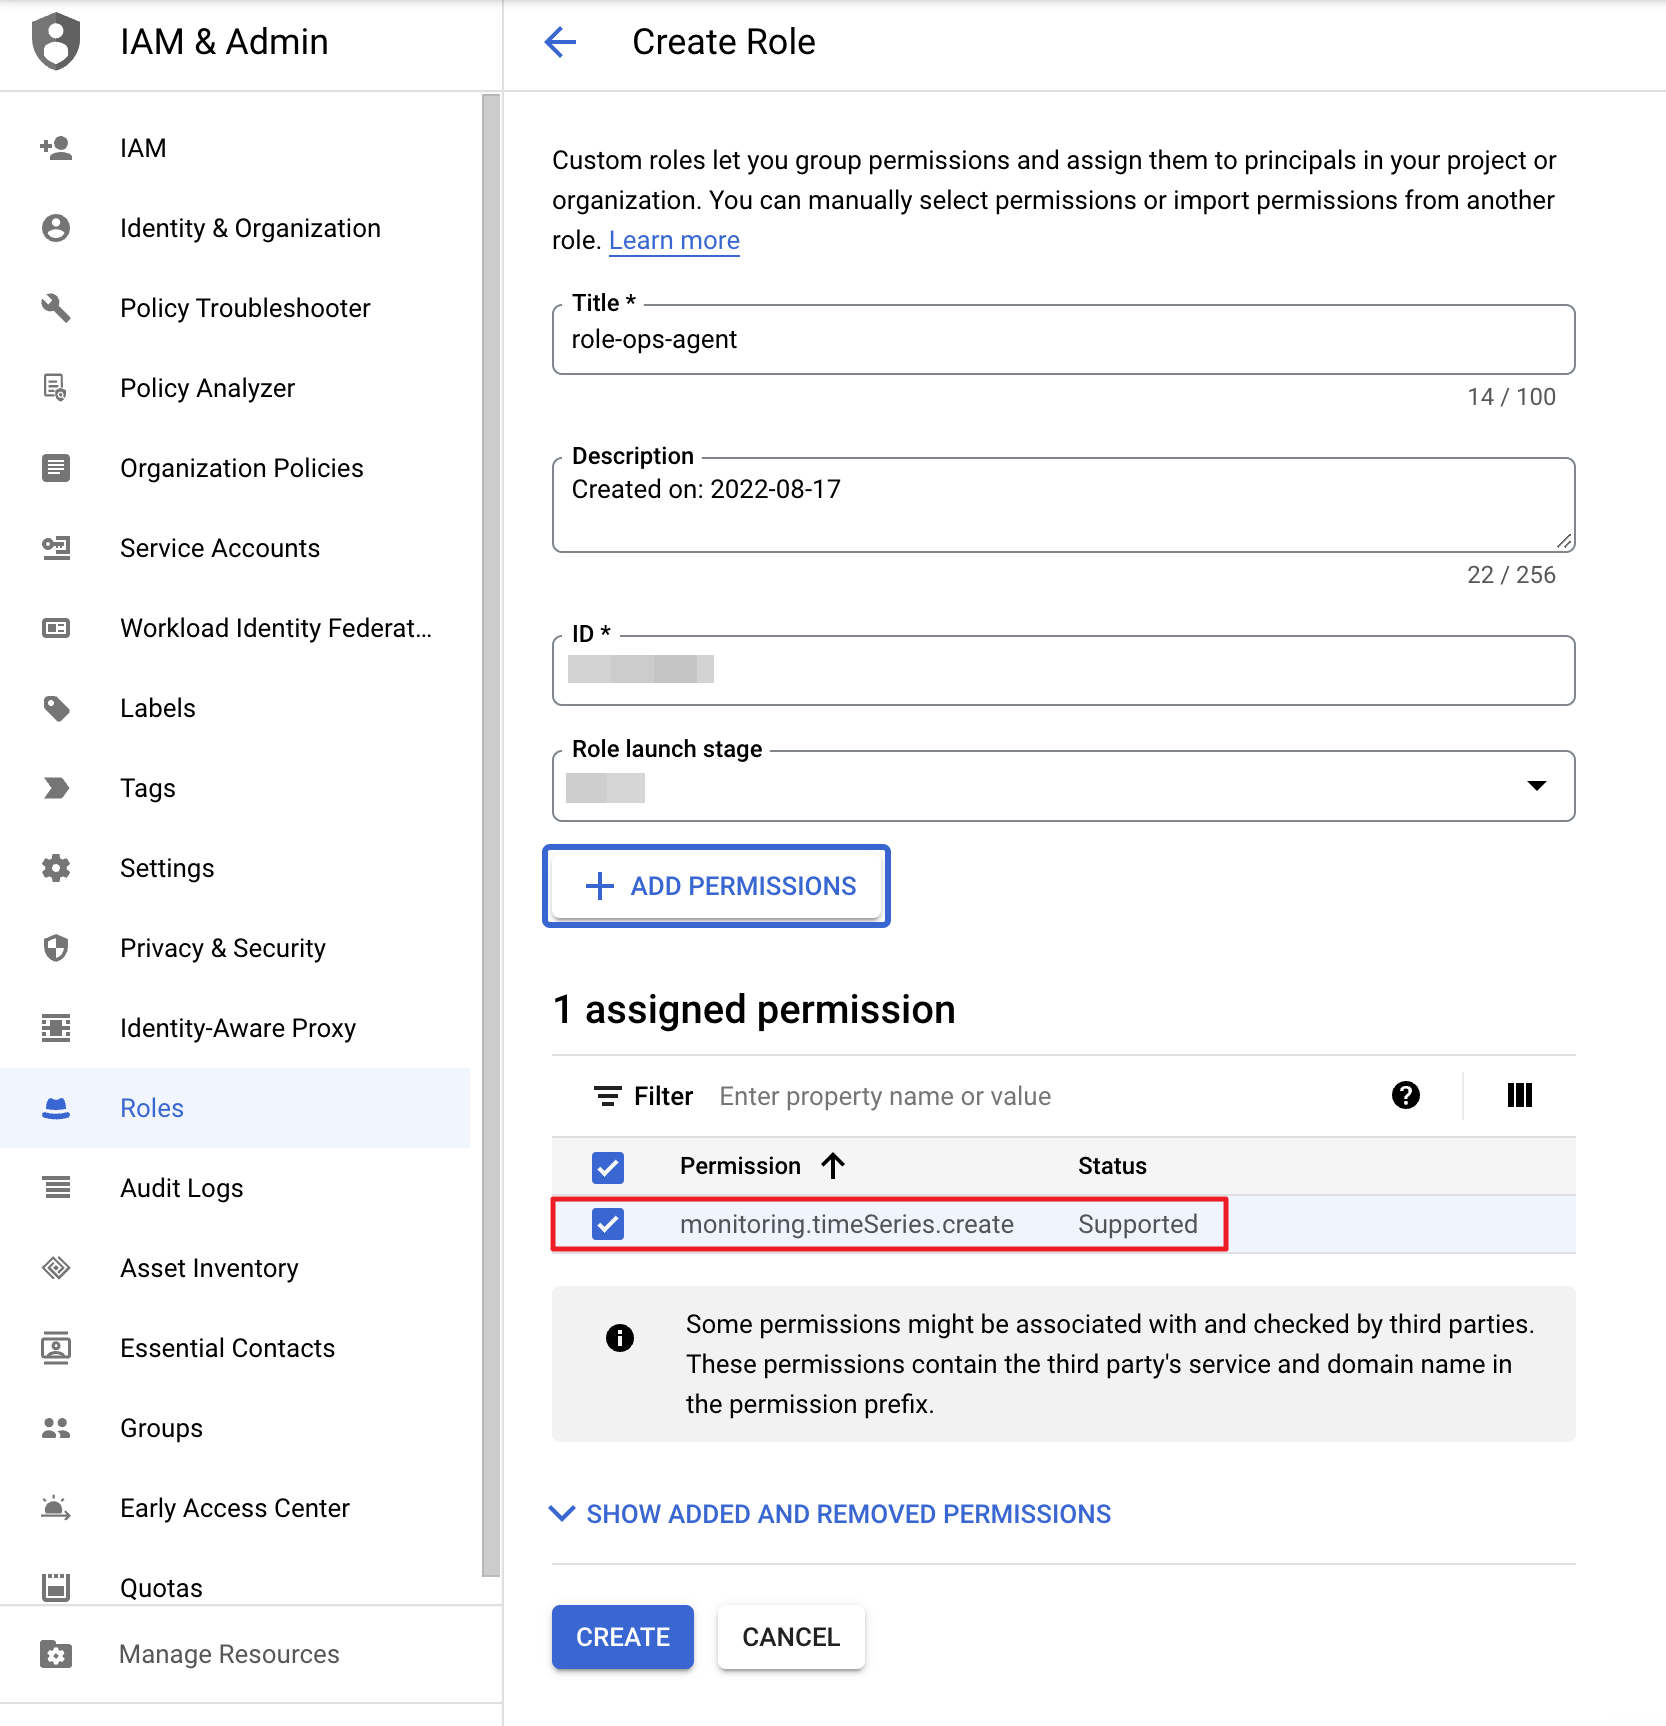
② Go to IAM & Admin > Roles, and choose [CREATE ROLE]. Then, grant [monitoring.timeSeries.create] to your service account.
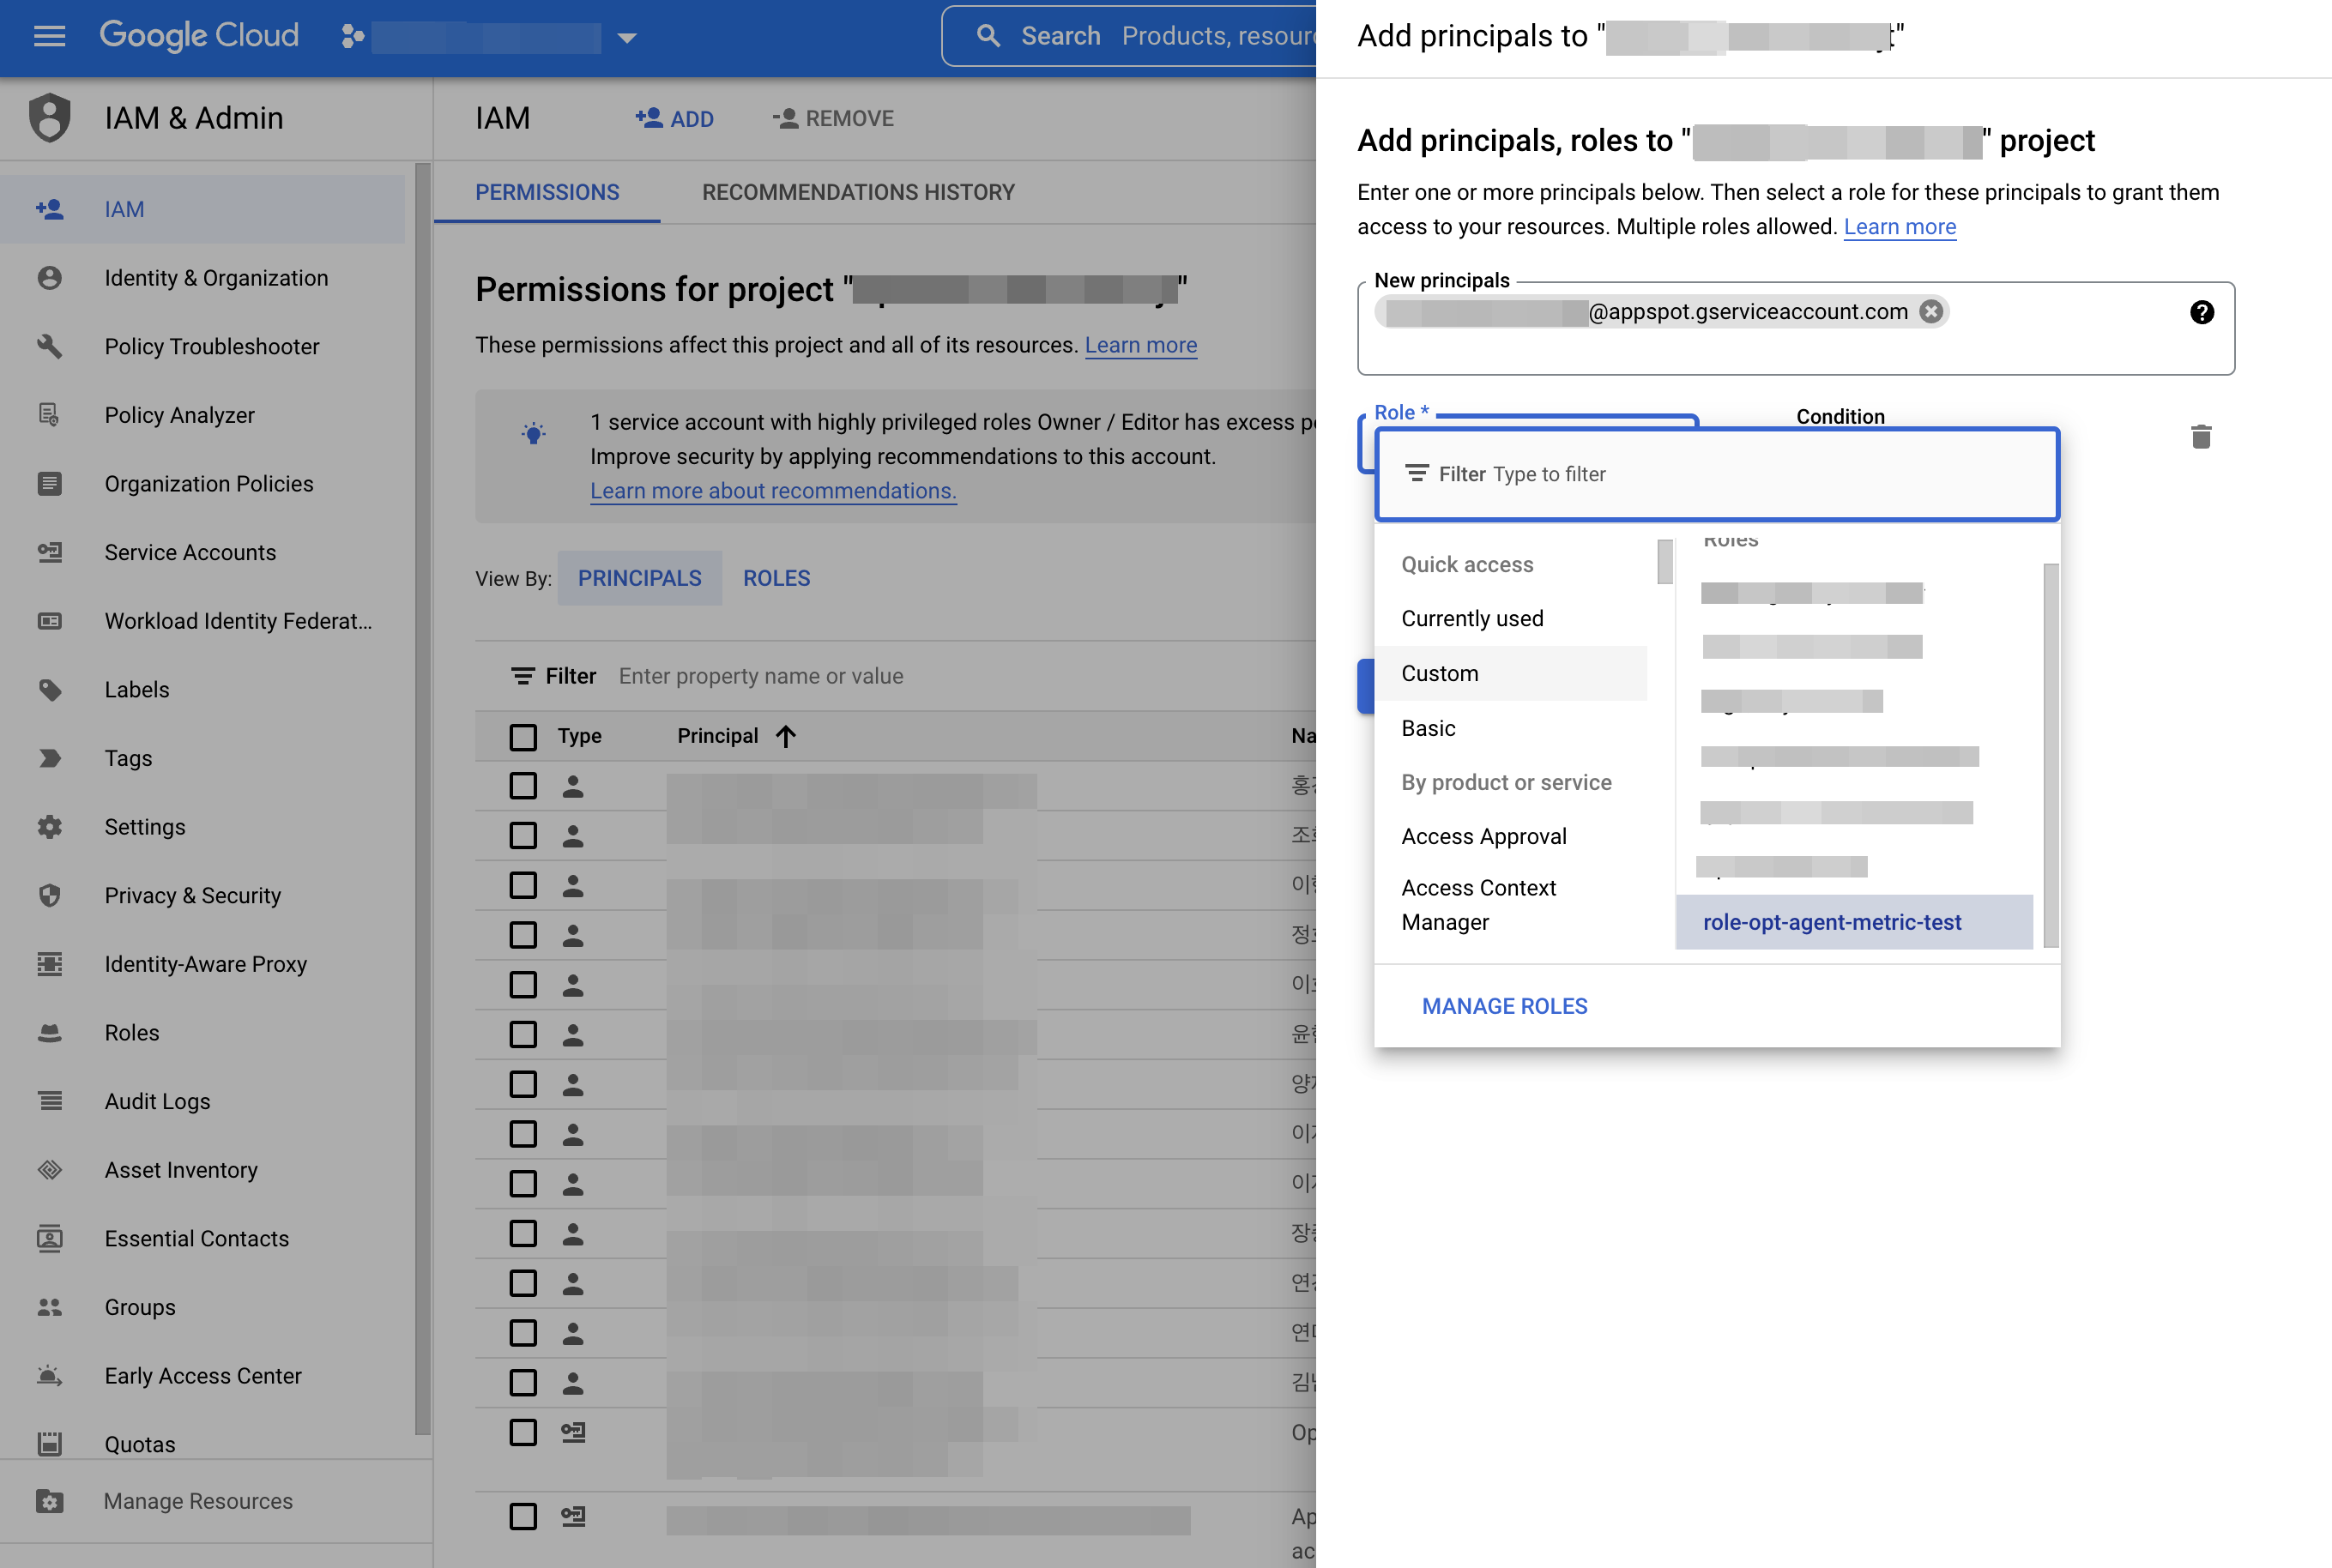
③ Add the role you created to your service account by choosing the [ADD] button in IAM & ADMIN.
Installing the Ops Agent - Linux
① When you create a new instance, choose a Linux operating system like Ubuntu 18.04LTS for boot disk, and grant monitoring.timeSeries.create to your service account. If you already have instances created, skip to the next step.
② To install the agent, connect to your instance using SSH and run the following command.
                    curl -sSO https://dl.google.com/cloudagents/add-google-cloud-ops-agent-repo.sh
                    sudo bash add-google-cloud-ops-agent-repo.sh --also-install
③ Verify whether the agent is working as expected.
• To verify that the agent is properly working, run the following command.
sudo systemctl status google-cloud-ops-agent"*" *
📜 Note: When you run
sudo service google-cloud-ops-agent status *and can see Active displayed, the agent is properly installed.
• To verify the agent version on your system, run the following commands.
                      dpkg-query --show --showformat \
                        '${Package} ${Version} ${Architecture} ${Status}\n' \
                        google-cloud-ops-agent
• To restart the agent due to changes in configuration files, run the following command.
sudo service google-cloud-ops-agent restart
• To verify the collected logs, run the following command.
/var/log-> syslog
📜 Note: If metrics are not collected while Permission Denied is displayed, please check whether permission is properly granted.
Installing the Ops Agent - Windows
① When you create a new instance, choose a Windows operating system like Windows Server 2016 Datacenter for boot disk, and grant monitoring.timeSeries.create to your service account. If you already have instances created, skip to the next step.
② To install the agent, connect to your instance using RDP. Open a PowerShell terminal with administrator privileges and then run the following PowerShell commands.
                    (New-Object Net.WebClient).DownloadFile("https://dl.google.com/cloudagents/add-google-cloud-ops-agent-repo.ps1", "${env:UserProfile}\add-google-cloud-ops-agent-repo.ps1")
                    Invoke-Expression "${env:UserProfile}\add-google-cloud-ops-agent-repo.ps1 -AlsoInstall"
③ Verify whether the agent is working as expected.
• To verify that the agent is properly working, run the following command.
googet installed google-cloud-ops-agent
📜 Note: If the agent is properly installed, the agent collects Memory and Disk Utilization data.
💡 Notification: Please refer to Ops Agent Installation Guide for installing the agent and Troubleshoot the Ops Agent for troubleshooting.
Go to GCP Console
You can go to GCP Console directly from the current view in order to view detailed information of resources you want to see. There are two options to go to the GCP Console as below.
Click Console from the resource list to go to the GCP Console.
![]()
Click a resource from the list to view the detail page, then select Go to GCP Console button.
![]()
When you click Go to GCP Console, the following pop up message will be displayed. Click View product if you want to view the resource information from the GCP console, and click “View monitoring” to check resource performance.
![]()
When the data is not displayed after going to the GCP Console, make sure you have logged in with the correct account at the top right of the screen. You can view the data you want when you log in with the privileged account.
📜 Note: If you log in as an authorized user in Chrome browser, it will be easier for you to view data in GCP Console.
Alibaba Cloud
You can check performance status of Alibaba Cloud resources listed below.
| Resource | Item | Note |
|---|---|---|
| ECS | Resource Info | |
| CPU Utilization (%) | Min, Max, Avg | |
| Memory Utilization (%) | Min, Max, Avg | |
| Disk Space Utilization (%) | Min, Max, Avg | |
| RDS | Resource Info | |
| CPU Utilization (%) | Min, Max, Avg | |
| Memory Utilization (%) | Min, Max, Avg | |
| Disk Space Utilization (%) | Min, Max, Avg | |
| IOPS (%) | Min, Max, Avg |
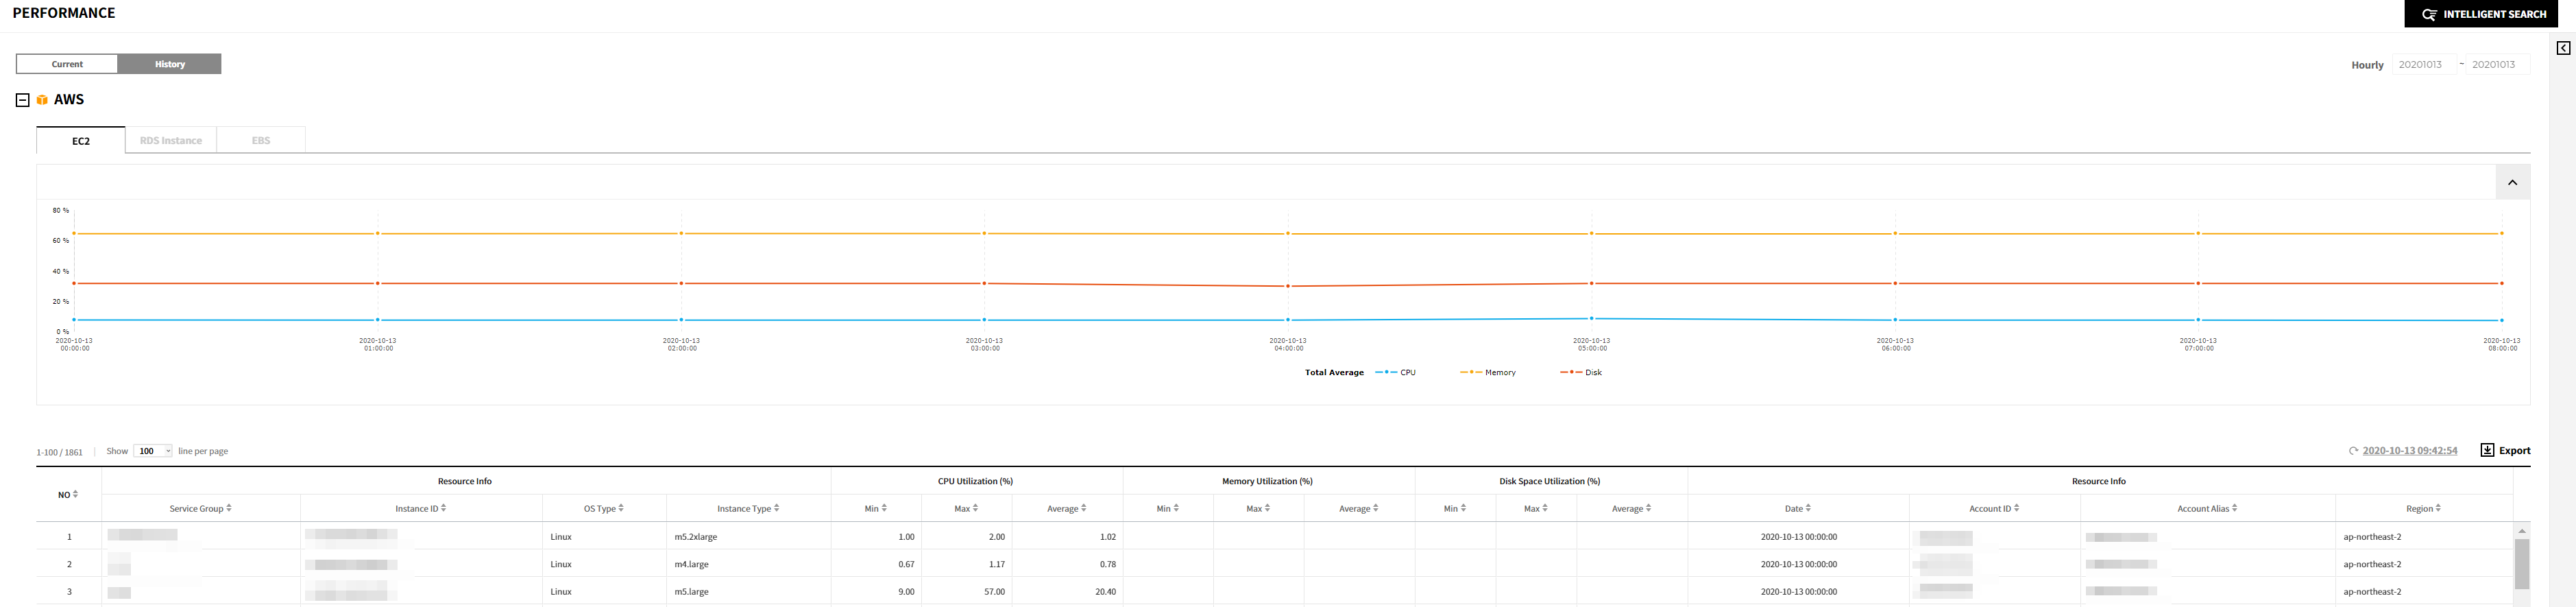
History
You can view the performance history of resources.
AWS
You can check the performance of AWS resources listed below.
| Resource | Item | Note |
|---|---|---|
| EC2 | Resource Info | |
| CPU Utilization (%) | Min, Max, Avg | |
| Memory Utilization (%) | Min, Max, Avg | |
| Disk Space Utilization (%) | Min, Max, Avg | |
| EBS | Resource Info | |
| VolumeQueue Length (EA) | Min, Max, Avg | |
| VolumeRead IOPS (EA) | Min, Max, Avg | |
| VolumeWrite Bytes (MB) | Min, Max, Avg | |
| VolumeWrite IOPS (EA) | Min, Max, Avg | |
| RDS | Resource Info | |
| CPU Utilization (%) | Min, Max, Avg | |
| Freeable Memory (MB) | Min, Max, Avg | |
| Free Storage Space (MB) | Min, Max, Avg | |
| Read IOPS (EA) | Min, Max, Avg | |
| Write IOPS (EA) | Min, Max, Avg |
Azure
You can check the performance history of Azure resources listed below.
| Resource | Item | Note |
|---|---|---|
| Virtual Machine | Resource Info | |
| CPU Utilization (%) | Min, Max, Avg | |
| Memory Utilization (%) | Min, Max, Avg | |
| Disk Space Utilization (%) | Min, Max, Avg | |
| SQL Database | Resource Info | |
| CPU Utilization (%) | Min, Max, Avg | |
| Physical Data Read Percent (%) | Min, Max, Avg | |
| Connection Success (EA) | Min, Max, Avg | |
| Connection Fail (EA) | Min, Max, Avg | |
| DTU Consumption (%) | Min, Max, Avg | |
| DeadLock (EA) | Min, Max, Avg |
GCP
You can check performance history of GCP resources listed below.
| Resource | Item | Note |
|---|---|---|
| VM Instance | Resource Info | |
| CPU Utilization (%) | Min, Max, Avg | |
| Memory Utilization (%) | Min, Max, Avg | |
| Disk Space Utilization (%) | Min, Max, Avg | |
| Compute Disk | Resource Info | |
| Read IOPS | Min, Max, Avg | |
| Write IOPS | Min, Max, Avg | |
| SQL Instance | Resource Info | |
| CPU Utilization (%) | Min, Max, Avg | |
| Memory Utilization (%) | Min, Max, Avg | |
| Disk Space Utilization (%) | Min, Max, Avg |
Alibaba Cloud
You can check performance history of Alibaba Cloud resources listed below.
| Resource | Item | Note |
|---|---|---|
| ECS | Resource Info | |
| CPU Utilization (%) | Min, Max, Avg | |
| Memory Utilization (%) | Min, Max, Avg | |
| Disk Space Utilization (%) | Min, Max, Avg | |
| RDS | Resource Info | |
| CPU Utilization (%) | Min, Max, Avg | |
| Memory Utilization (%) | Min, Max, Avg | |
| Disk Space Utilization (%) | Min, Max, Avg | |
| IOPS (%) | Min, Max, Avg |
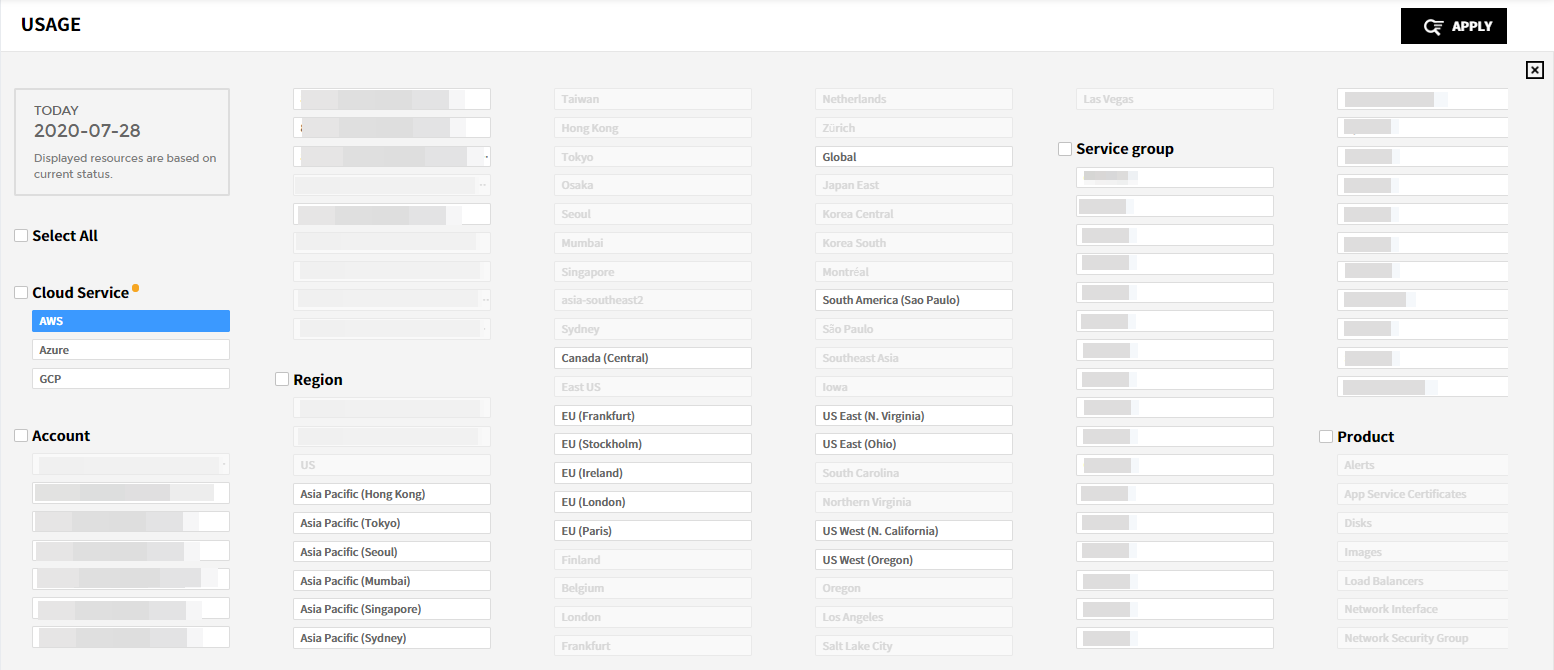
Intelligent Search
Provides Intelligent Search feature based on the relationship between resources that are in use. It shows a list of all resources used for a certain period of time; and you can use them as search conditions. You can use Intelligent Search feature in Usage and Performance menu.
Period: In Current, you can check the resource usage history for the current day. In History, you can select the period to see the resource usage history. The selectable search conditions may change based on the selected period; and the resources used within that period will be automatically included in search conditions. You can set in hourly, daily, weekly, monthly basis.
Search Condition: The Cloud Service, Account, Region, Service Group, Product, and Tag are the items fo search conditions. When you select the conditions, you can only select the related search conditions. For example, if you select AWS for the cloud service, you cannot select other cloud services’ resources. Set the period and search conditions and click [Apply] button. Then, the results for the selected period and search conditions will be displayed.
![]()
Resource Optimization
By using Resource Optimization, you can view the status of entire resources and whether resources are used with maximum efficiency compared to its performance. This feature optimizes the resource environment by removing unnecessary resources. Resource Optimization contains Summary, Unused Resource, Right Sizing, and Settings.
| Summary | Display the summary of Unused Resource and Right Sizing resources. |
| Unused Resource | For resources that are already created but not used or considered as not used, they are recommended as Unused Resource for saving costs. |
| Right Sizing | Through a resource performance analysis, it recommends Downsizing, Upsizing, Modernize, or Idle to the current resources according to the user-defined setting. |
| Settings | Users can add, edit and delete the setting information for Resource Optimization. When accessing the settings for the first time, the default condition is created automatically, and the system recommends Unused Resource and Right Sizing resources daily based on the default settings. |
Summary
The summary shows Estimated Savings, Unused Resource, and Right Sizing resources at a glance. You can check the estimated savings for each cloud service, and also check the unused resources and resources that require right sizing. Users can set the recommendation condition for Unused Resource and Right Sizing on the Settings menu.
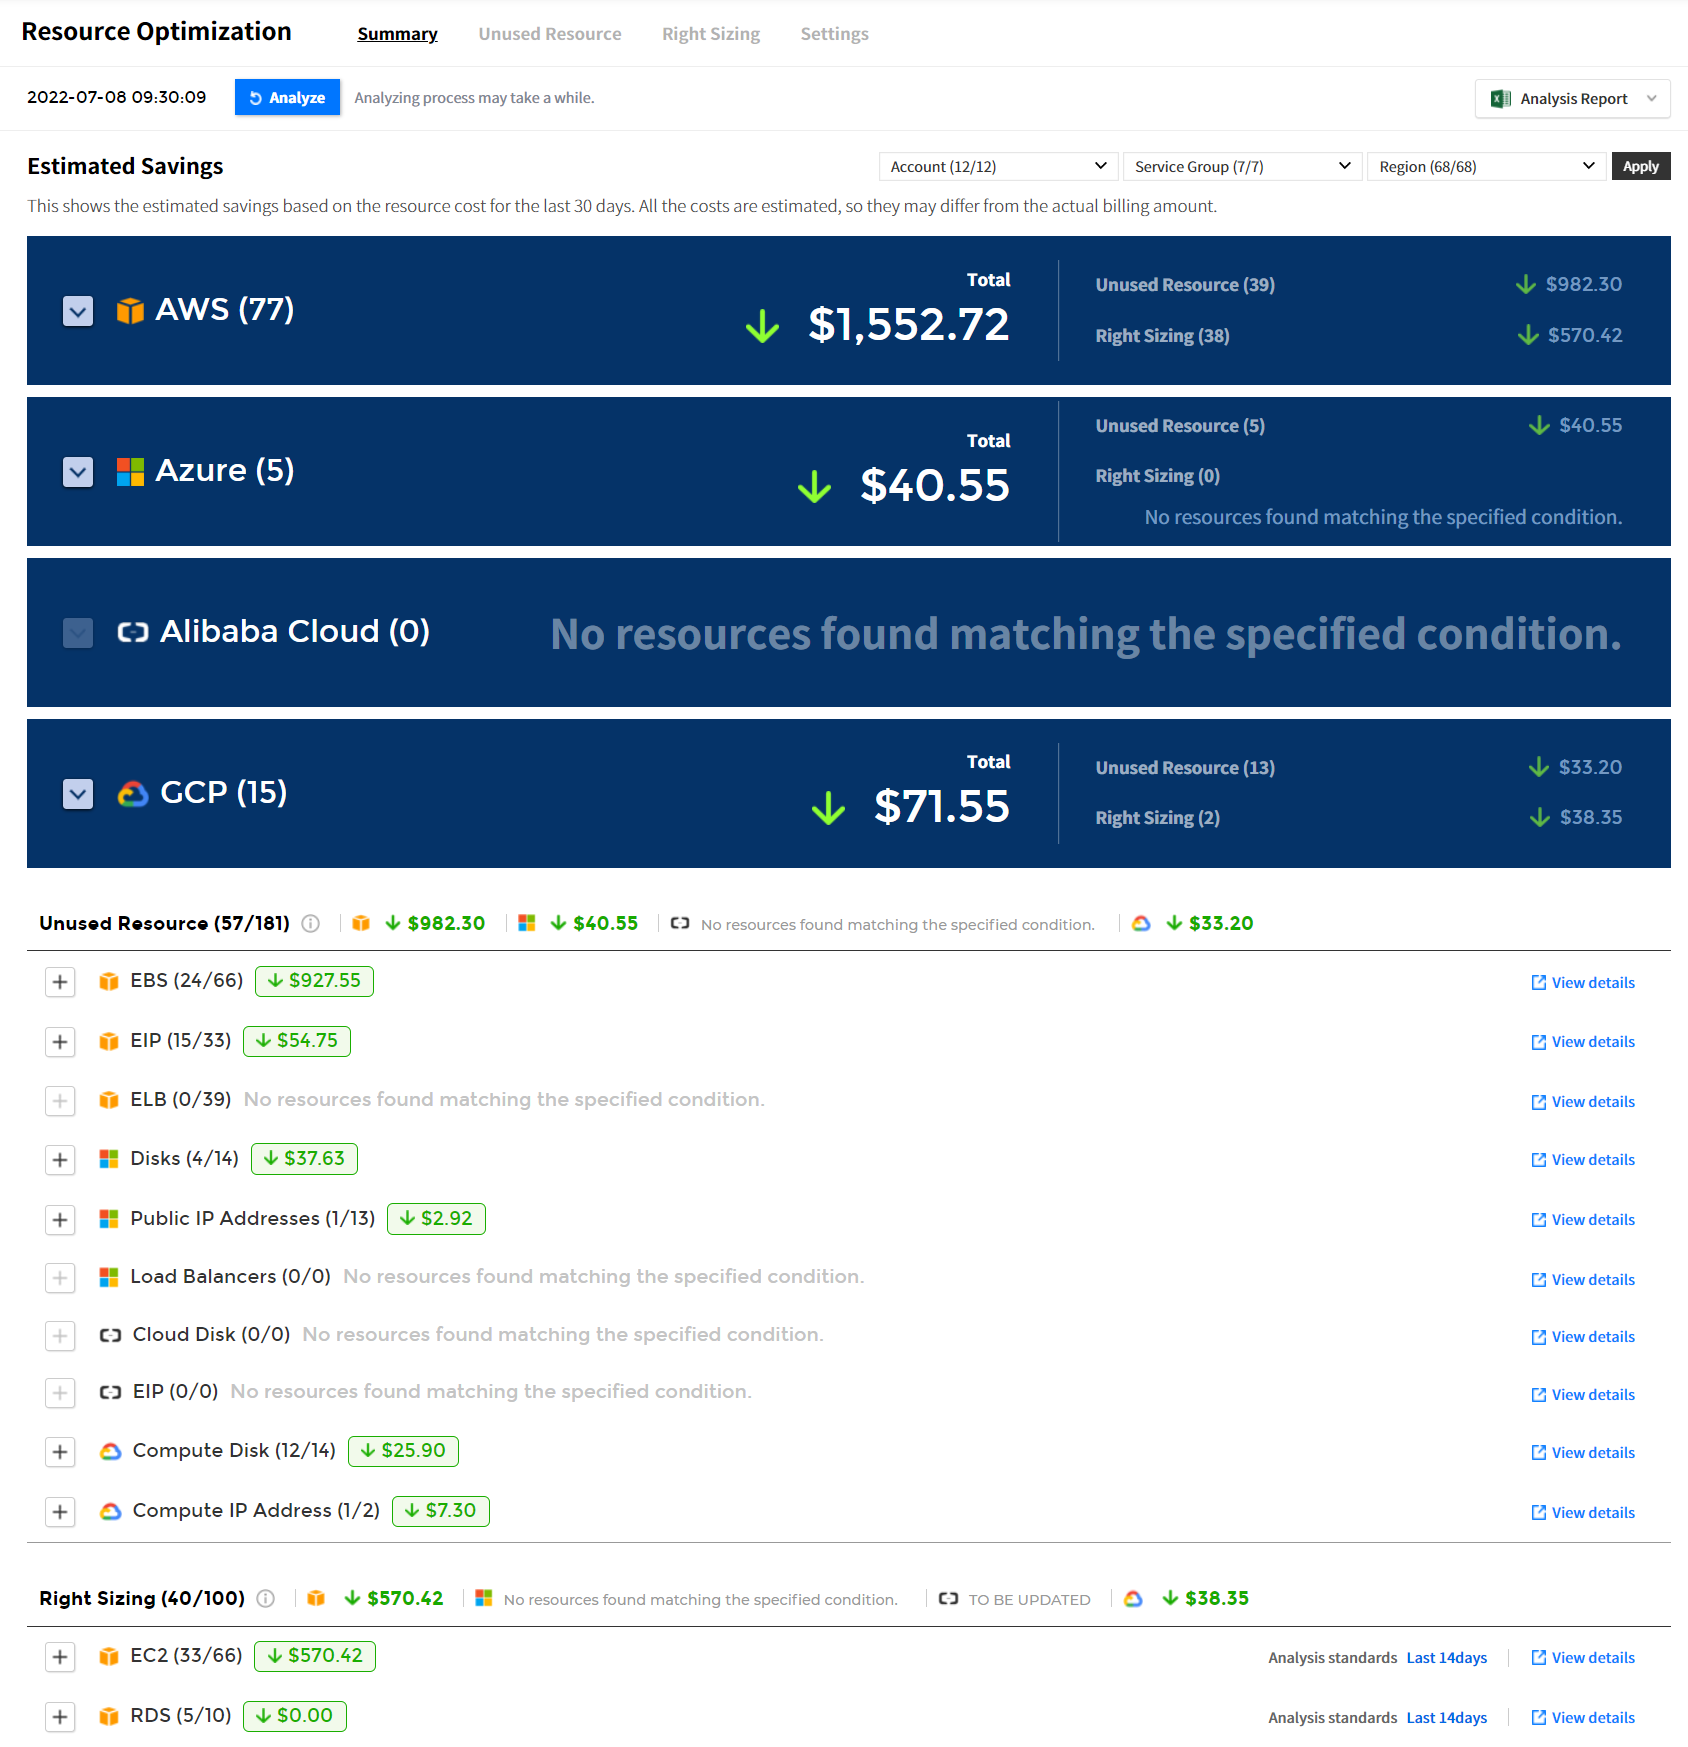
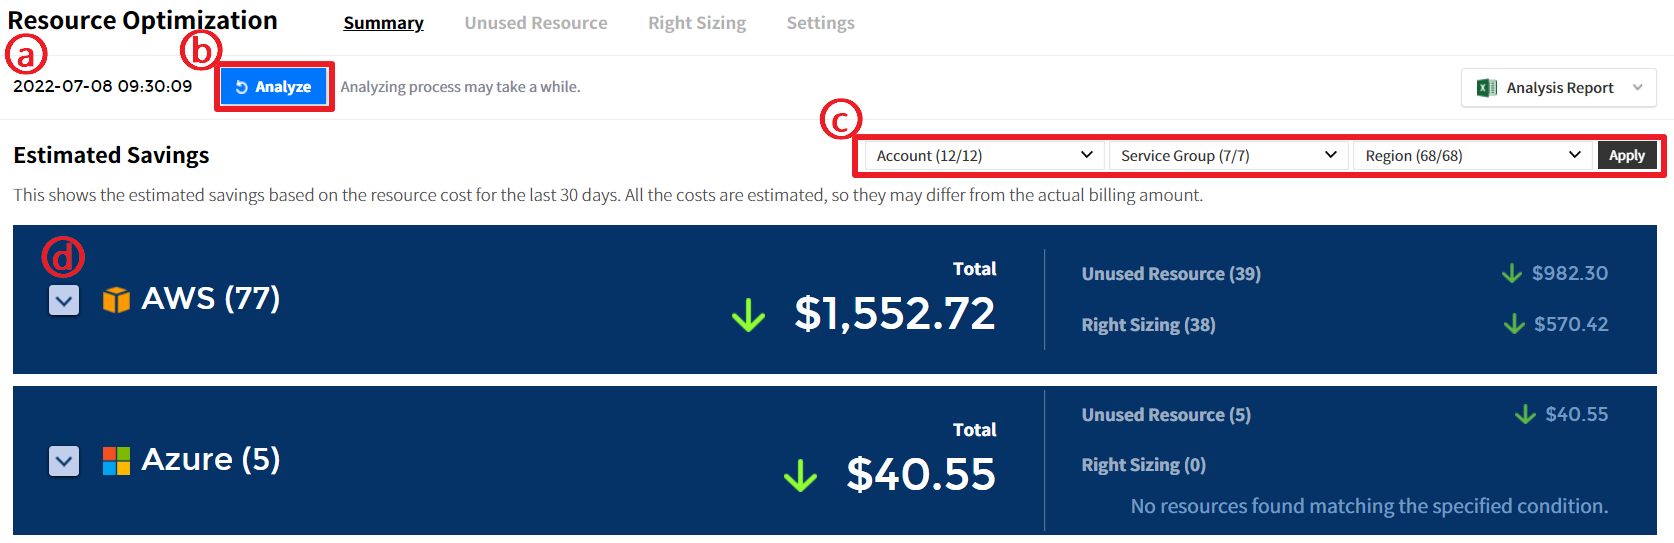
Estimated Savings
You can view the estimated savings of resources that are not being used and resources that need right sizing for the purpose of the use.
- ⓐ The date/time displayed on the left of the [Analyze] button indicates the last time a resource optimization task was performed.
- ⓑ Click the [Analyze] button to update the resource optimization to the latest version.
- ⓒ Select the drop-down list of Account, Service Group, and Region in the upper right corner, and click [Apply] to view the necessary data only.
- ⓓ Select a cloud service to view the estimated savings by Total, Account, and Region.
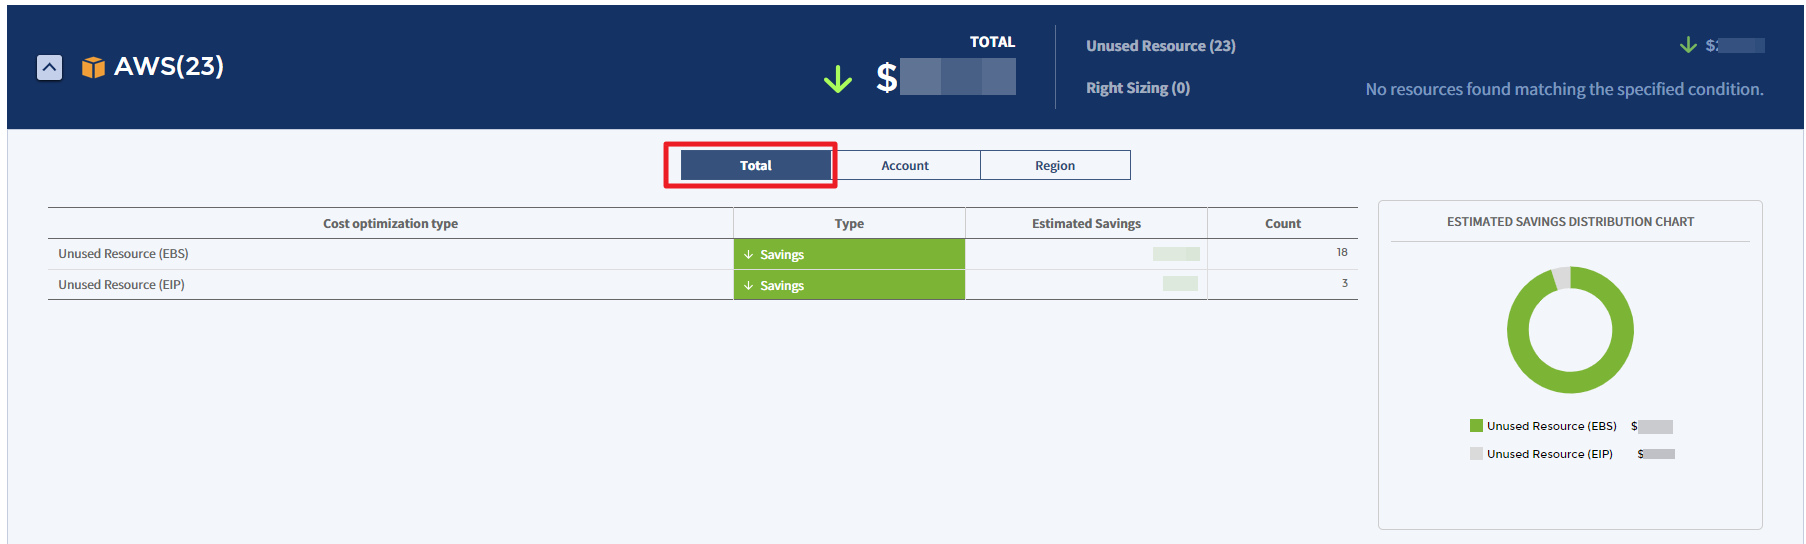
Total
You can check the number of resources available for Unused Resource and Right Sizing and its estimated savings.
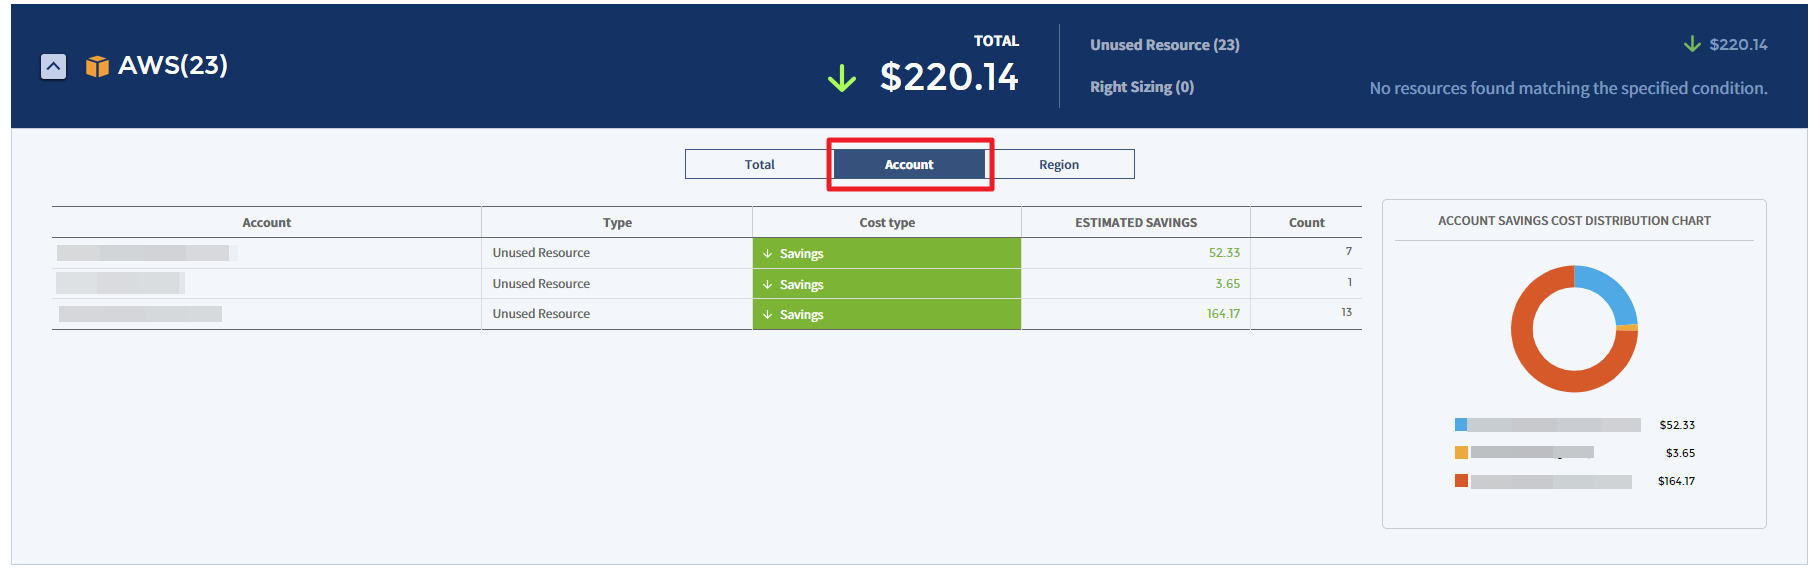
Account
You can view the estimated savings or estimated increase by account in the table chart and graph.
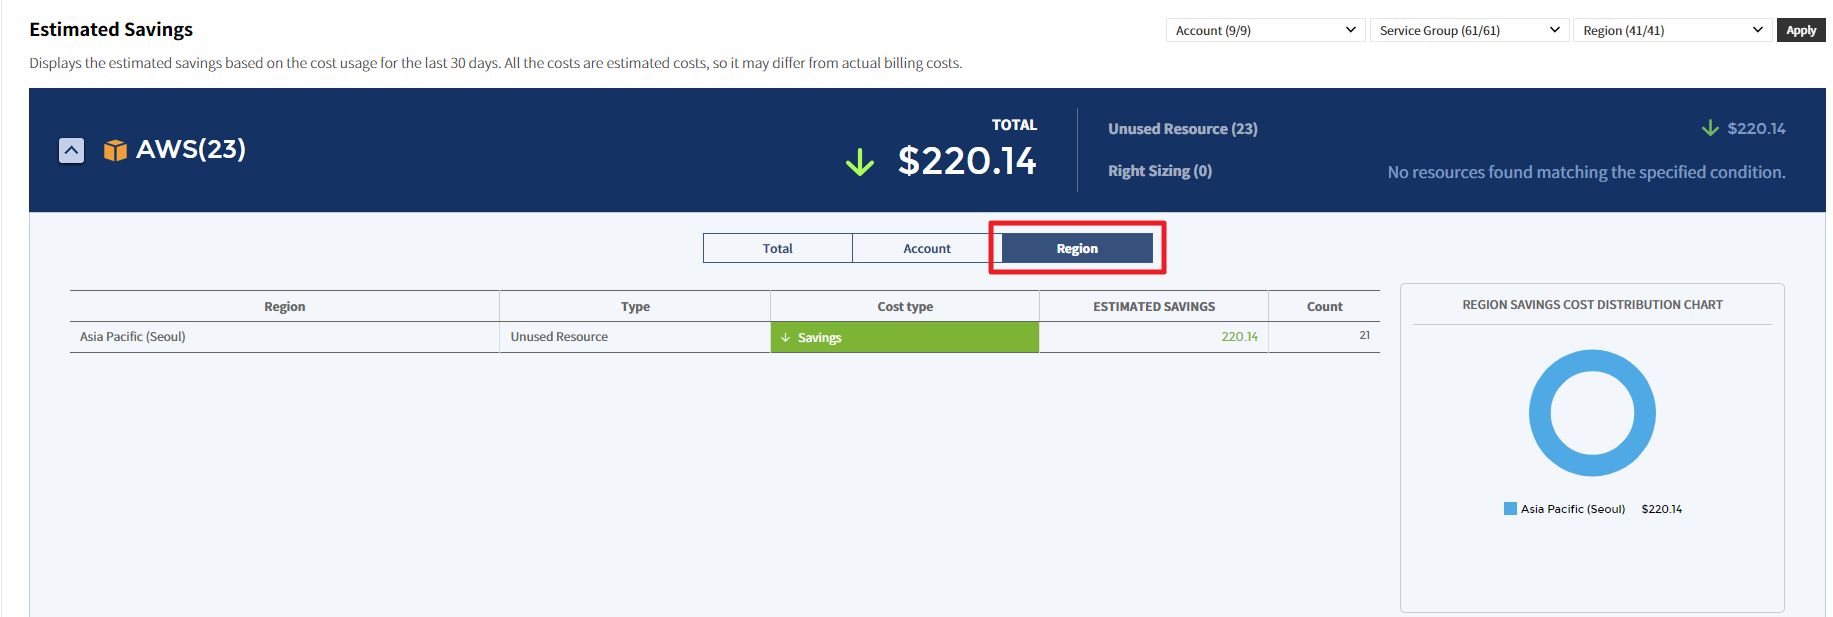
Region
You can view the estimated savings or estimated increase by region in the table chart and graph.
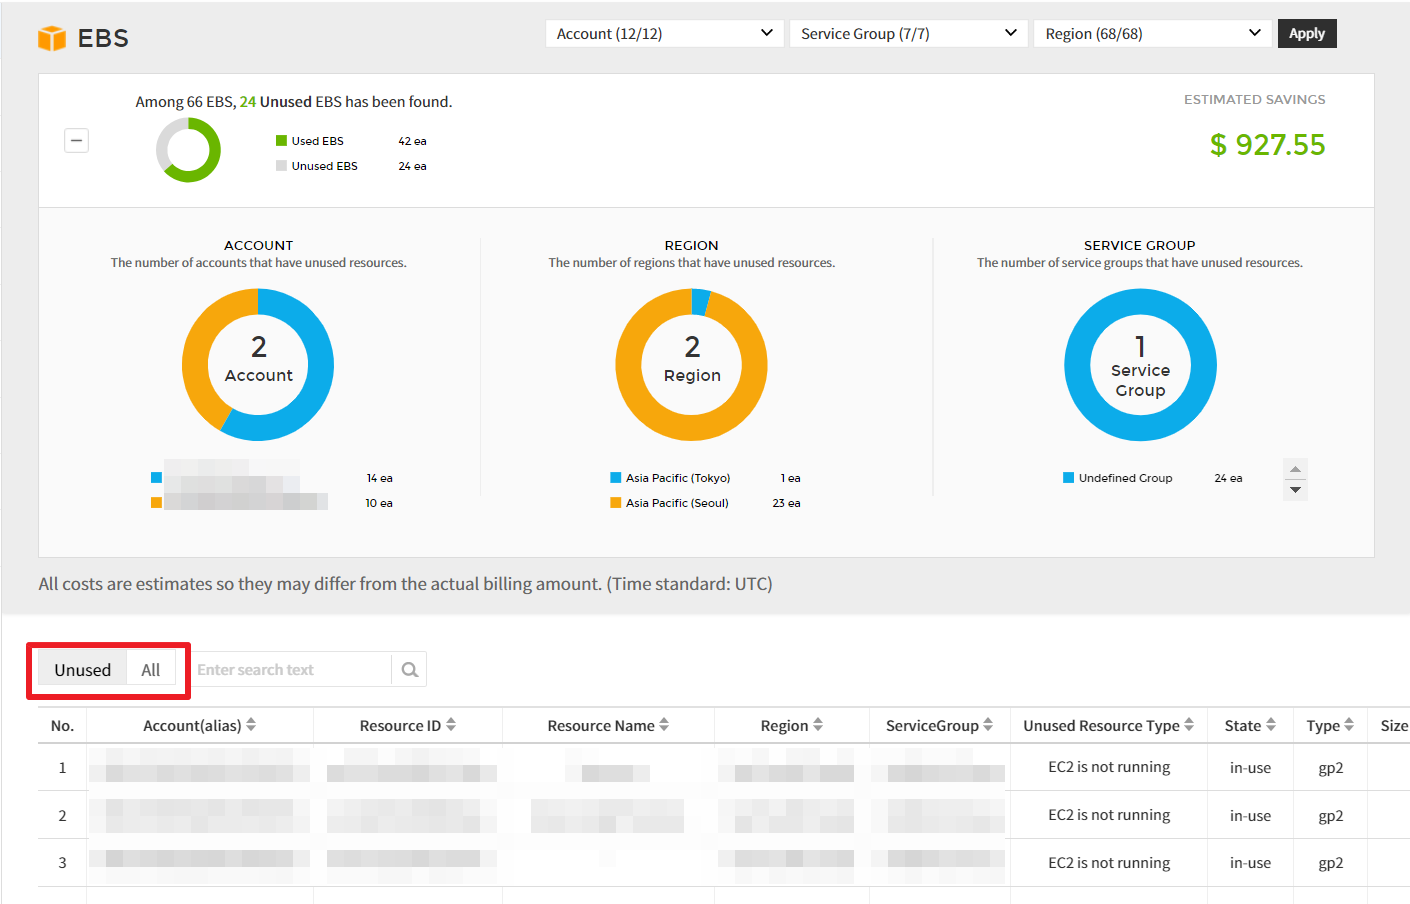
Unused Resource
The Unused Resource analyzes your data and identifies resources that are wasting money due to they were not used. You can identify resources that are not being used by cloud service, and view the estimated savings if resources are used based on the recommendations.
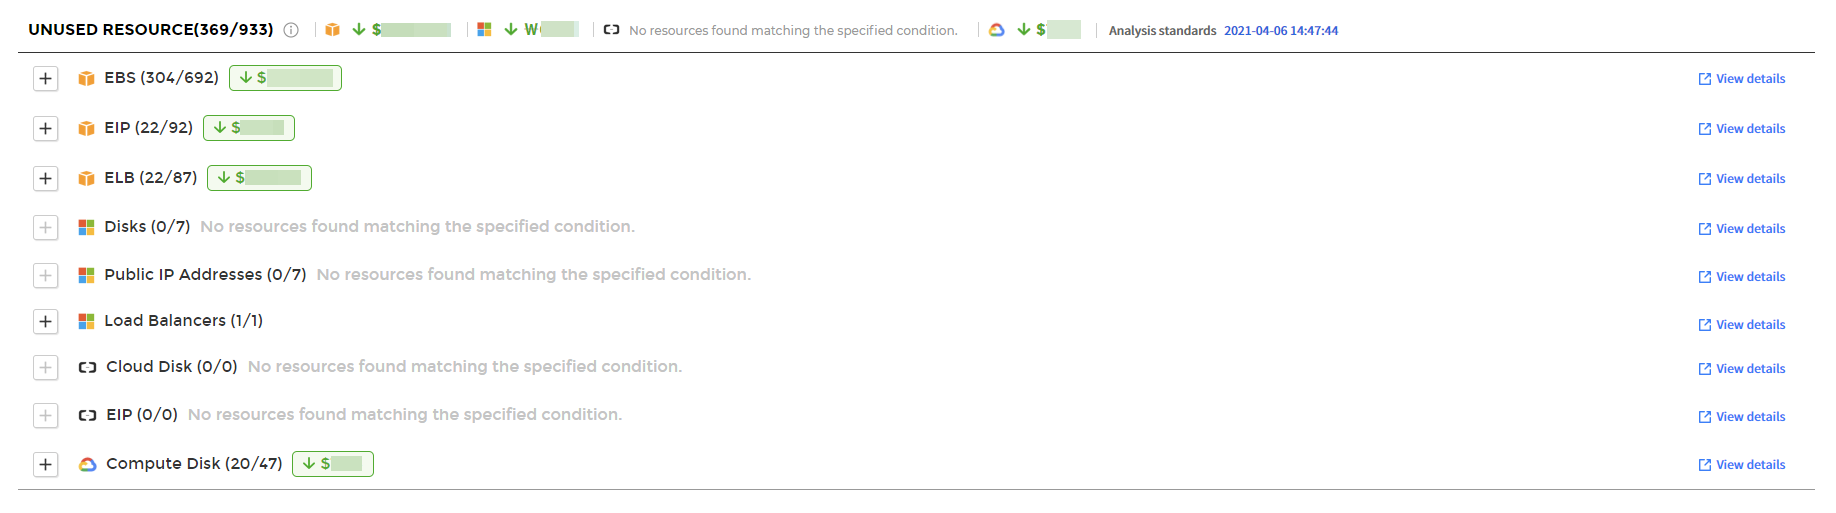
① Select a service from the list on the left side of the Unused Resource page to view the detailed information about the selected service.
② Use the Account, Region, and Service Group drop-down menus to set the data you need to view.
③ Click the [+] button to view unused resources by account, region, or service group in the pie chart and table chart.
You can also download the recommended resources in Excel format and analyze the unused resources offline.
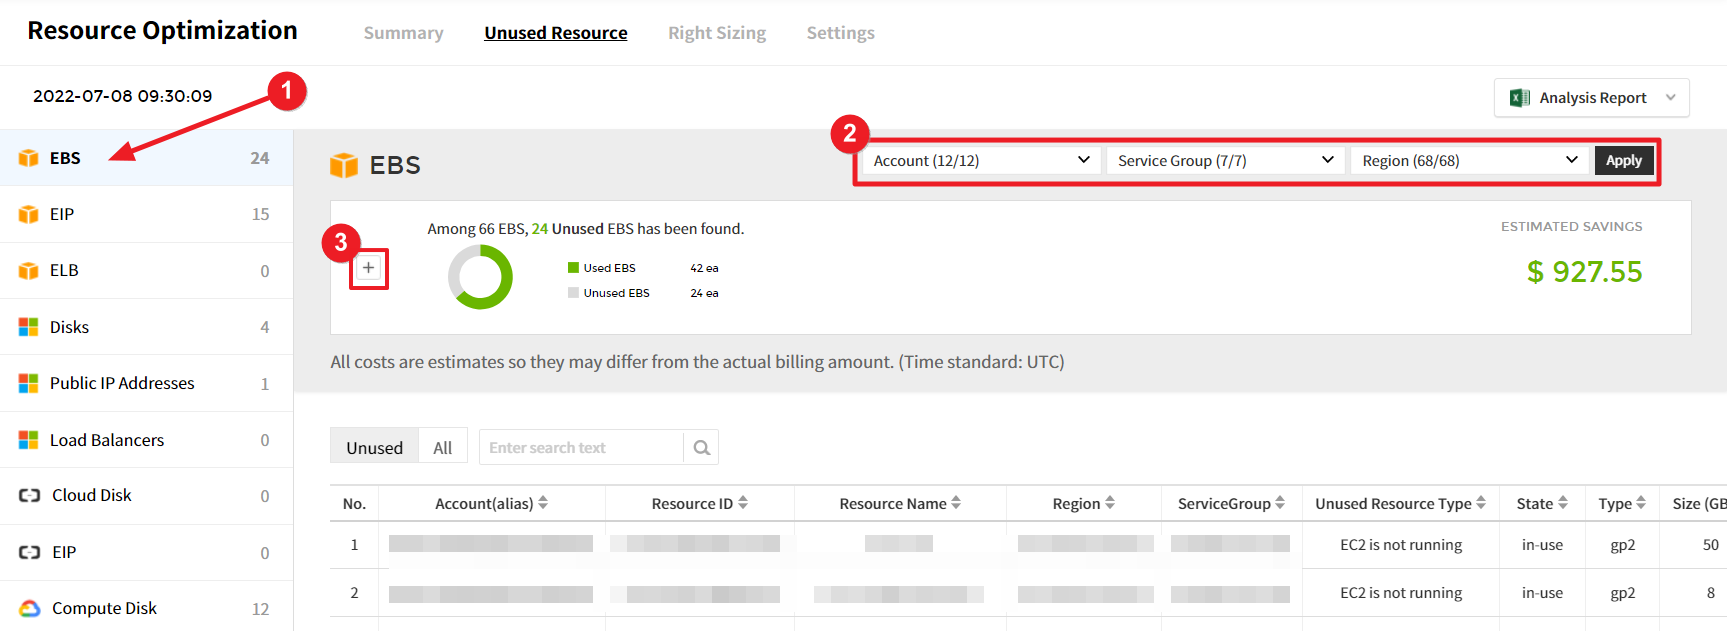
In addition, you can select Unused (recommended resources) or All (entire resources) located on the left side of the table chart to view unused resources only. Resources can be filtered with Account, Service group, and Region drop-down buttons.
Right Sizing
Right Sizing is one of the features to optimize resources and costs, helping you to manage your resources rationally by matching the instance type and size to your workload performance or capacity requirements. It allows you to identify resources that are being wasted due to too large or too small resources for your workload.
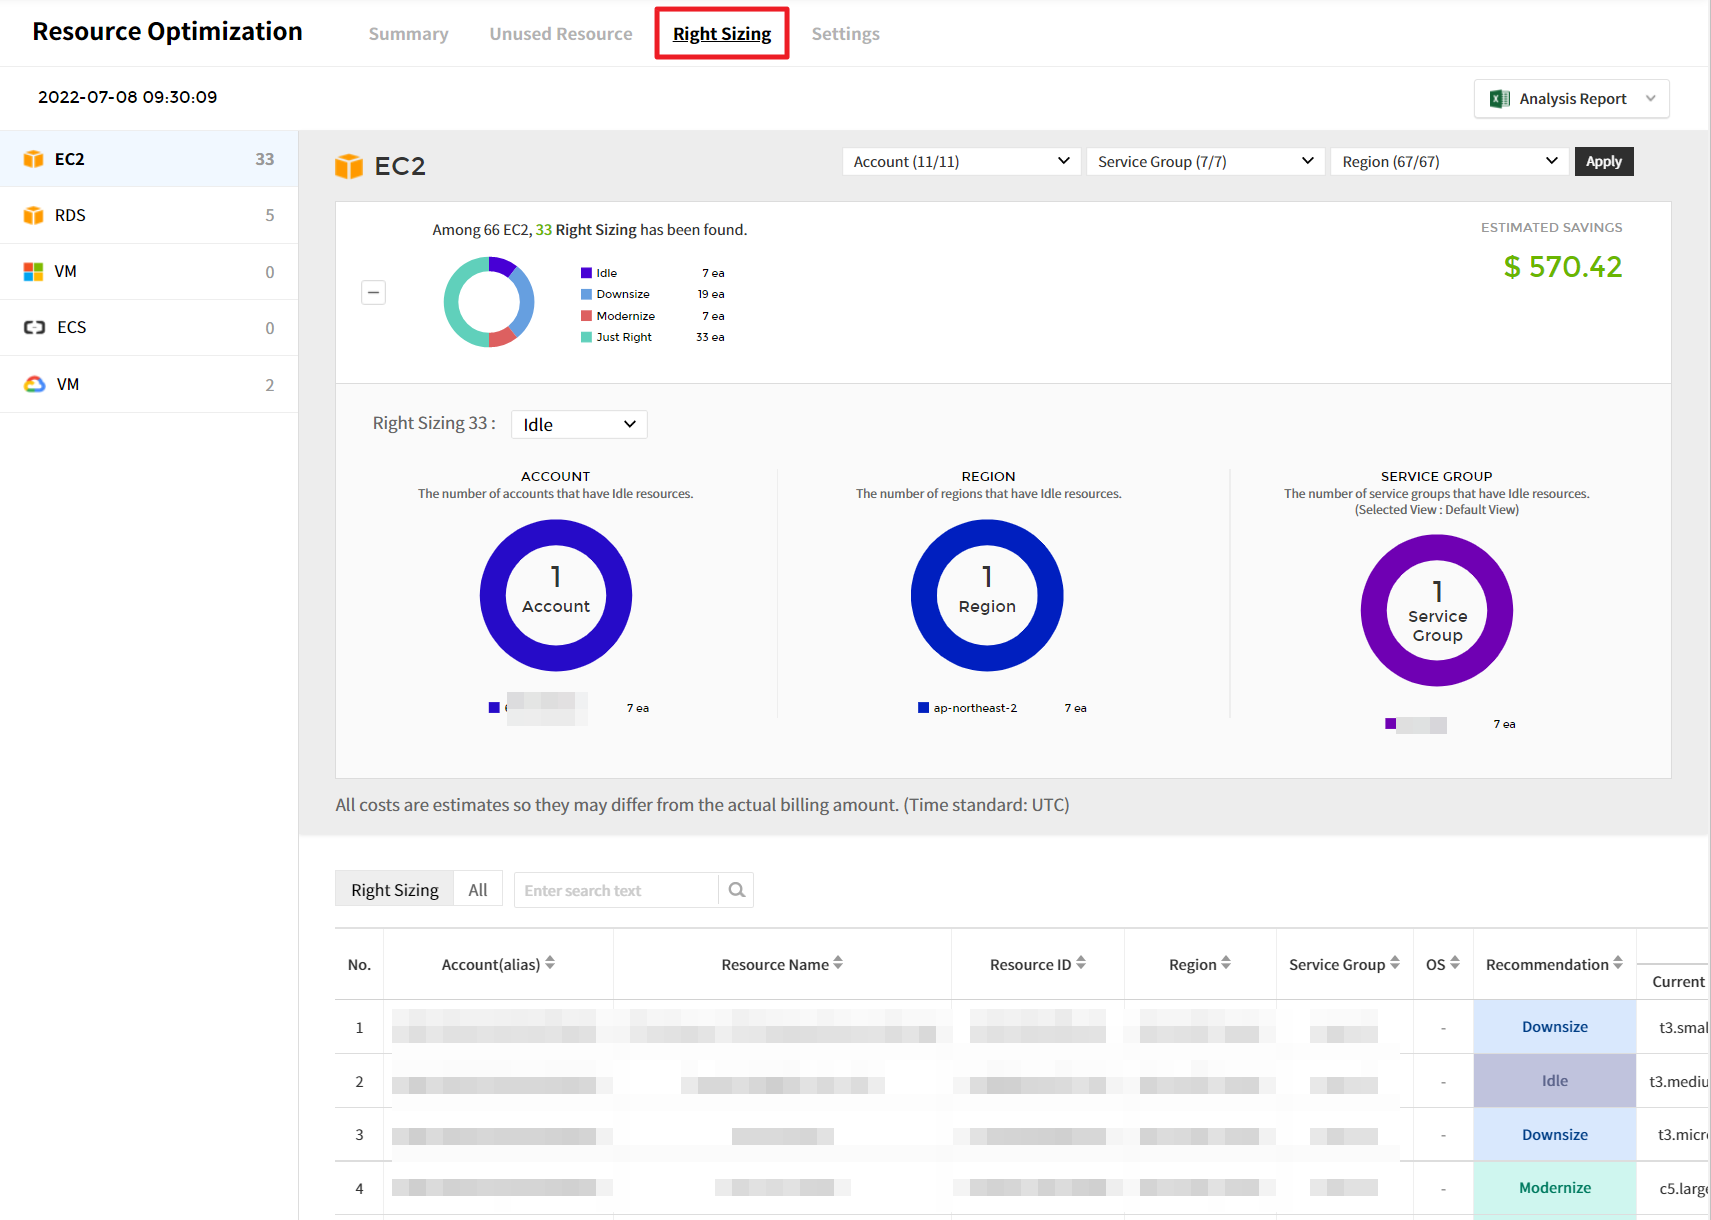
Detailed screen
① In Filter dropdowns, you can select accounts, service groups, and regions, and click [Apply] to view the recommended resources based on the condition you set.
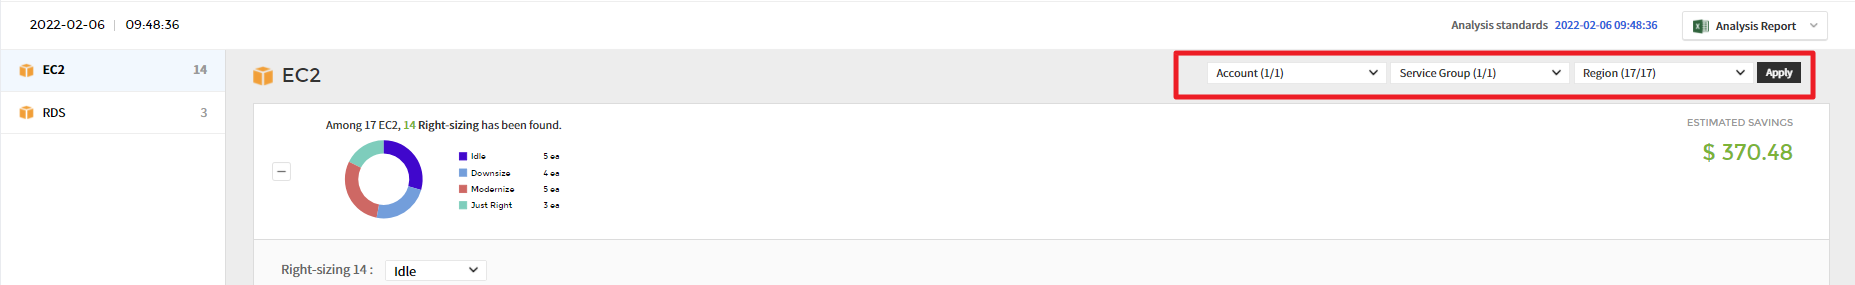
② Based on the analysis conditions defined in the settings menu, it recommends resources that require right sizing. Right Sizing feature analyzes resources and recommends them as Downsize, Upsize, Idle, or Modernize, and optimizes the resource and cost based on the recommendations.
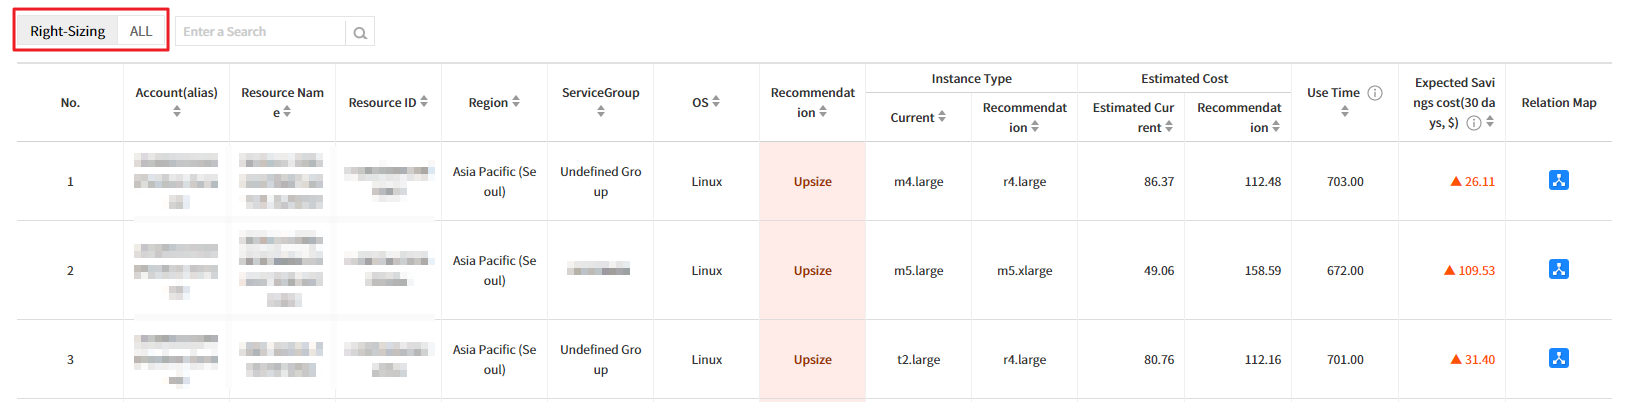
💡 Notification: For EC2 only, you can view the Relation Map for the selected resource by clicking the icon located at the far right of the table list.
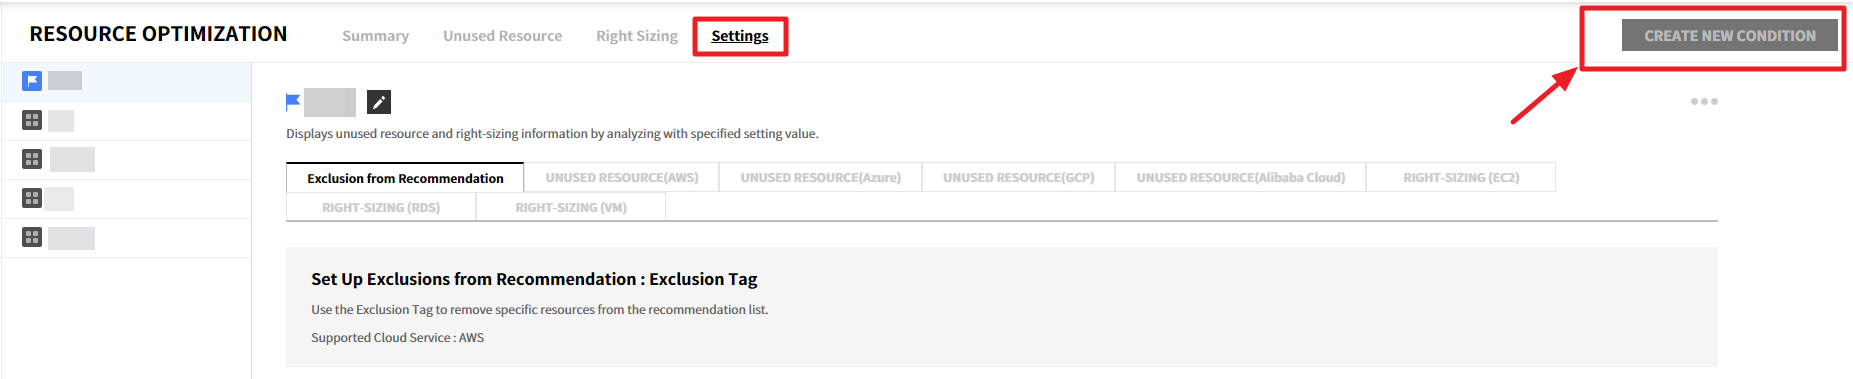
Settings
You can set up recommendation conditions for resource optimization. When you access the resource optimization for the first time, a default condition is created automatically, and Unused Resource and Right Sizing resources are provided based on the condition. Users can directly create new recommendation conditions based on their needs.
Create a Condition
To create a recommendation condition, follow the steps below:
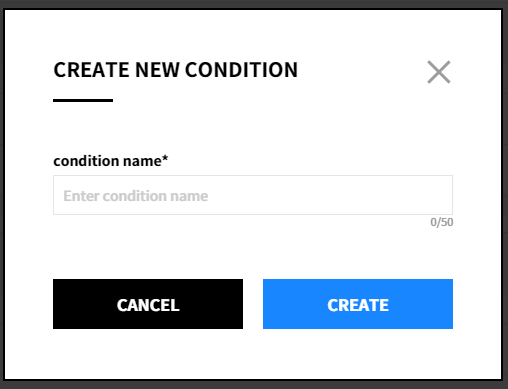
① Click the [Create New Condition] button.
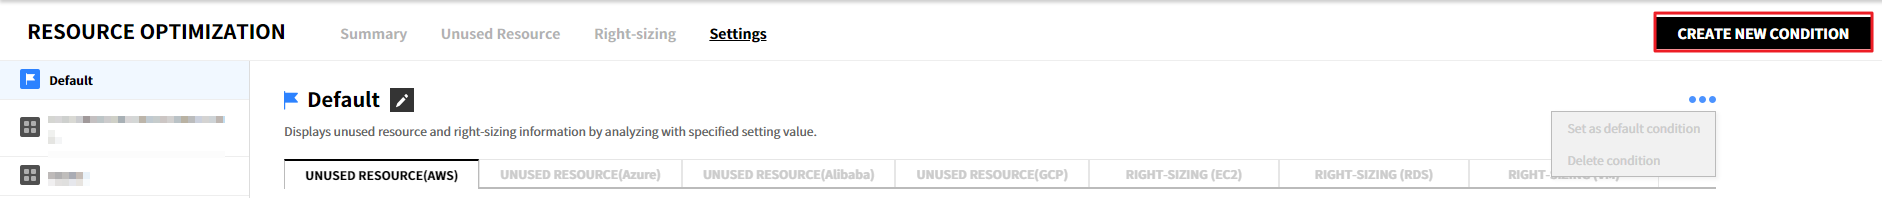
② After entering the condition name, click the [Create] button to create the condition. Only up to 5 conditions can be created.
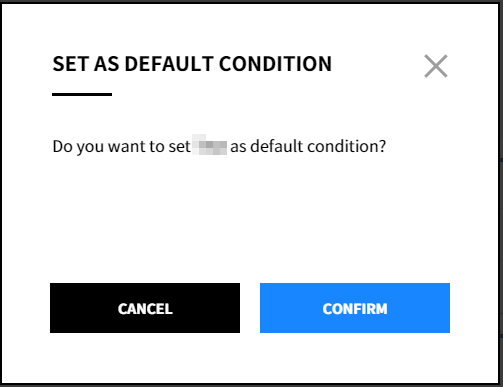
③ Click the icon next to the condition name or click the ![]() icon to change it to [Set as Default Condition].
icon to change it to [Set as Default Condition].
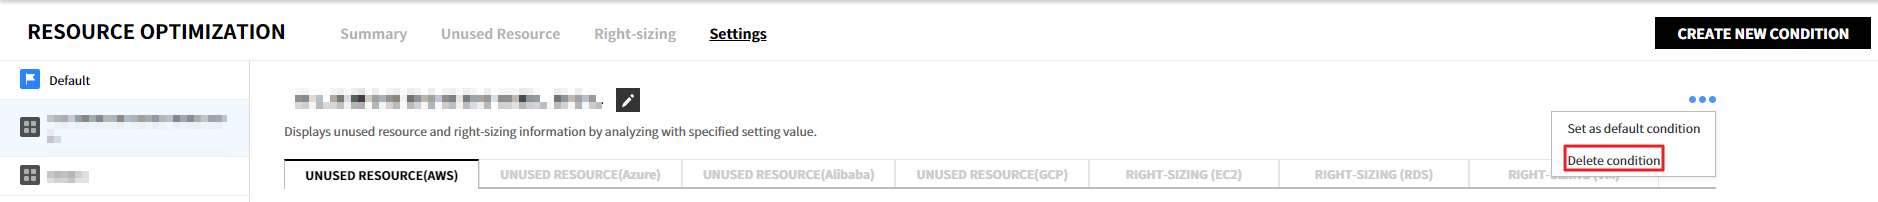
④ Select the ![]() icon of the created condition, and click [Delete Condition] to delete the condition.
icon of the created condition, and click [Delete Condition] to delete the condition.
Condition Type
Exclude from Recommendations
Use the Exclusion Tag to remove specific resources from the recommendation list in order not to receive recommendations for certain resources. To use this feature, It is required to set Tag Key and Tag Value.
💡 Notification: This feature currently supports AWS only, and other cloud services will be supported in the future.
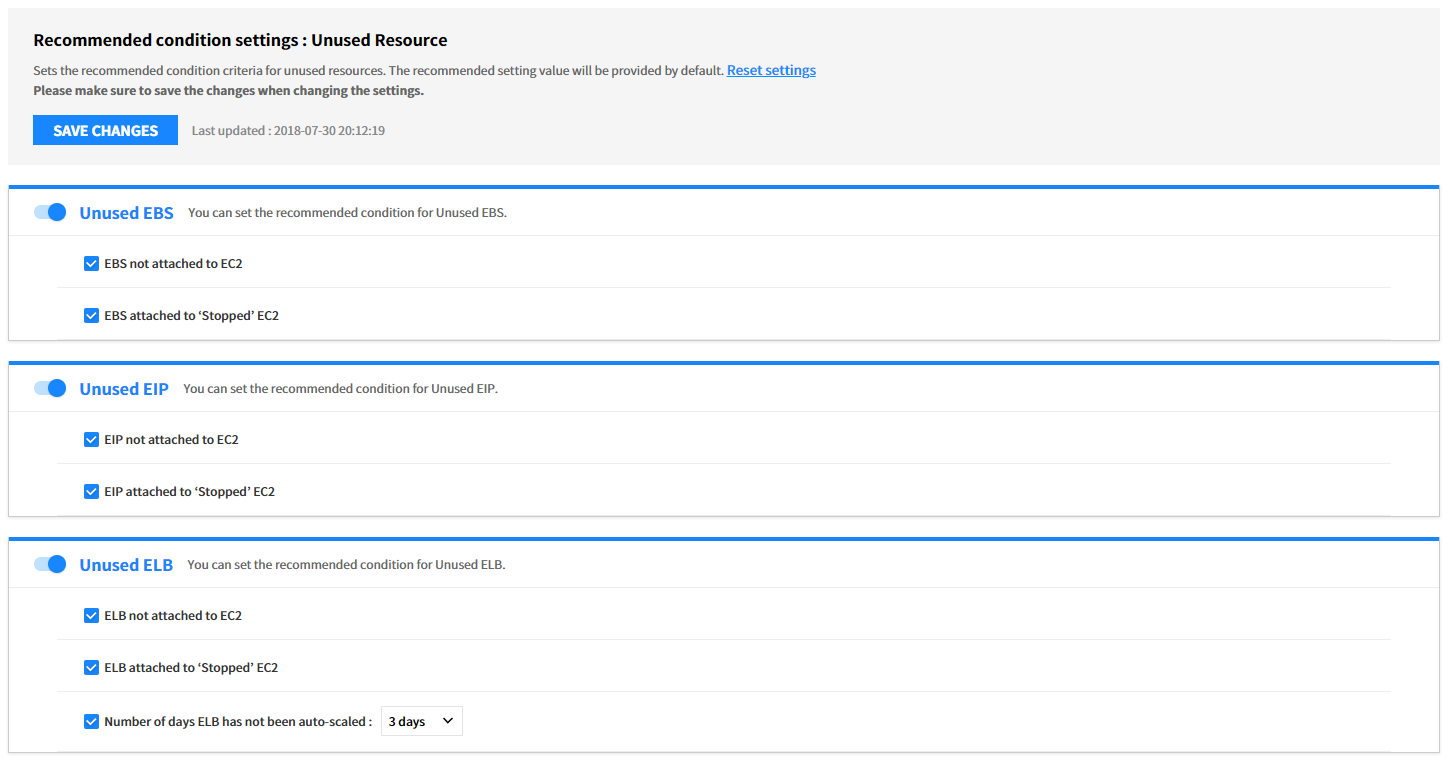
Unused Resource
You can set conditions for Unused Resource analysis by a cloud service. Use the toggle buttons and checkboxes to activate required items for recommendations. After changing the settings, click the [Save Changes] button to save the changes.
Right Sizing (EC2, RDS, and VM)
You can set conditions for Right Sizing analysis by a cloud service.
⑴ Step 1: Set Data Analysis Period
You can select the data size for right sizing analysis.
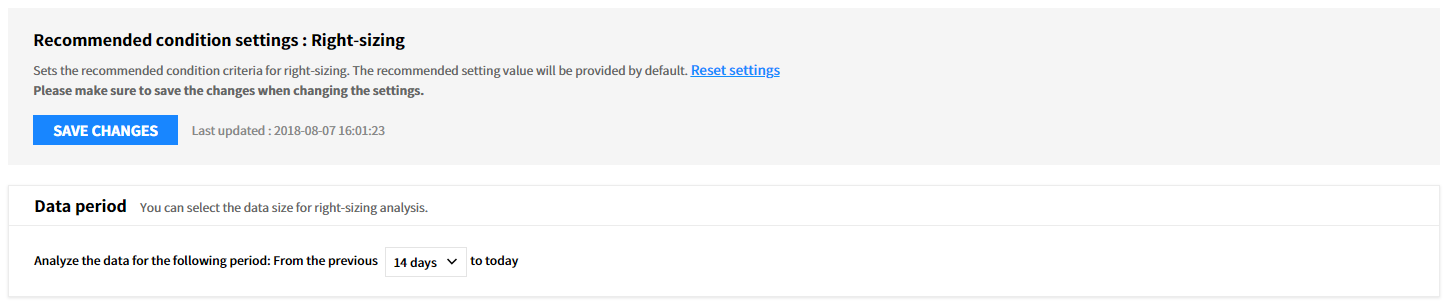
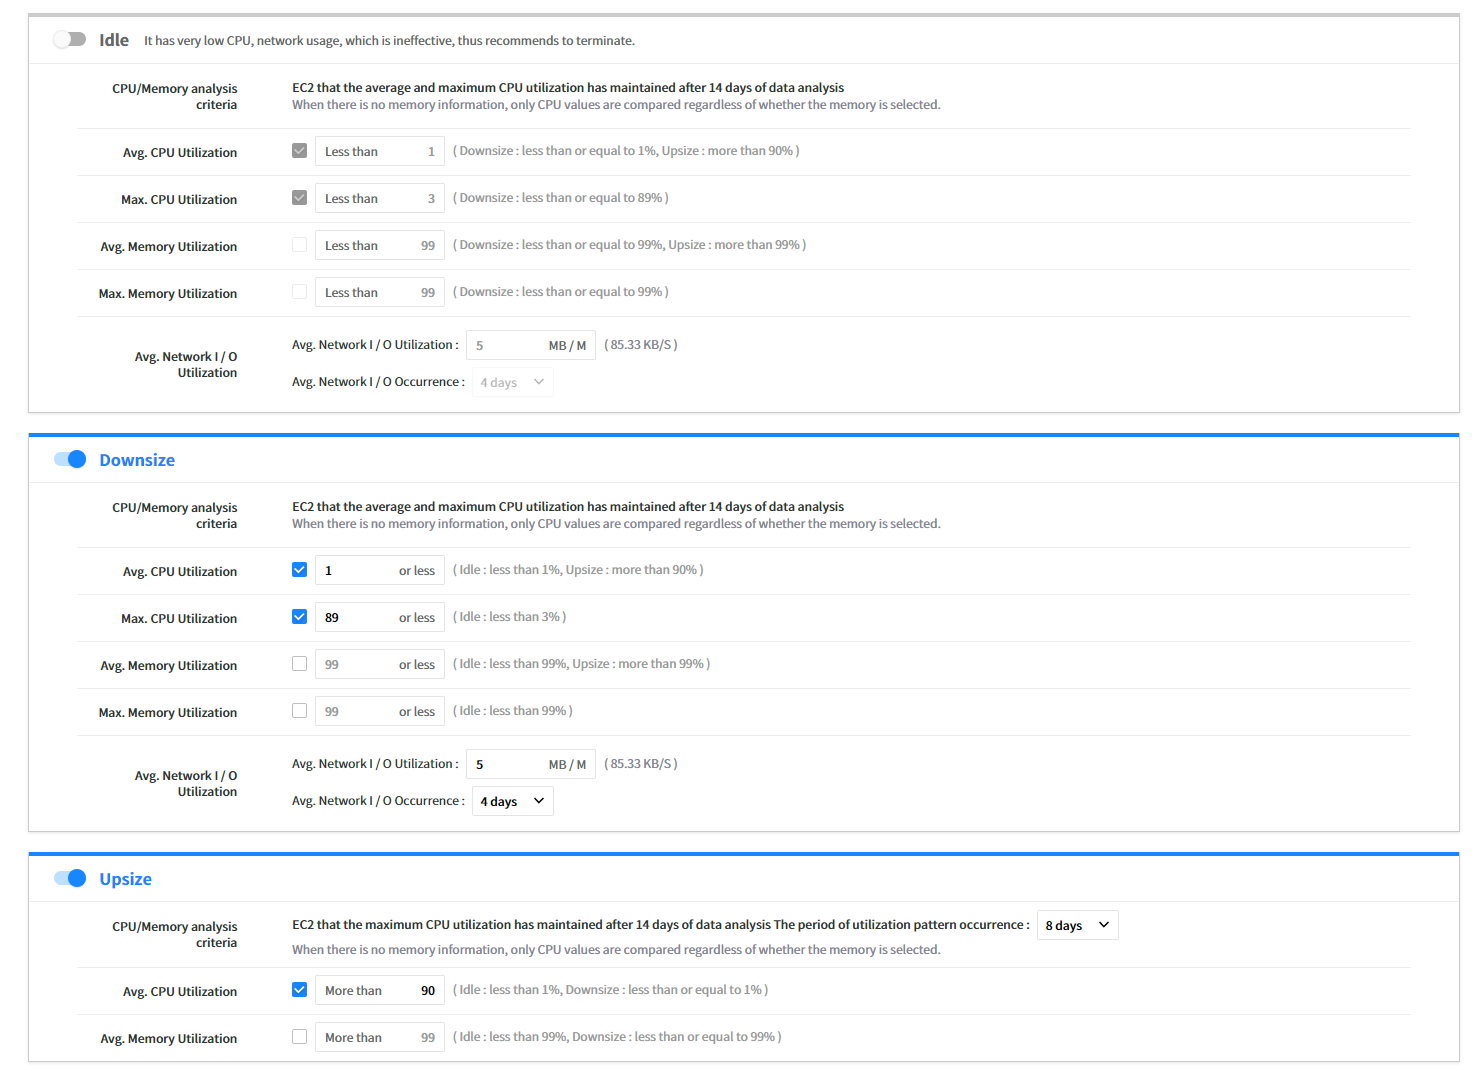
⑵ Step 2: Set Recommendation Conditions
You can set the recommendation criteria for each item.
- Idle: Recommend to terminate the resource if the usage is less than the defined usage after analyzing the usage of CPU, Network, and Memory.
- Upsize: Recommend to change to a higher performance resource if the usage exceeds the defined threshold after analyzing the usage of CPU, Network, and Memory.
- Downsize: Recommend to change to a lower price of resource if it falls below the usage defined during setting after analyzing the usage of CPU, Network, and Memory.
- Modernize: Recommend to change the current resources to the latest generation of the same resource type for a lower price and better performance.
| Analysis Criteria | Description |
|---|---|
| Avg. CPU Utilization | For Avg. CPU Utilization of Idle, it cannot have higher Avg. CPU Utilization value if it is recommended to Downsize. For Avg. CPU Utilization of Downsize, it cannot have lower Avg. CPU Utilization value if it is recommended to Idle EC2. For Avg. CPU Utilization of Downsize, it cannot have higher Avg. CPU Utilization value if it is recommended to Upsize. |
| Max. CPU Utilization | For Avg. CPU Utilization of Idle, it cannot have higher Avg. CPU Utilization value if it is recommended to Downsize. For Avg. CPU Utilization of Downsize, it cannot have lower Avg. CPU Utilization value if it is recommended to Idle EC2. |
| Avg. Memory Utilization | For Avg. Memory Utilization of Idle, it cannot have higher Avg. Memory Utilization value if it is recommended to Downsize. For Avg. Memory Utilization of Downsize, it cannot have lower Avg. Memory Utilization value if it is recommended to Idle EC2. |
| Max. Memory Utilization | For Avg. Memory Utilization of Idle, it cannot have higher Avg. Memory Utilization value if it is recommended to Downsize. For Avg. Memory Utilization of Downsize, it cannot have lower Avg. Memory Utilization value if it is recommended to Idle EC2. |
| Avg. Network I/O Utilization | By selecting the checkbox, the network metric data will be collected from CloudWatch. Based on the collected data, EC2 that volume is kept below the one set during the Data Period will be included in the recommendation condition of Idle EC2 and Downsize. |
Memory Metric Source
For more accurate Right Sizing analysis, it collects the memory metric by installing a script for your OS. You can download the script by selecting Windows, CentOS, Amazon Linux, or Ubuntu buttons. Click the [Save Changes] button at the top of the screen to complete the recommendation condition setting for Right Sizing resource.
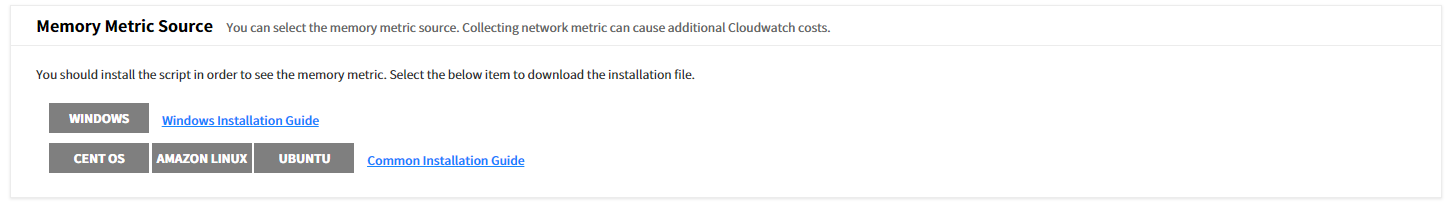
⚠️ Attention: Additional CloudWatch costs may arise if you collect network metrics.
Report
Asset > Report
You can view detailed information about resource information with resource performance, resource usage, and service group in the Report menu. There are two types of reports: Custom Report and Basic Report. With custom reports, you can quickly configure and create their own reports to view filtered data specific to their needs. Basic reports are provided by default with a predefined set of criteria. In addition, reports can be downloaded in Excel or PDF format.
Custom Report
You can configure and create your own reports with data provided by Asset service. It enables you to customize reports with different formats based on the template provided by default.
Console Configuration
The Custom report consists of the following.
- Favorites Only: Select the checkbox to view reports specified as favorites only.
- Duration: Set the date range to be displayed on the report. The options to choose the date range are the previous 7 days, 14 days, 1 month, 3 months, 6 months, and 1 year. Select Custom to select the period manually.
- Download: Download custom reports in Excel format.
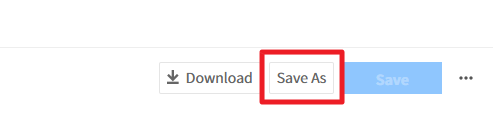
- Save As: Create a new report with a new name based on the conditions of the currently selected report.
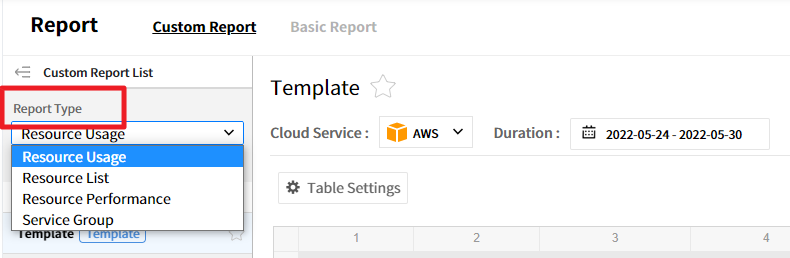
Report Type
Users can create a new report by selecting the report type, and data conditions differ depending on the report type. There are 4 types of reports: Resource Usage, Resource List, Resource Performance, and Service Group. Available data conditions for report types are different.
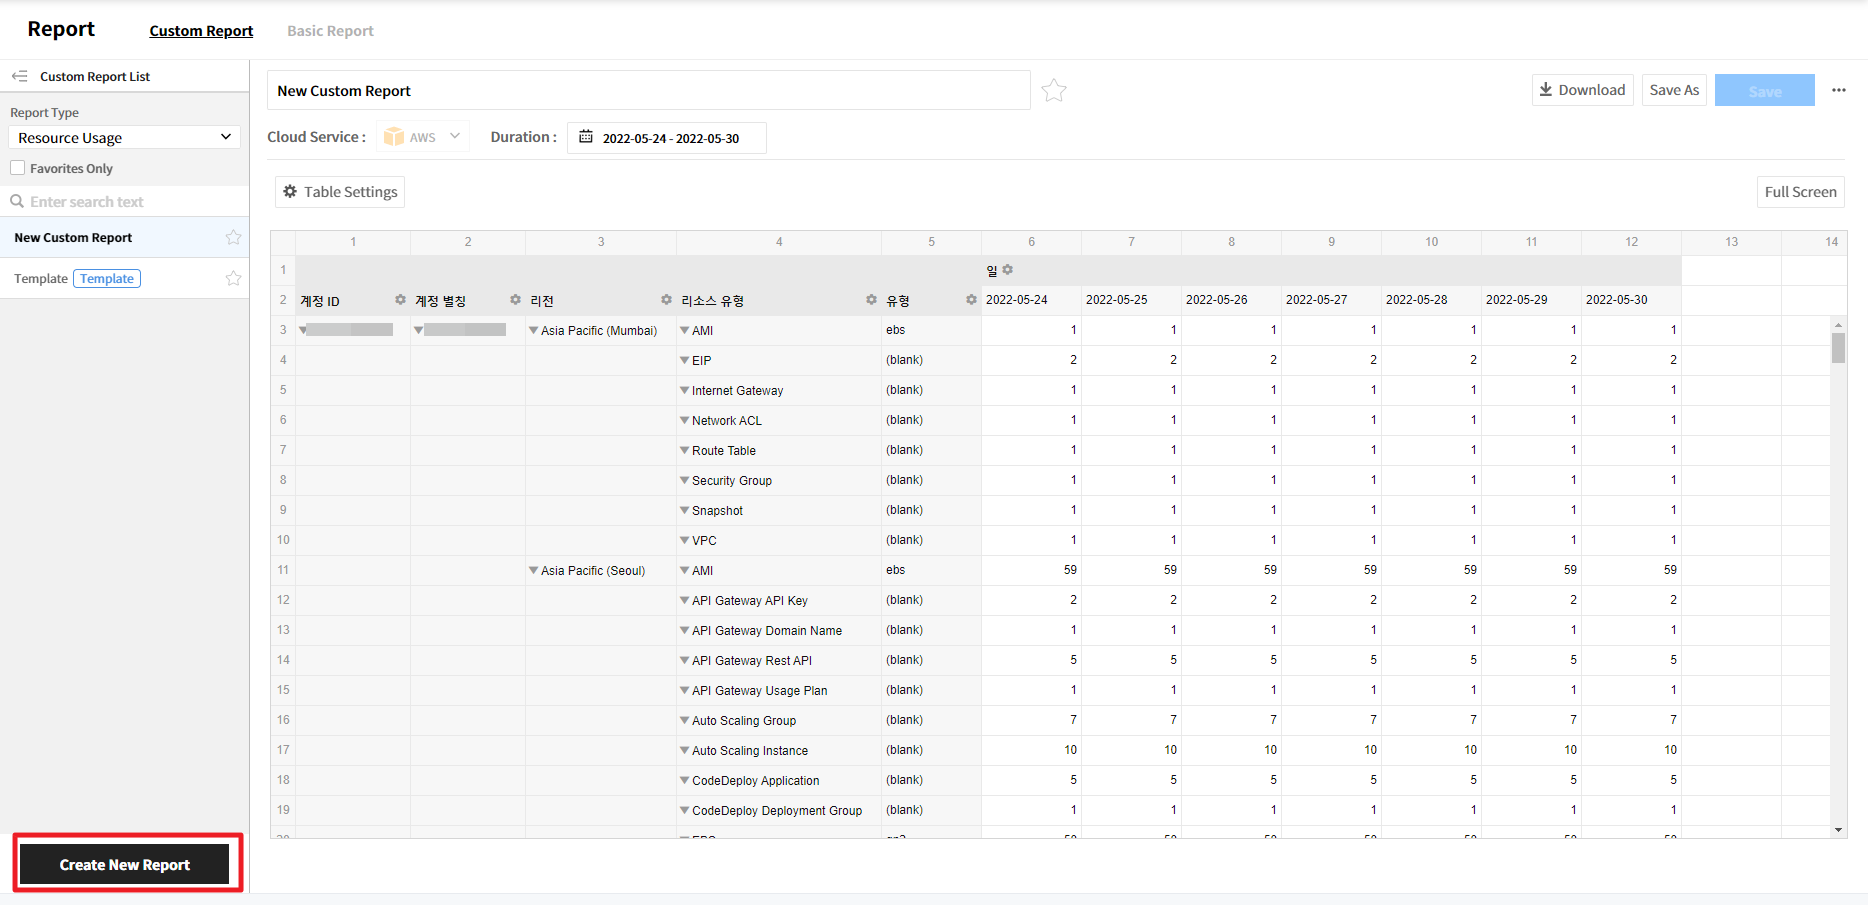
Create a Custom Report
Click the [Create New Report] button.
![]()
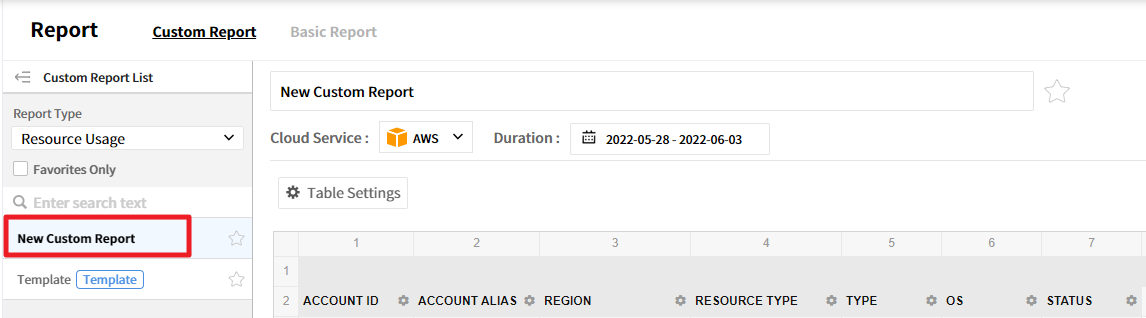
New Custom Report will be created.
![]()
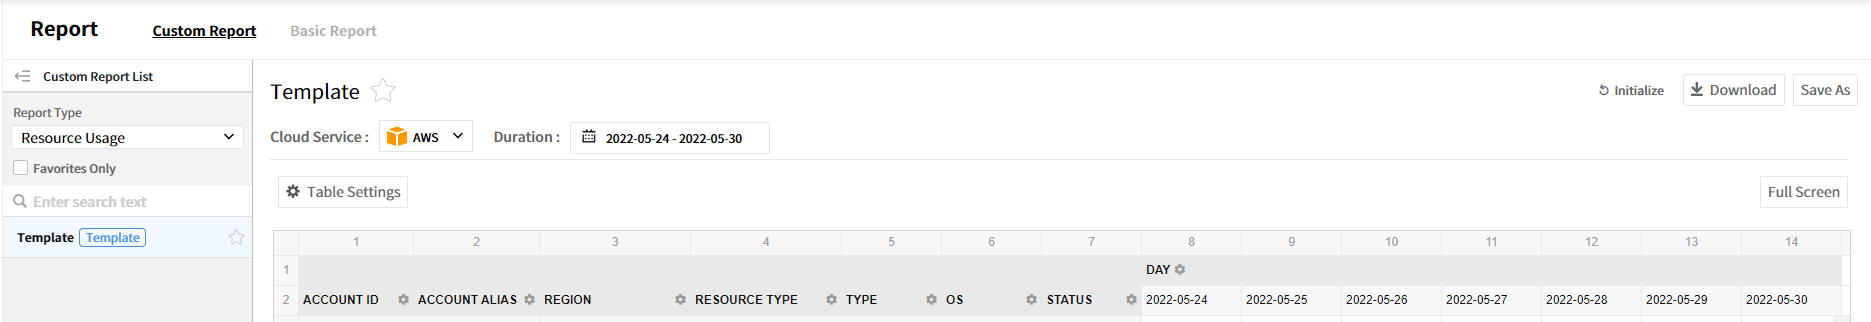
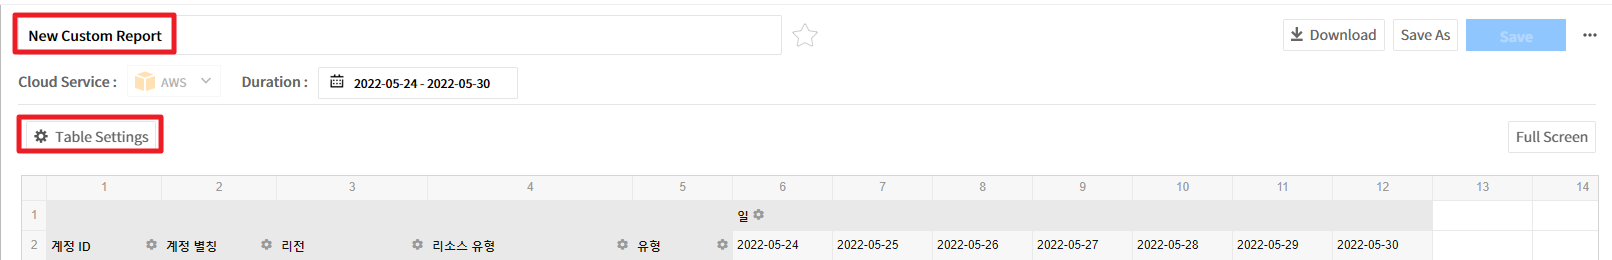
Select New Custom Report and change the name, and click [Table Settings] to set items required for the report.
![]()
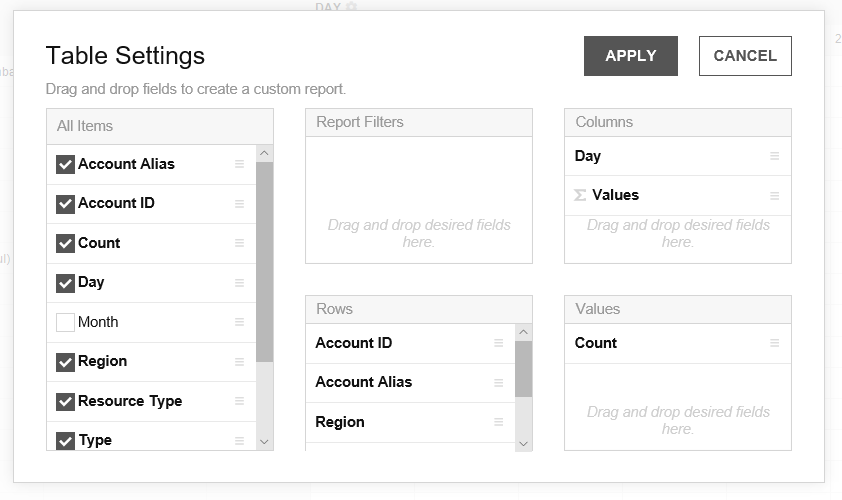
Drag items from the popup window of the table settings to Report Filters, Rows, Columns, and Values and click [Apply].
![]()
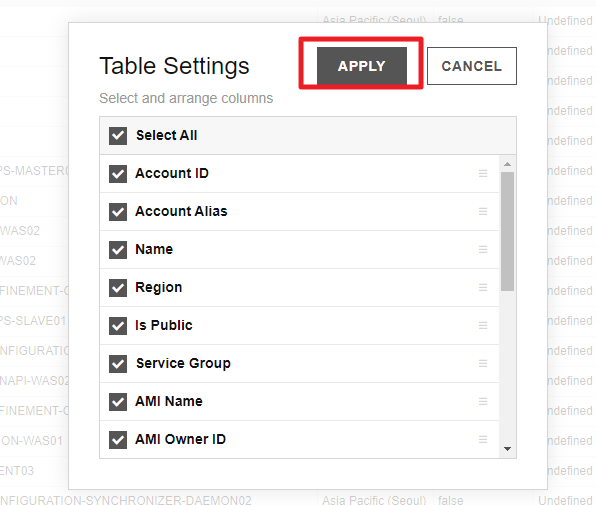
Select the resource list as the report type and click [Table Settings], and then a popup window will appear. Complete the settings and click [Save].
![]()
💡 Notification: If No data available is displayed, you may set the date range to short. Try extending the range and you will see the data correctly.
Modify Custom Reports
You can modify the report name, data conditions, fields to display on the table, and the field values. The items to modify are different for each report type. For report name, you can modify it directly on the name field or click [Save As] and rename it. Modifying custom reports goes through the same process as creating it, and click Save to modify the report.
📌 Important: For data conditions, you can set the cloud service-related conditions (Cloud Service Provider, Metric, and Resource) only when you create a report for the first time, and after creating the report, you can modify duration and View only.
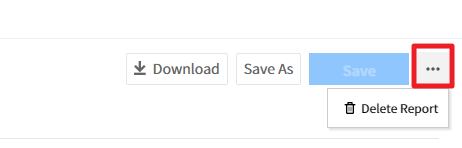
Delete Custom Report
Click the [Delete Report] button at the top right of the report screen to delete the report.
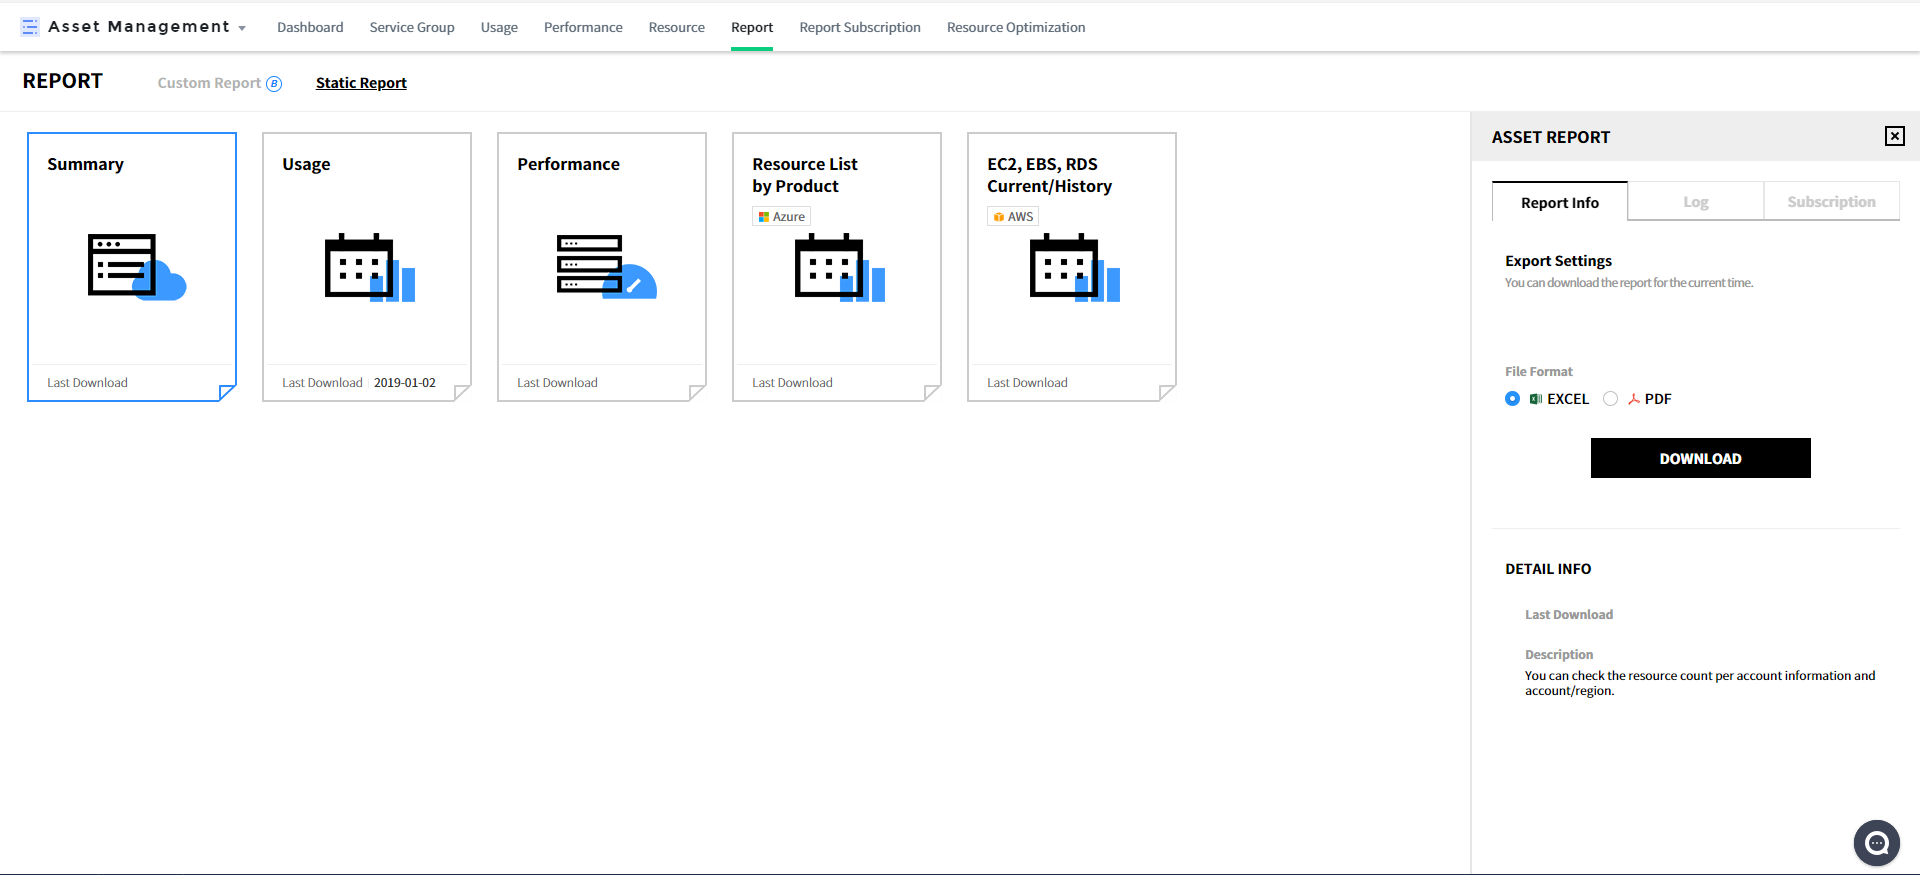
Basic Report
The Basic Report provides 5 types of report templates.
Report Type
- Resource Summary: Can check the account information, and resources by account and region.
- Resource Usage: Can check the list of resources by account and region and their status.
- Resource Performance: Can check the performance information by resource for the selected period.
- Resource List by Product: No longer supported. Can be available in the Custom Report.
- EC2, EBS, RDS Current/History: Can check the current and history information of EC2, EBS and RDS.
Report Component
Report Information: Users can download reports for the current time. For the performance report, date range can be set. Select the file format as Excel or PDF and click [Download] to download. Click each template to view template settings of the report on the right, and the settings are composed of the following three tabs.
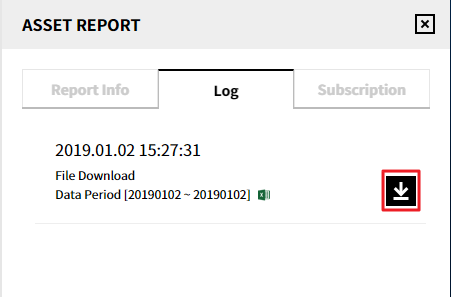
Log: View the history logs of reports downloaded, and click the icon to download the report again.
![]()
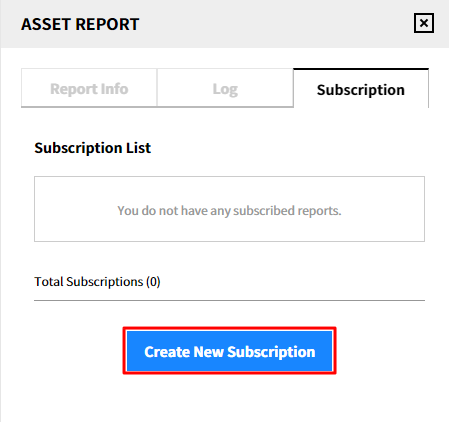
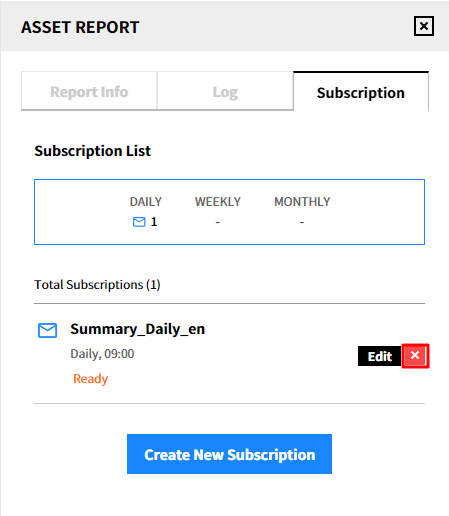
Subscription: Users can subscribe to reports via email registered in the service. You can subscribe on a daily, weekly and monthly basis; and you can specify a time to receive reports. There are two different kinds of subscriptions; subscriptions you created manually and subscriptions the authorized user specified you as a subscriber. You can create, delete and modify the subscriptions you created, but you can only view the subscriptions that the authorized user has specified you as a subscriber.
Create a new subscription
① Click [Create New Subscription] in the Subscription tab.
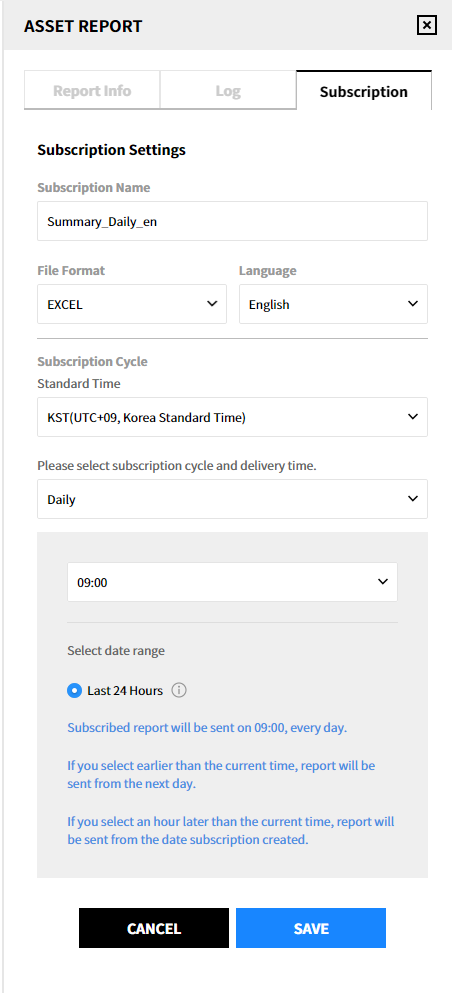
② Enter the required items in the subscription settings and click [Save]. The subscription name consists of the report template name, cycle and language as default.
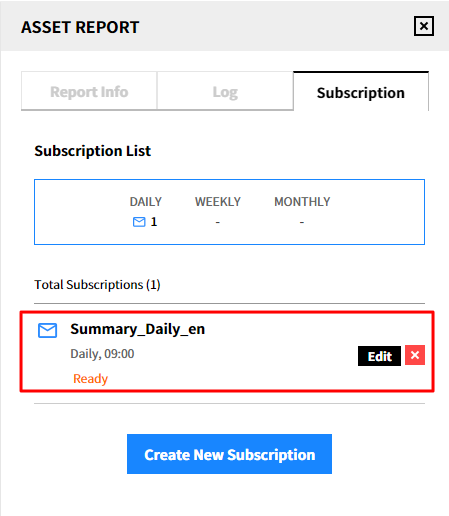
③ The created subscription will be displayed as below.
Modify the subscription
① Click [Edit] of the subscription that you want to edit.
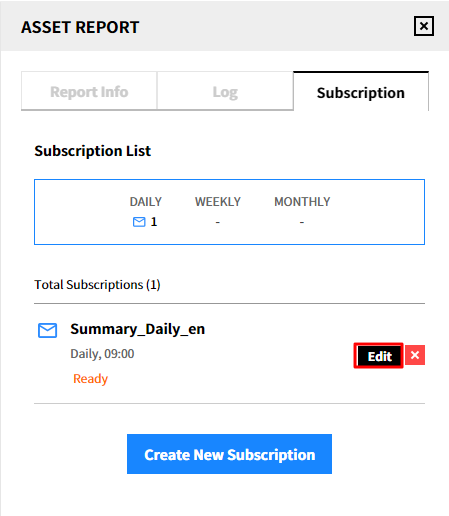
② After modification, click the [Save] button.
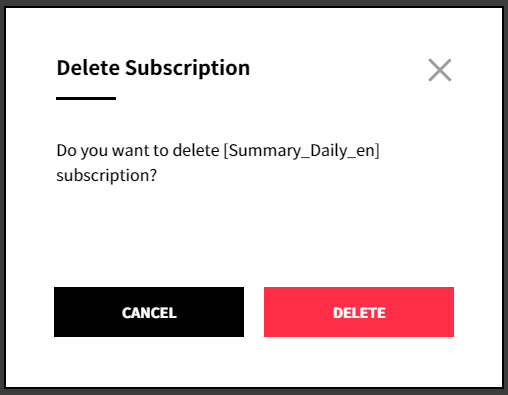
Delete the subscription
① Click the [Delete] icon.
② Click [Delete] in the popup window to delete the subscription from the list.
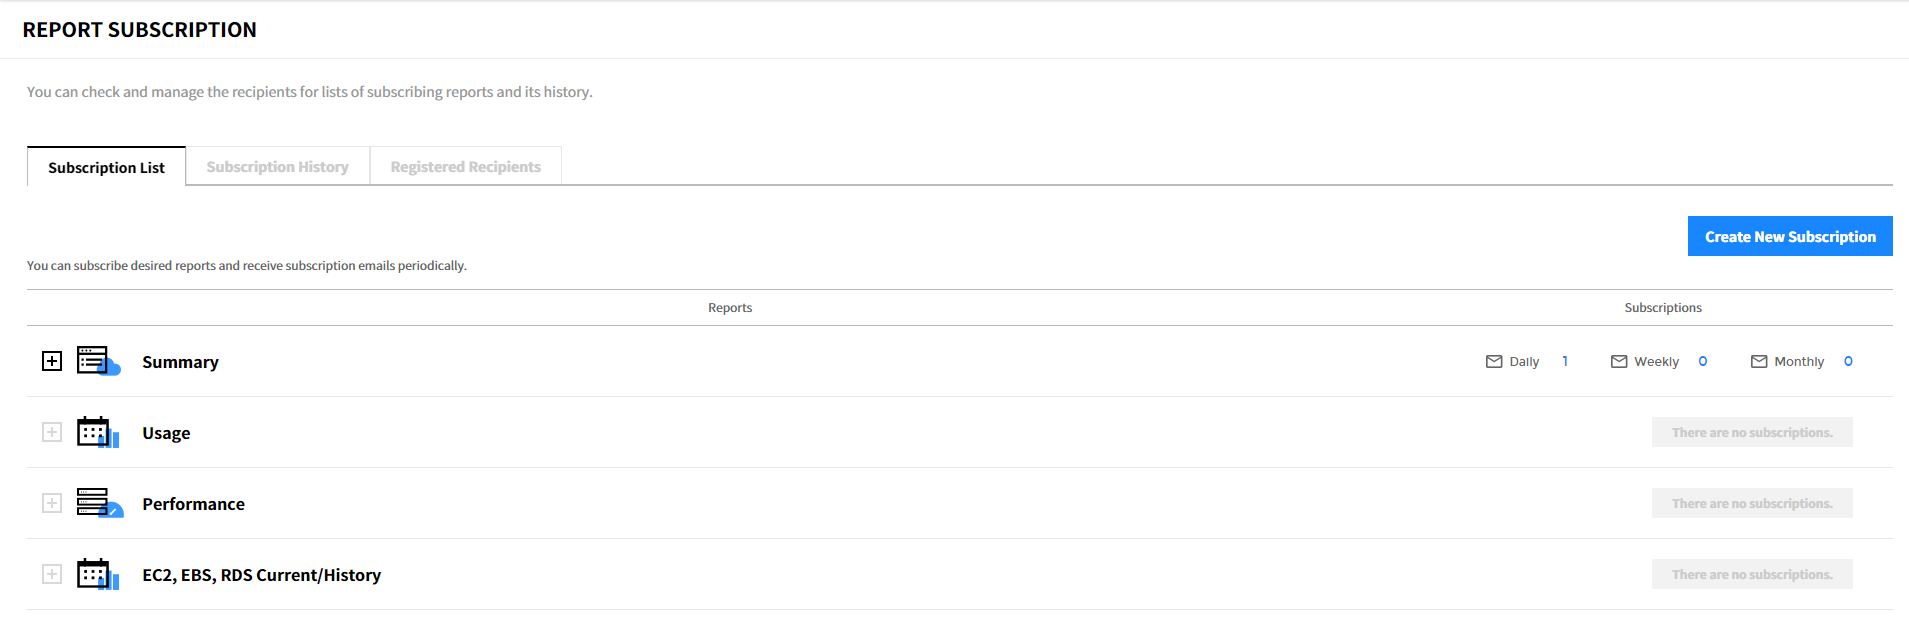
Report Subscription
Asset > Report Subscription
The Report Subscription provides automatic mailing feature with authentication to modify subscriptions. In this menu, you can create, modify, or delete subscriptions, view subscription history, and re-download reports that have already been sent. You can also manage recipients by creating and deleting email addresses, and specify recipients when creating and modifying subscriptions.
Subscription List
You can create subscriptions by report type (Summary, Usage, Performance, and EC2, EBS, RDS Current, History), and modify and delete the created subscription.
Create Subscription
① Click [Create New Subscription] in the subscription list.
② Select a report to subscribe. Click [Next] after selecting the report type, file format, and the language.
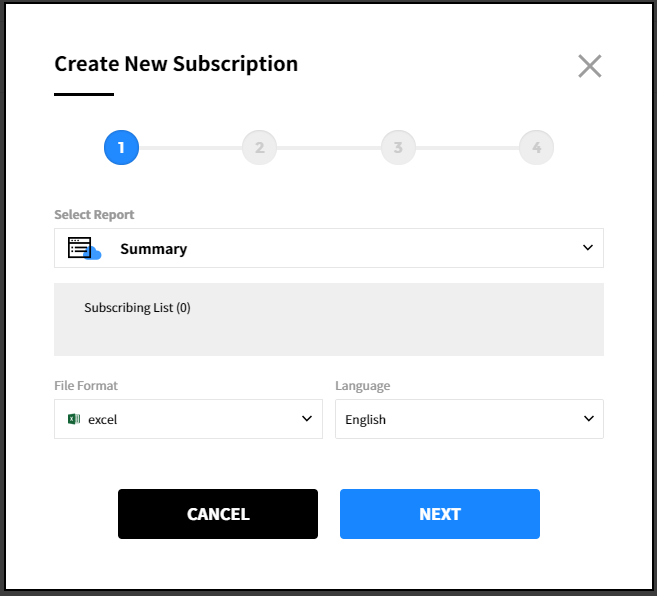
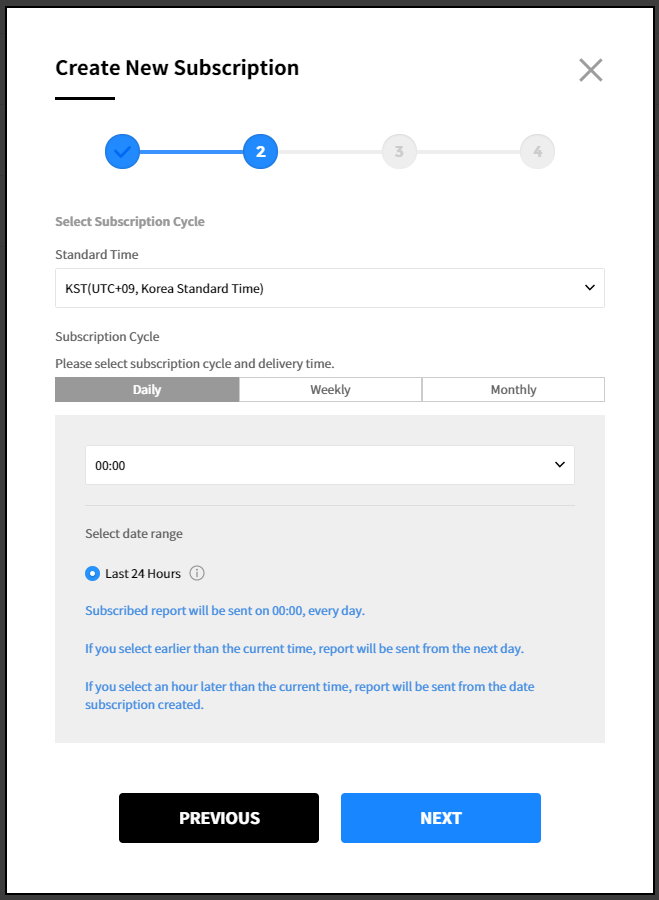
③ Select subscription cycle. Choose the time zone and select the cycle for your subscription. The cycle can be set on a daily, weekly, and monthly basis. If you choose to receive subscriptions on the 31st day, you will receive subscriptions at the last date for the months that have no 31st day.
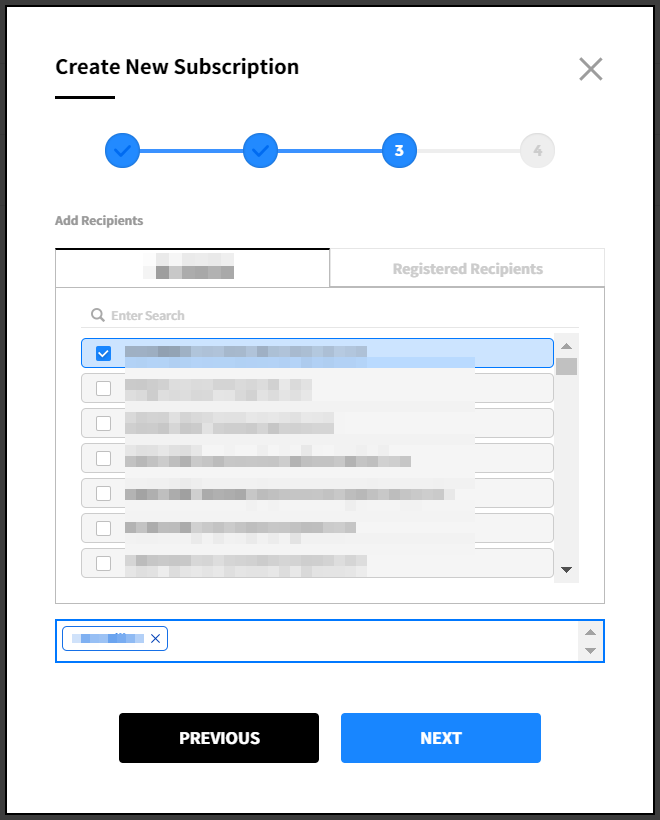
④ Add recipients. Up to 10 recipients can be added. There are two types of recipients; users who belong to the company with authorization to access the Service Portal and registered recipients you manually registered in the Report Subscription. Select recipients and click the Next button.
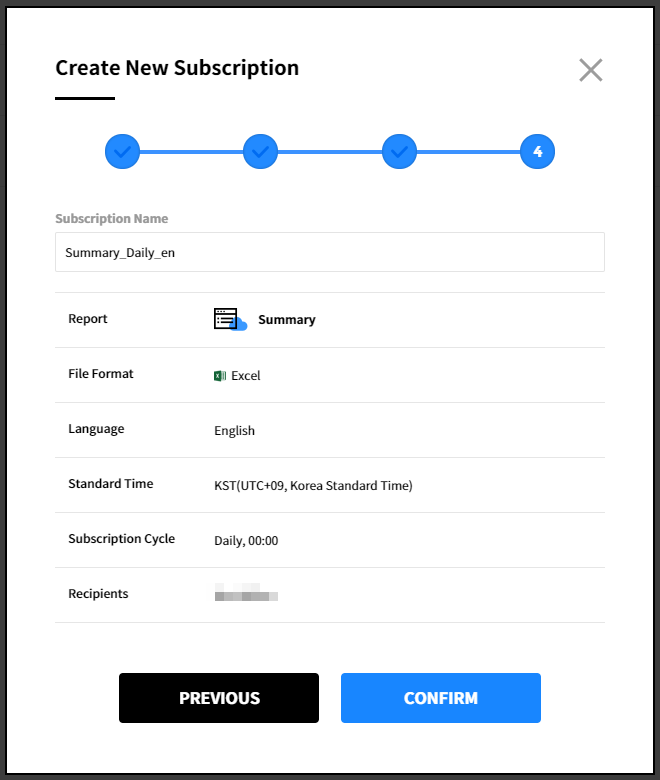
⑤ Enter a subscription name. The subscription format should be report type_cycle_language as default, and the name can be changed. Review the items configured in the previous steps, and click [Confirm] to create a subscription.
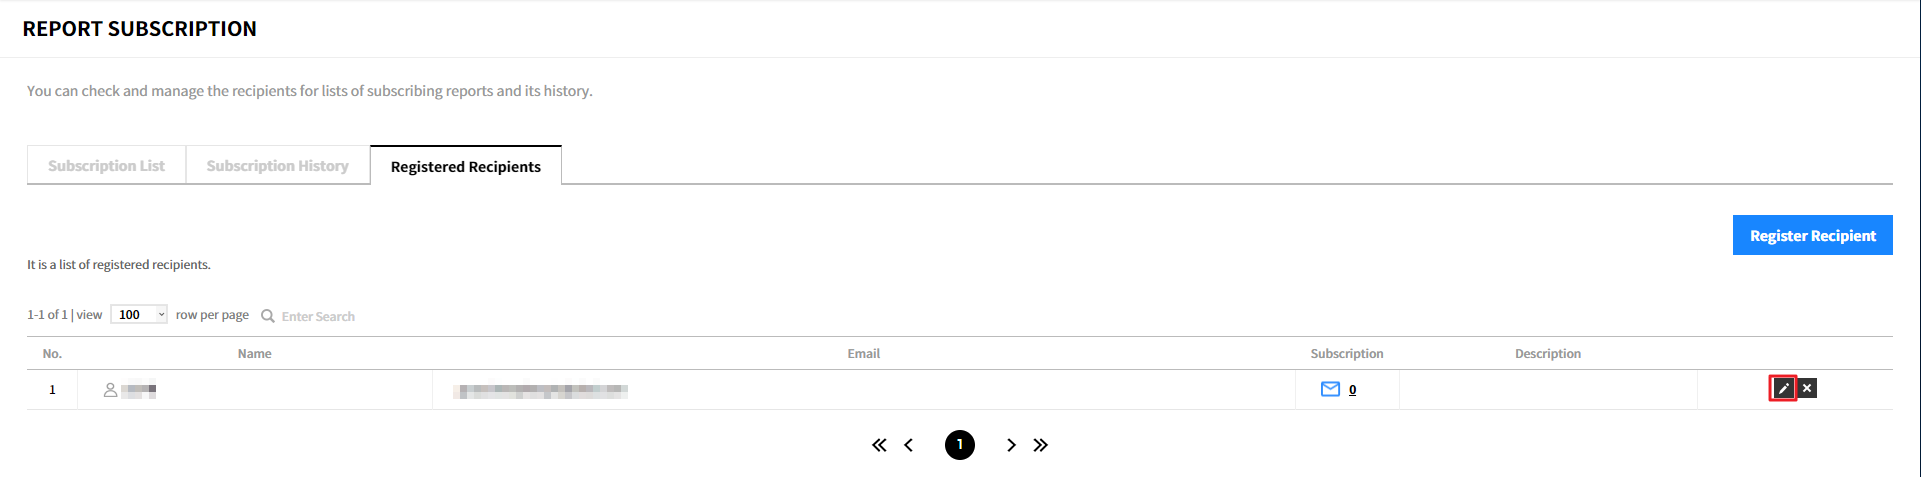
Modify Subscription
① Click the modify icon from the subscription list.
![]()
② The subscription information you previously set is displayed. Click [Modify] after choosing a subscription that you want to edit and apply the changes.
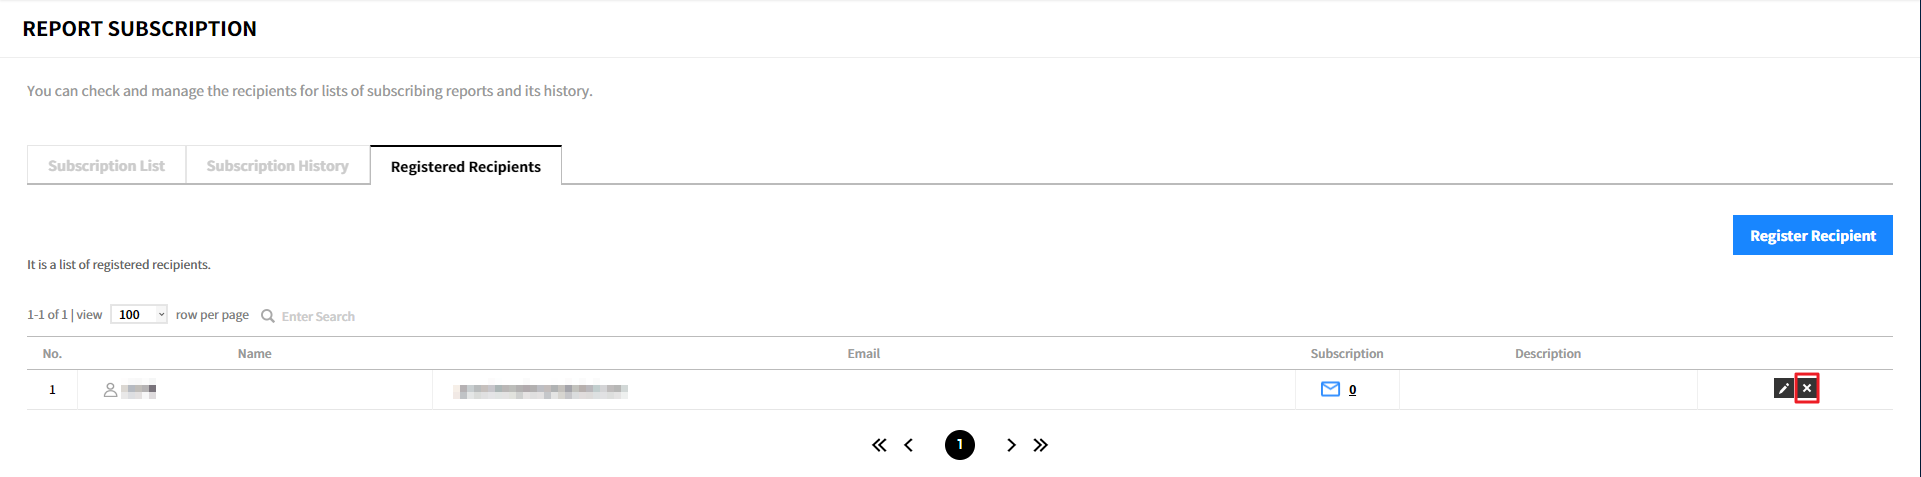
Unsubscribe reports
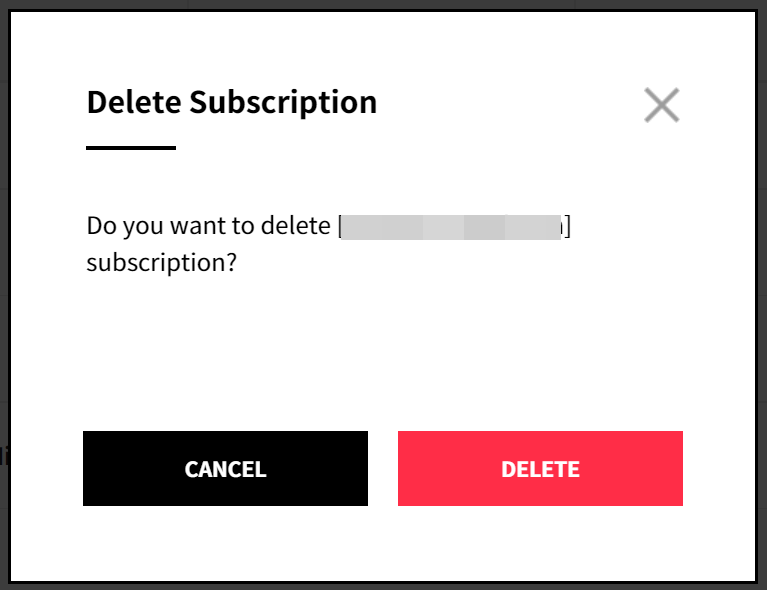
① Click the red [X] icon from the subscription list to unsubscribe the reports.
![]()
② Click [Delete] to delete a subscription. If this subscription has been previously sent, you can also see the history log from Subscription History tab.
Subscription History
You can view the history of subscriptions that were sent, and can download files that were recently sent.
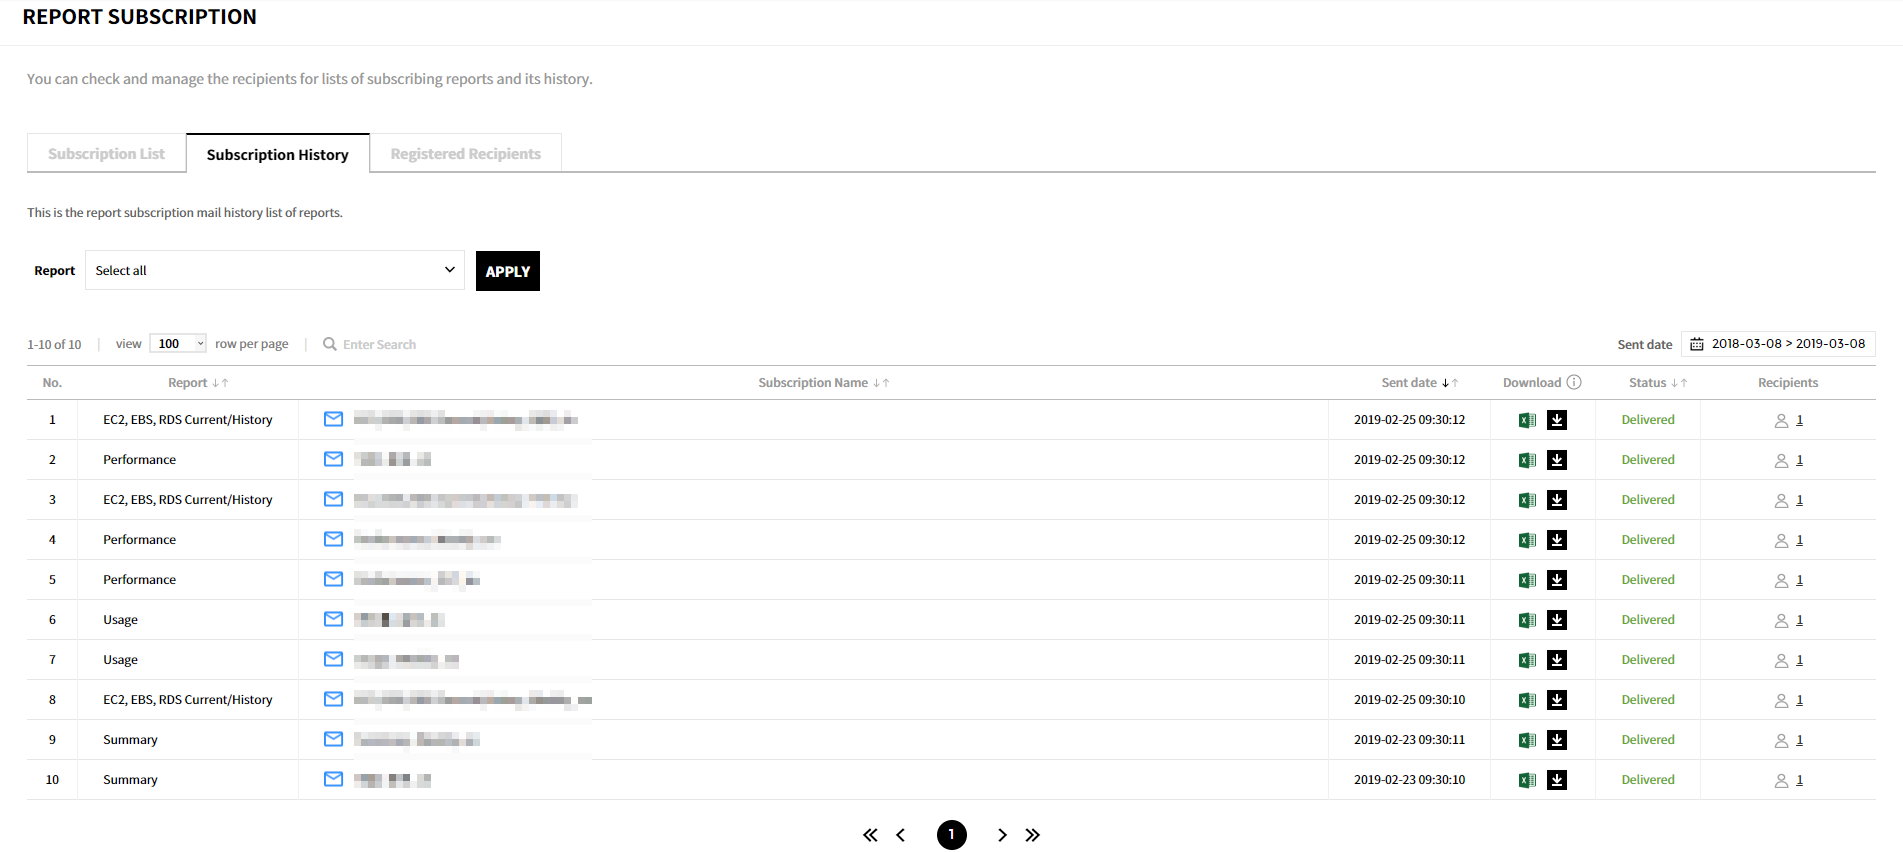
- Report: Display the report type selected when creating a subscription.
- Subscription Name: Name of subscription, default name or a name that the user entered, will be displayed.
- Date Sent: Date and time subscriptions were sent.
- Download: Download files sent for the last 30 days by clicking the download icon. Failed to send subscriptions or subscriptions sent a month ago cannot be downloaded again.
- Status: The status of subscriptions.
- Recipients: Display the number of recipients for the subscription. Click the recipient icon to see the recipient list.
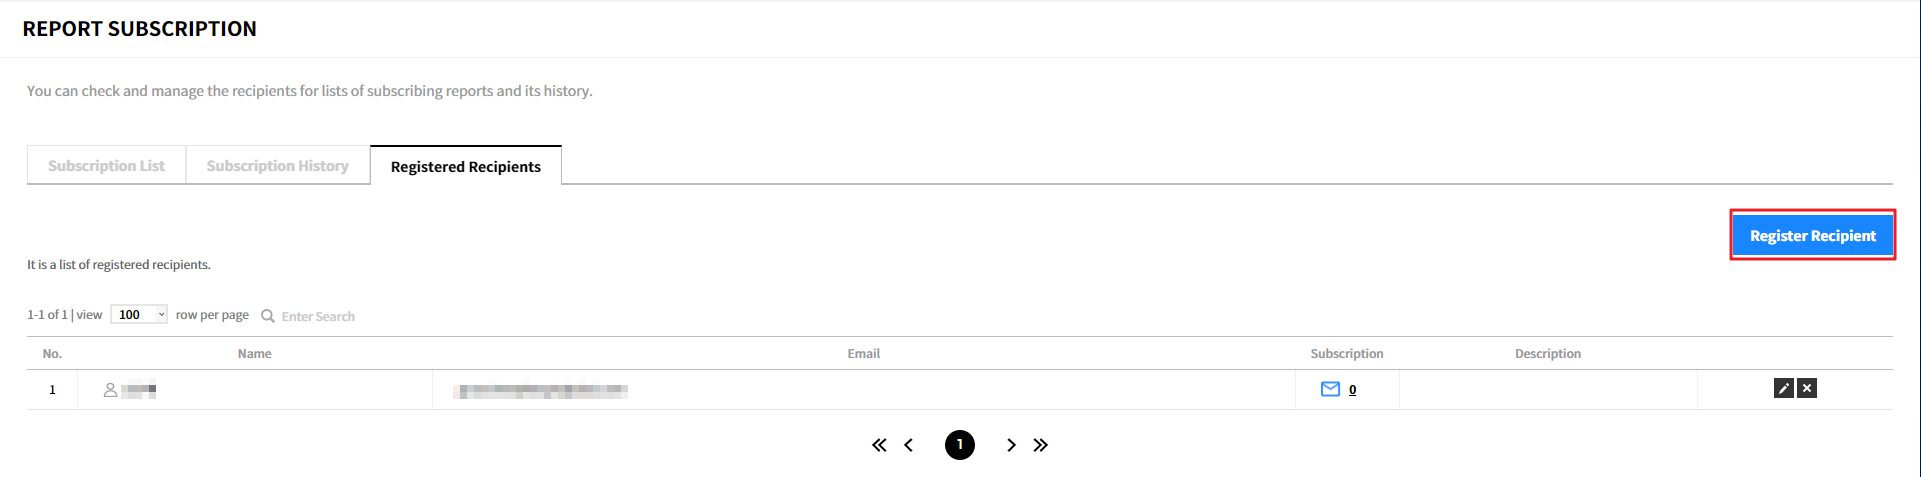
Registered Recipients
In the Registered Recipients, you can manually add recipients to subscribe reports, and edit and delete registered recipients.

- Name: Name of recipient is displayed.
- Email: The recipient’s email address is displayed.
- Subscription: The number of reports you are subscribing. Click the number to view a list of reports you are subscribing to.
- Description: The description about the subscription is displayed.
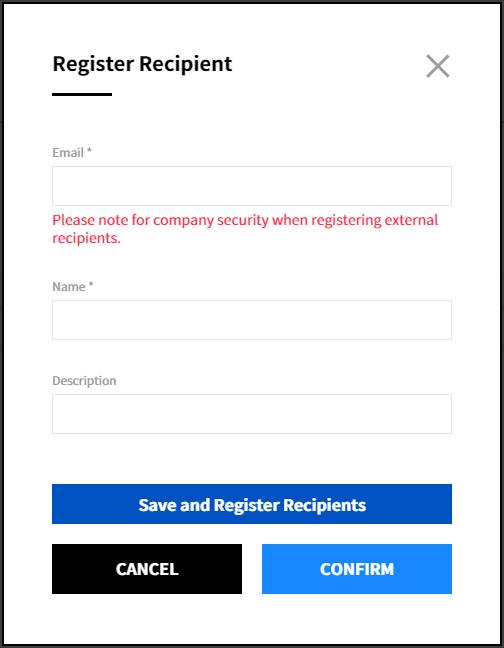
Add Recipients
① Click [Register Recipient].
② Enter the required information in the popup window and click the [Confirm] button. To register multiple recipients, click the [Save and Register Recipients] button.
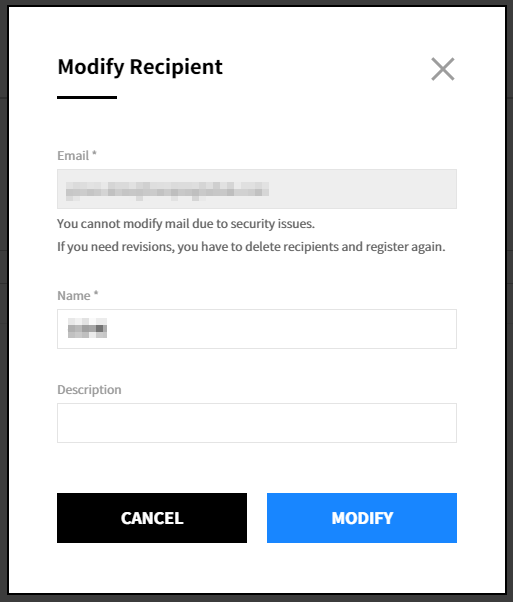
Modify Recipient
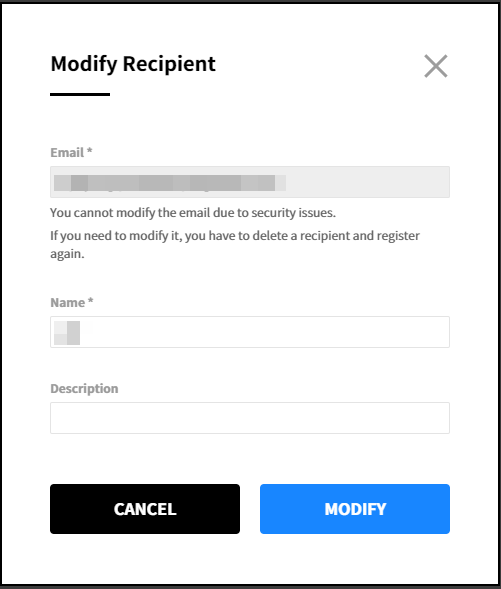
① Click the modify icon.
② Apply the changes and click the [Modify] button. You cannot modify the email address in the popup window. To modify the email address, you must delete and register the recipient again.
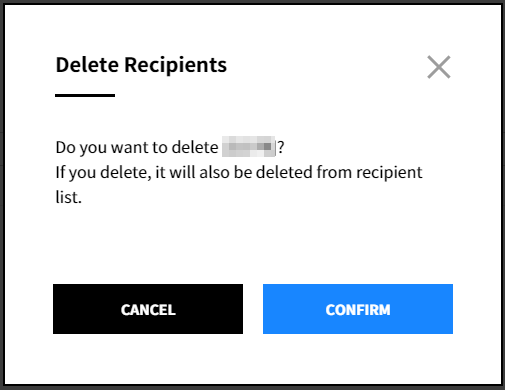
Delete Recipient
① Click the delete icon.
② Click [Confirm] to delete the recipient. When you delete the recipient, the recipient also will be deleted from the recipient list.
Resource Alert
Asset > Resource Alert
Resource Alert detects resource anomalies based on the specific rules set in advance and sends alerts immediately. Resource anomalies are directly related to the resource cost and therefore it is important to monitor the resources more closely and not miss the anomaly event. In the Resource Alert menu, you can set specific alerts by cloud service, resource, account, and region, and individual alerts are triggered depending on the data collection cycle. Manage alert settings and view alert history in one place.
Alert Settings
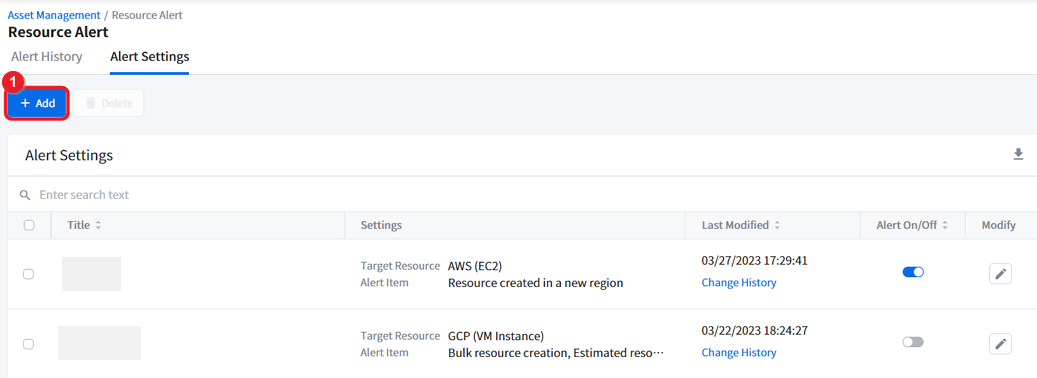
Adding Alerts
Asset > Resource Alert > Alert Settings Tab
Create or add a new alert setting to receive alerts when a resource anomaly event occurs.
① Click [+ Add] in the Alert Settings tab menu.
② When the [Add Alert] window appears from your right side, enter the Alert Title of your new alert setting and select Alert Channel to receive the alert. For example, if you select Email, you will receive a alert by email in the event of an resource anomaly, and the alert title you entered will be shown in the title of the alert email.
③ Search and add the alert recipients who will receive the alert. You can only add up to 50 recipients.
④ Select a language of your alert. Currently, Korean and English are supported.
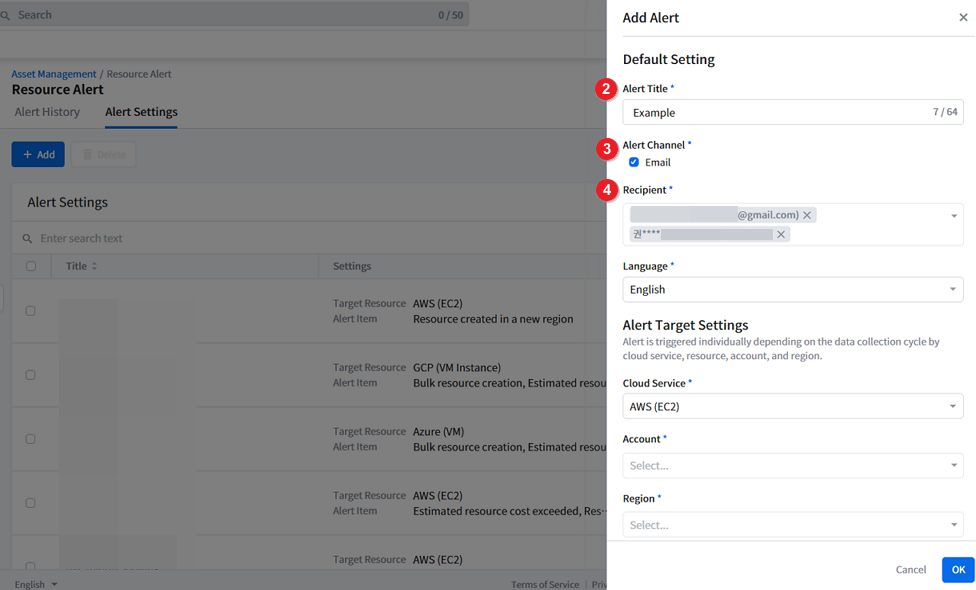
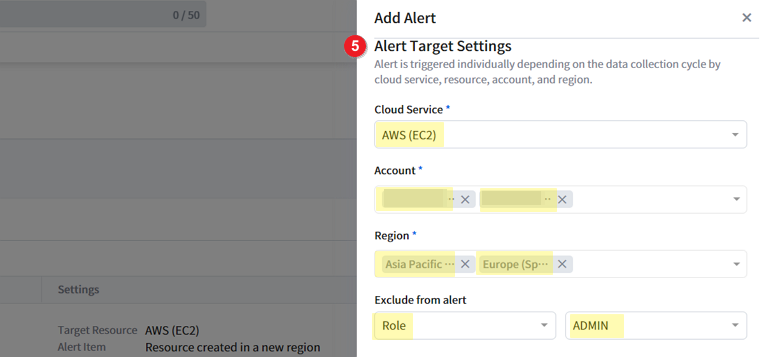
⑤ Now, let’s set the specific resource alert targets. Select the Cloud Service, Account, Region, and Tags to exclude from the alert. Currently supported cloud services and resource types are AWS EC2, Azure VM, and GCP VM Instance.
Alert is triggered and sent individually depending on the data collection cycle by cloud service, resource, account, and region. Therefore, if you have selected 2 or more accounts or regions and if the resource anomaly event is triggered in the relevant account or region, you would receive individual alerts accordingly.
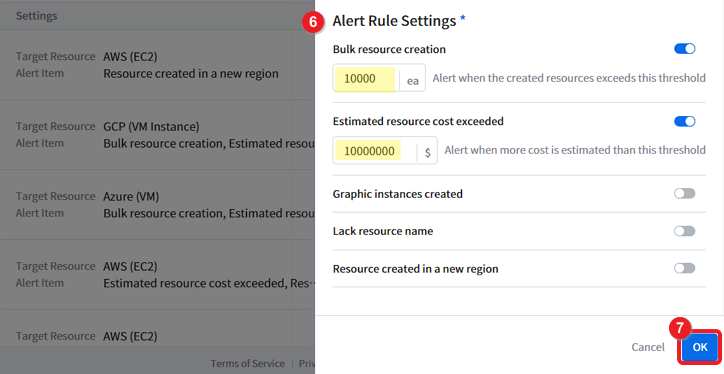
⑥ Select and turn on the toggle switch of the Alert Rule that you want to set and enter the threshold value. Supported rules by cloud service are listed below. Please note that you can only set the alert rule for a maximum of USD 100,000,000 and 10,000 resources.
| Rules | Description | Cloud Services |
|---|---|---|
| Bulk resource creation | Alert is triggered when the created resources exceed the threshold. | AWS, Azure, GCP, NCP, OCI |
| Estimated resource cost exceeded | Alert is triggered when more cost is estimated than the threshold | AWS, Azure, GCP |
| Graphic instances created | Alert is triggered when the created graphic resources exceed the threshold | AWS, Azure, GCP, NCP, OCI |
| Lack resource name | Alert is triggered when resources more than the threshold lack resource name | AWS, Azure |
| Resource created in a new region | Alert is triggered when a resource is created in a new region | AWS, GCP, NCP, OCI |
| New resource group created | Alert is triggered when a new resource group is created | Azure |
📌 Important: A resource alert is sent for the resources that are newly created over the period between the alert setting creation and the last data collection time.
For example:
⁕ When the monthly estimated resource costs of the newly created resources exceed the preset threshold, a resource alert is sent
⁕ When the newly created resource does not have a resource name, a resource alert is sent
⑦ Click [OK] to save the alert setting.
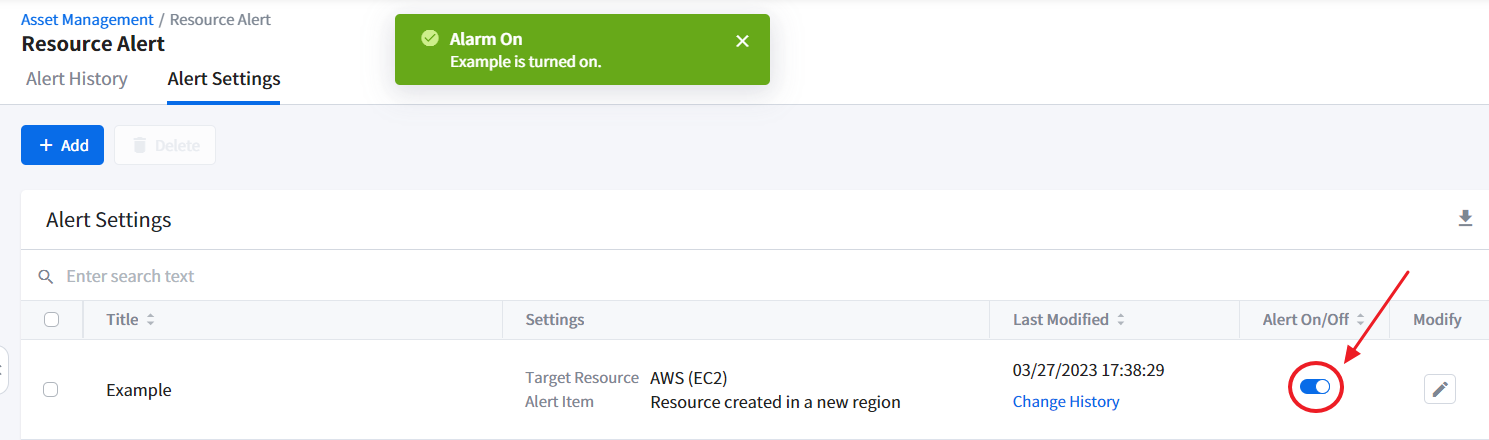
Turning On and Off Alerts
The alert setting must be turned on or activated to receive the resource alert. From the list of alert settings, click the toggle switch to turn [Alert On/Off]. When a resource anomaly event, which violated the alert setting rule, is detected, Resource Alert immediately sends the alert through the channel of your choice.
If the resource activity is detected as long as it violates the rules set, an alarm will be sent to the set alarm channel.
In case you want to temporarily deactivate the alert to stop receiving them, simply turn off the alert by switching off the [Alert On/Off] toggle switch.
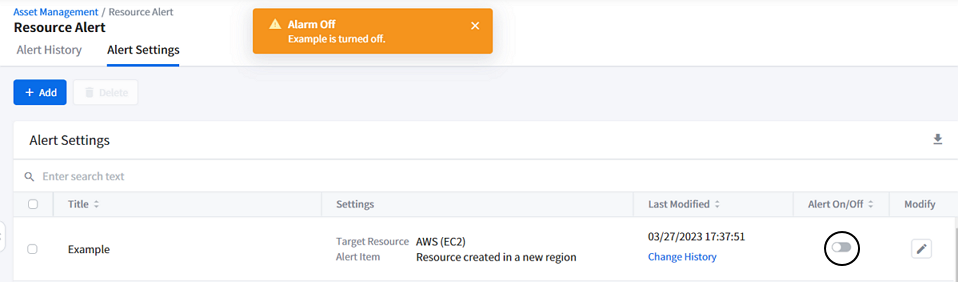
On the other hand, if you no longer need to receive the alert, delete the alert setting permanently instead of deactivating or turning it off. Please see the Deleting Alert Settings Guide for more.
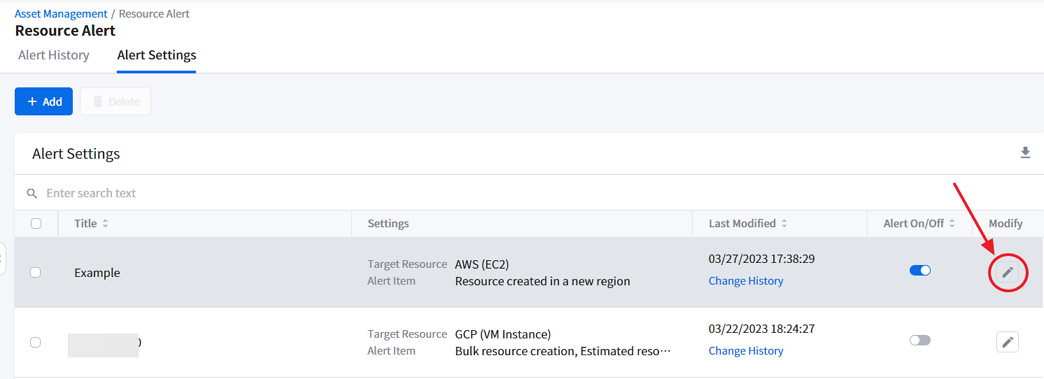
Modifying Alerts
To modify the alert setting, click the pencil icon in the Alert Settings list. Modify Alert window appears from the right. Make changes and click [OK] to save the changes.

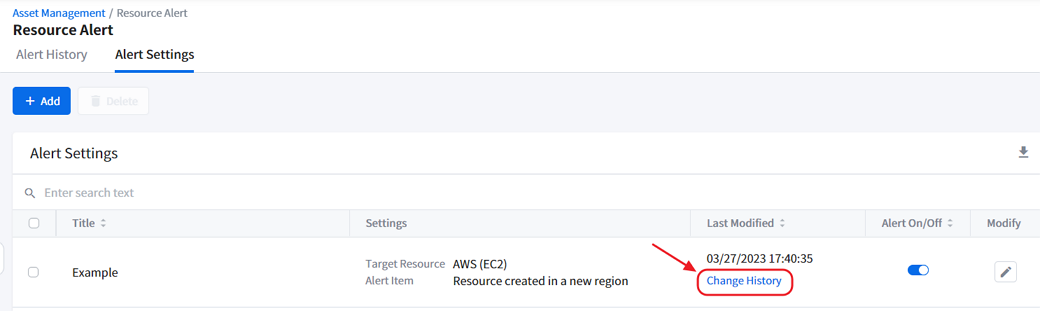
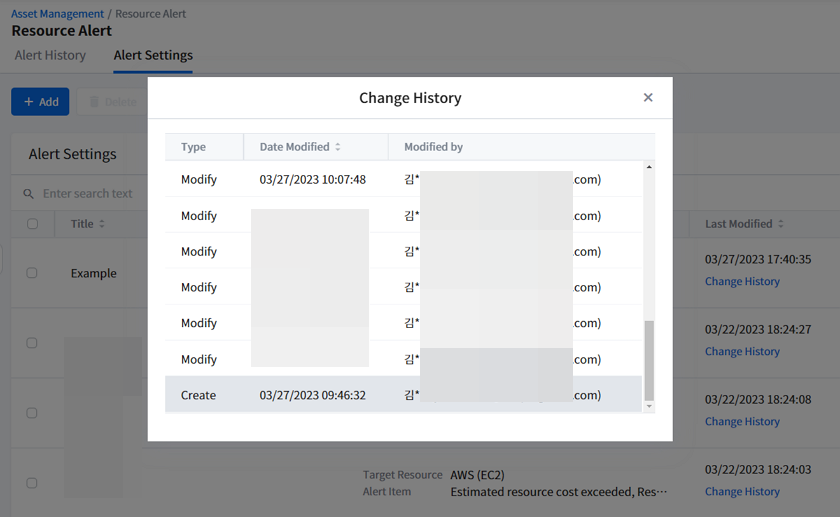
Viewing Change History
To learn more about who created the alert setting or when it was modified, click [Change History] on the Alert Settings list.
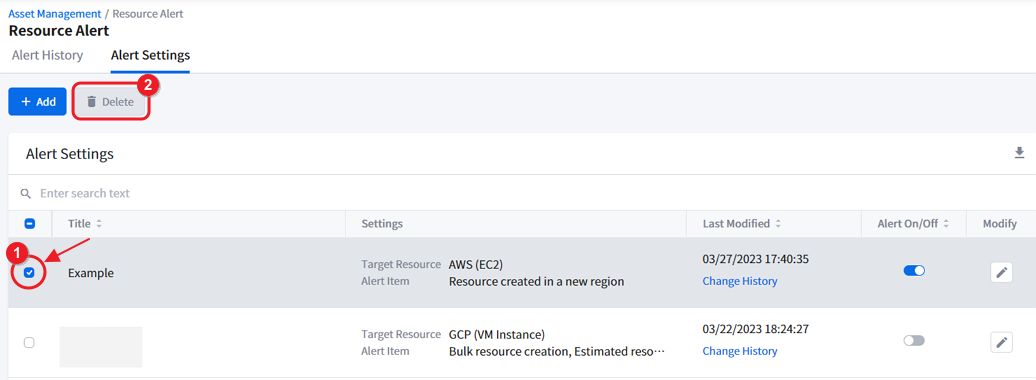
Deleting Alert Settings
① To delete the alert setting, select one and click the check box on the left of the list.
② Click [Delete], located next to the [+ Add] button.
📌 Attention: Once you delete the alert setting, it cannot be restored. Please review carefully when deleting.
⚠️ Attention: If you delete an alert from the Alert Settings list, the related information will be deleted also on the Alert History list.
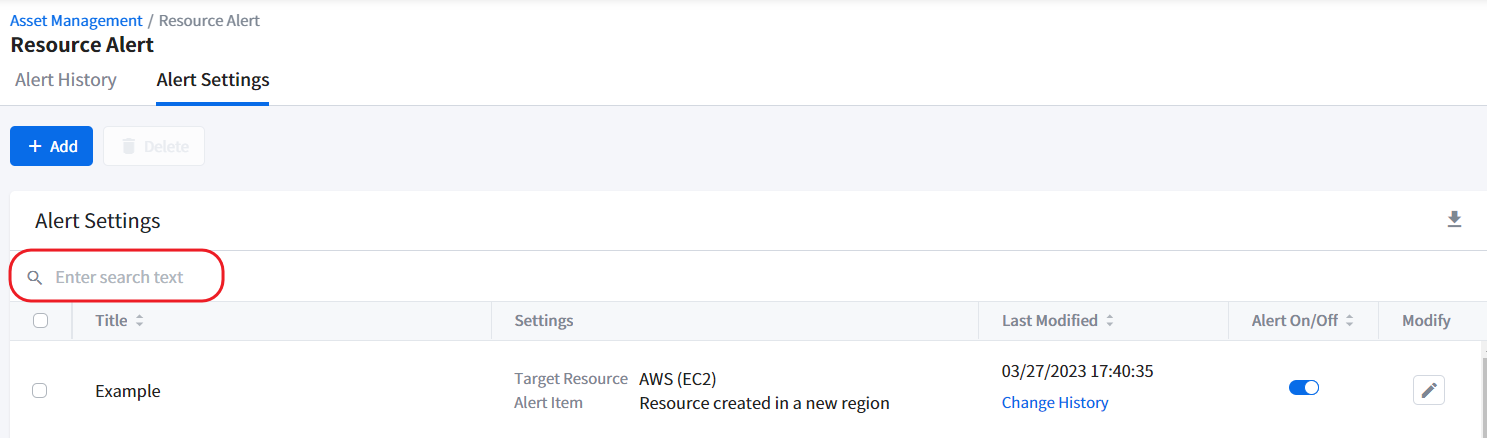
Searching Alert Settings
Use the Search feature to quickly find the alert setting you want. You can search for the alert setting’s Alert Title, Cloud Service, Resource Type, and/or Alert Rules.
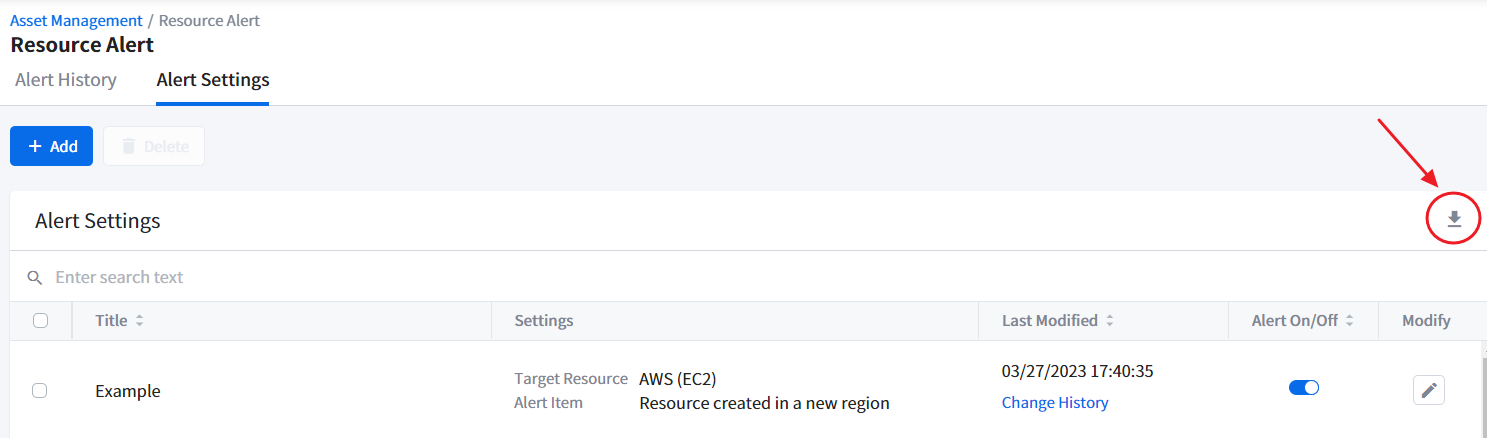
Downloading Alert Settings Data
If you want to share the alert settings data or archive it, you can download the data in Excel (.xlsx) by clicking the Download icon.
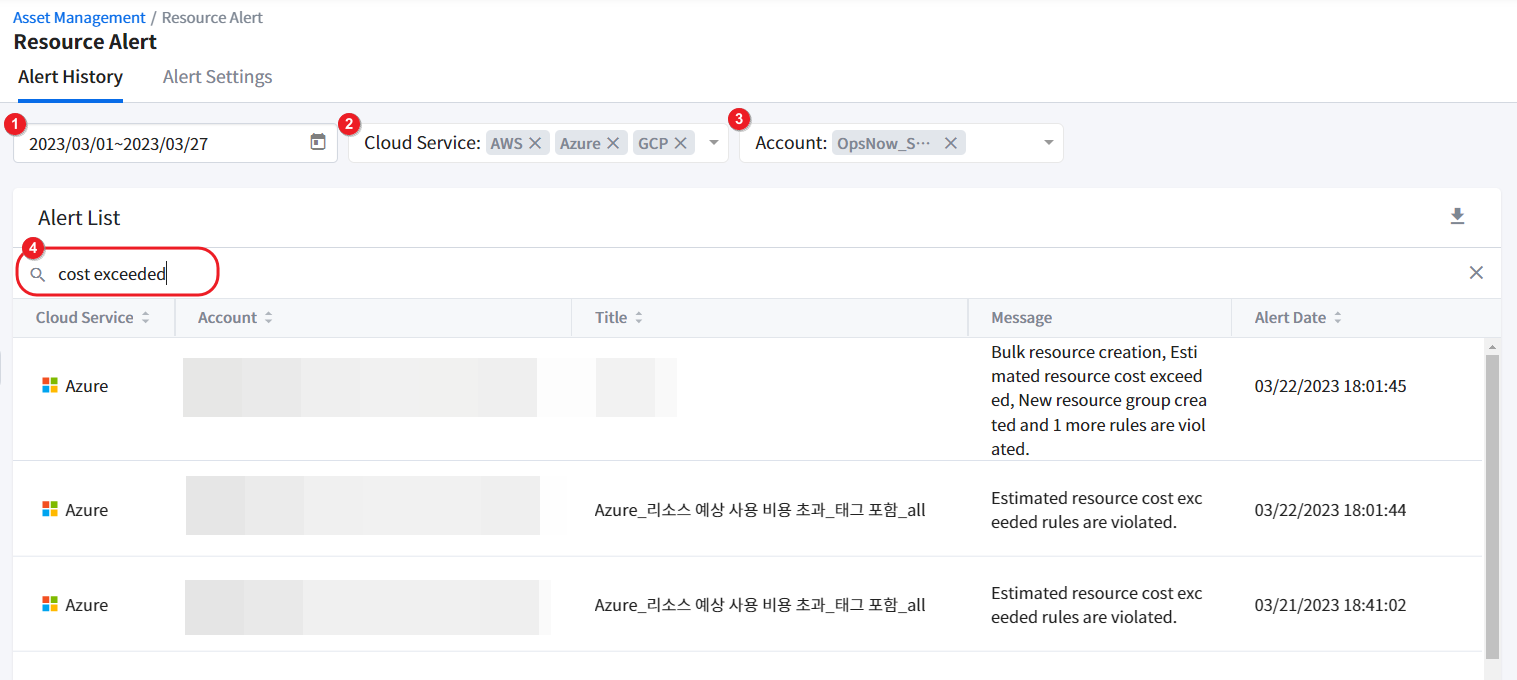
Alert History
Asset > Resource Alert > Alert History Tab
When a resource anomaly is detected and an alert is triggered, as you set in Alert Settings, the triggered alerts are listed on the Alert History page. You can apply multi-filters on this page to refine the alerts.
① Select a date range to query the alerts.
② Select one or more cloud services.
③ Select one or more accounts.
④ If you get too many search results or cannot find the data you want, enter search text in the search bar to get more specific search results.
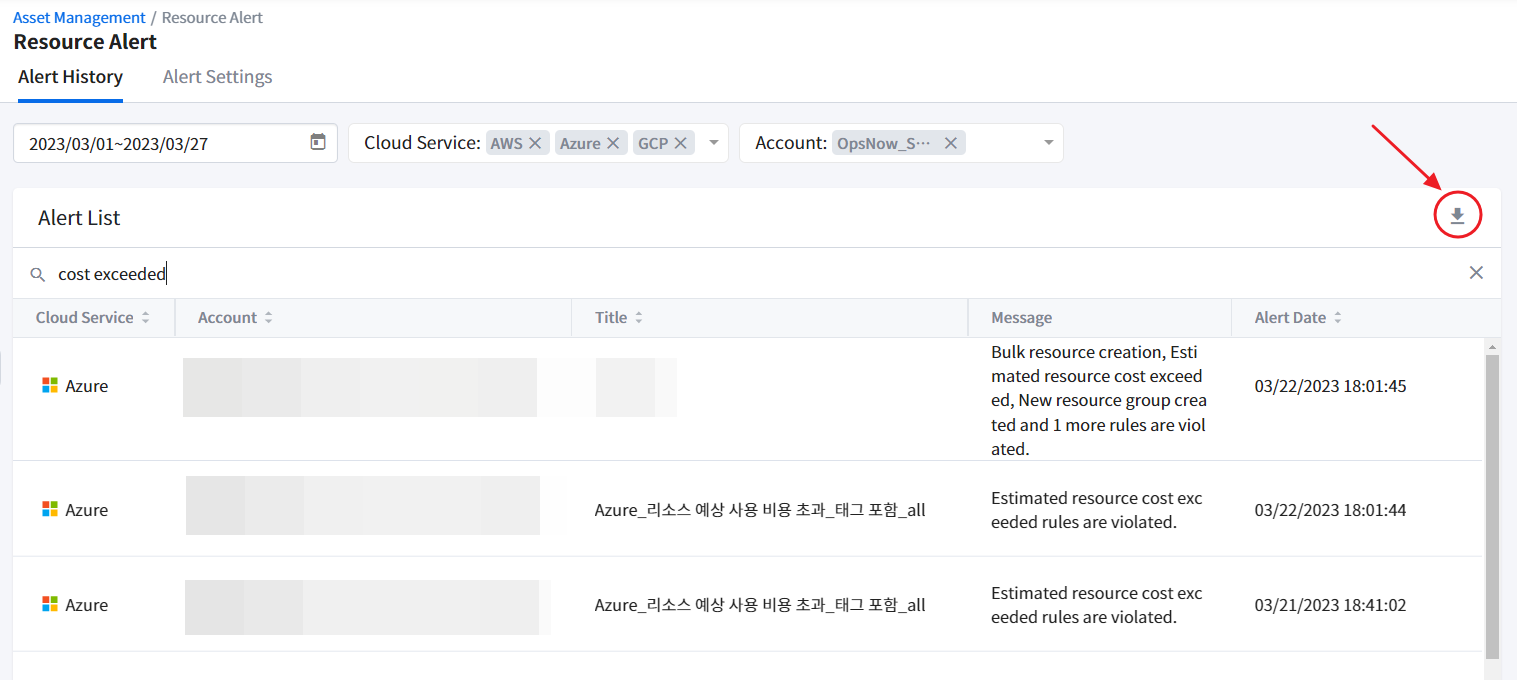
Downloading Alert History Data
If you want to share the alert history data or archive it, you can download the data in Excel (.xlsx) by clicking the Download icon.
Resource Scheduler
Asset Managetment > Resource Scheduler
With Resource Scheduler, you can schedule instances to start or stop automatically whenever you want. Only run the resources when you are actually using them and save cloud costs dramatically by turning off the unused resources. Resource Scheduler starts and stops resources based on AWS resource tags or GCP resource labels.
🔔 Notification: Depending on your country or region, this feature may not be available.
Required Permission to Use Resource Scheduler
You need to grant Start Instances and Stop Instances permissions to the System to use the Resource Scheduler.
AWS Permissions
To set AWS permissions, you must add permissions directly to AWS CloudFormation.
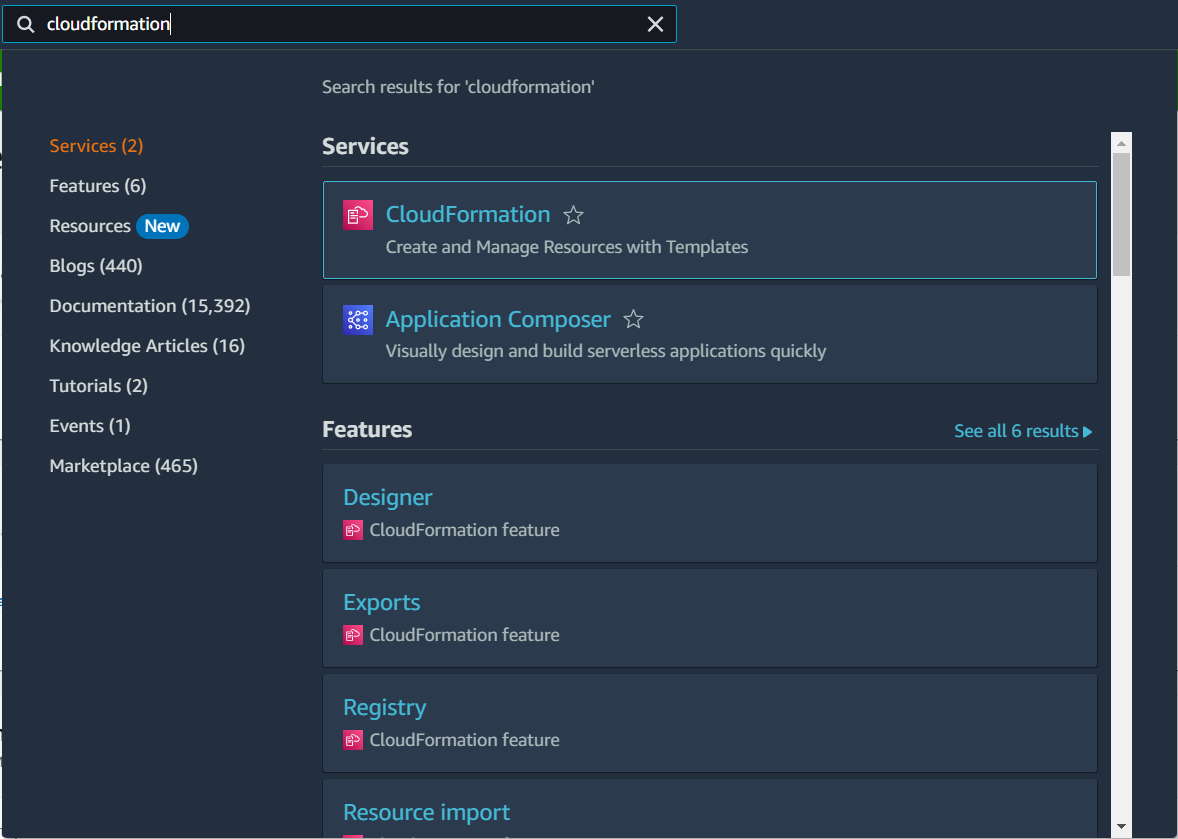
Setting permissions to an already registered account
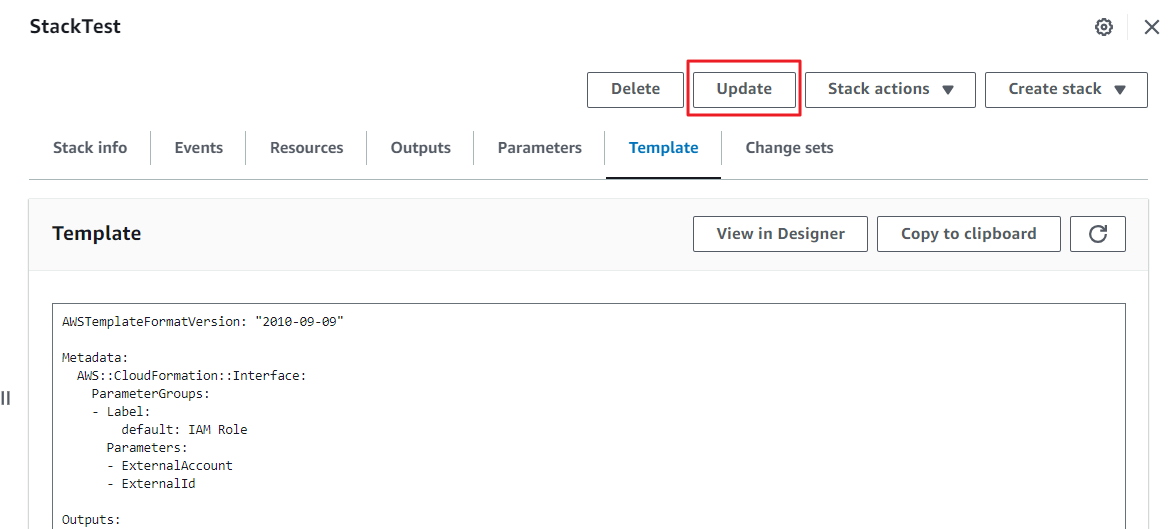
① Access the AWS console and select the CloudFormation service.
② Click the name of the stack you created while registering your accounts to OpsNow.
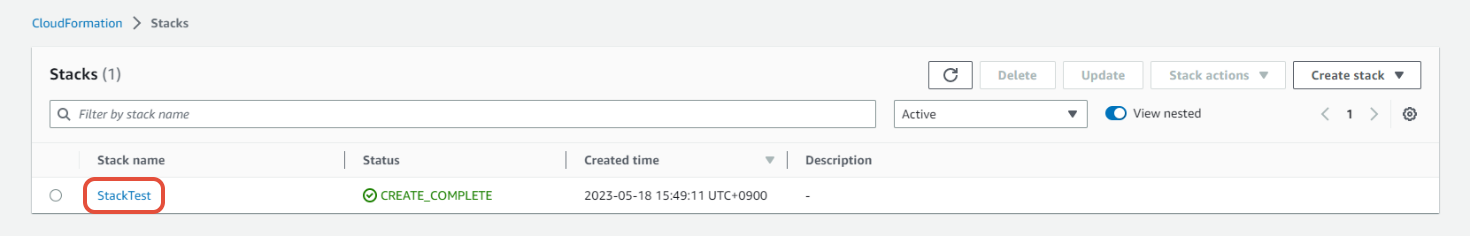
③ After clicking the Template tab, click the [Update] button.
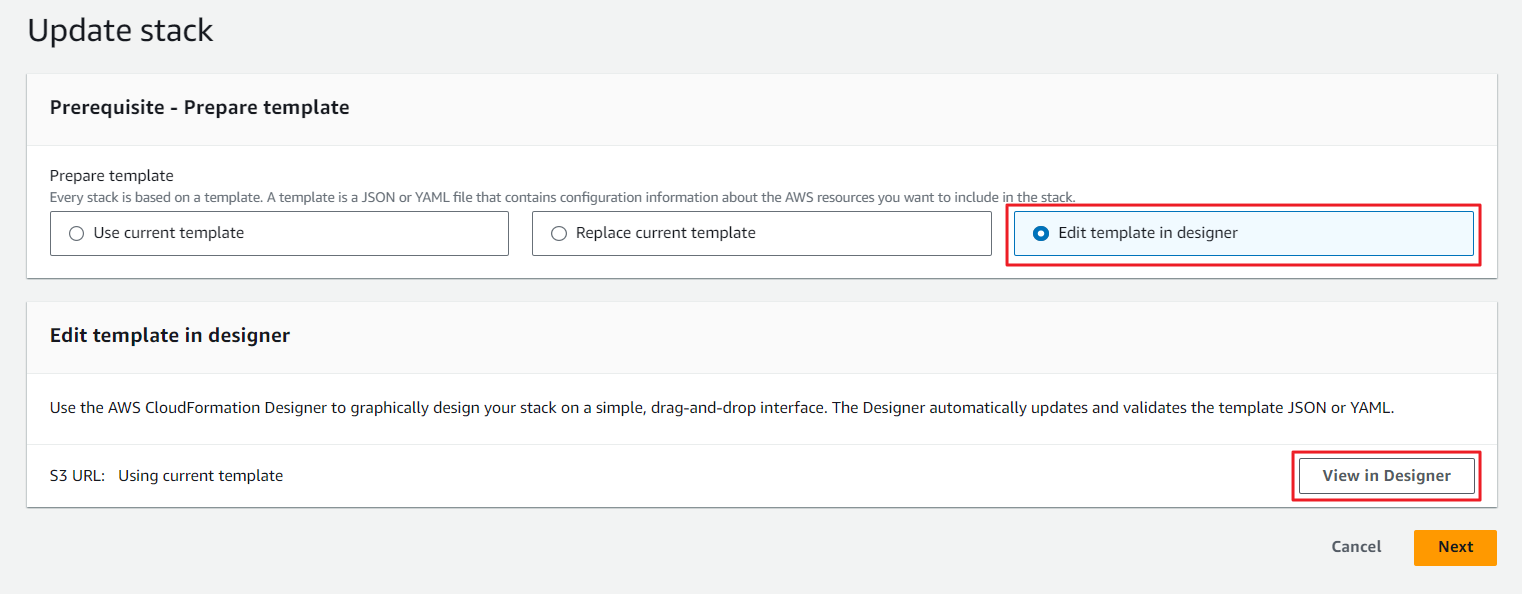
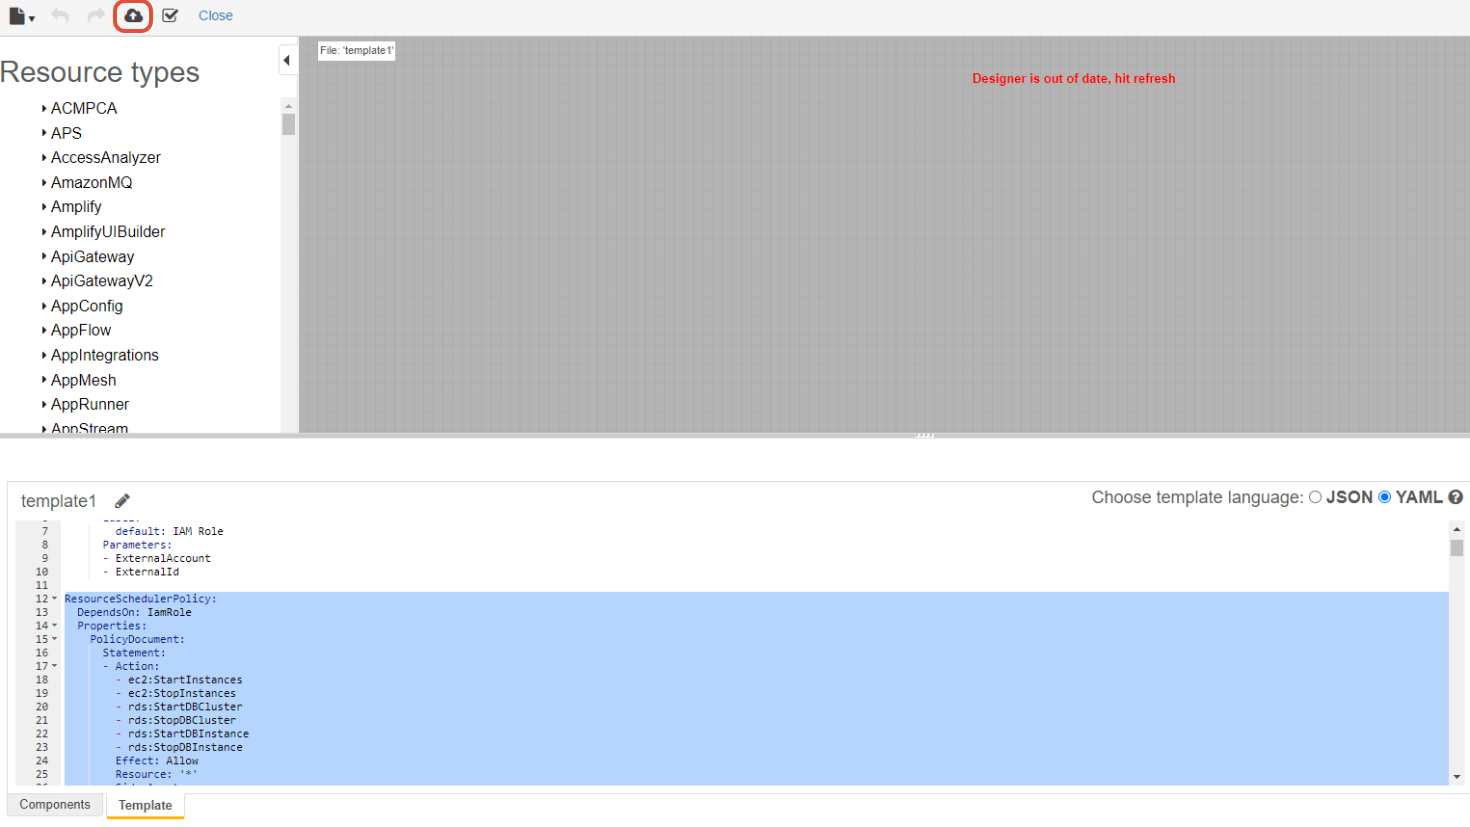
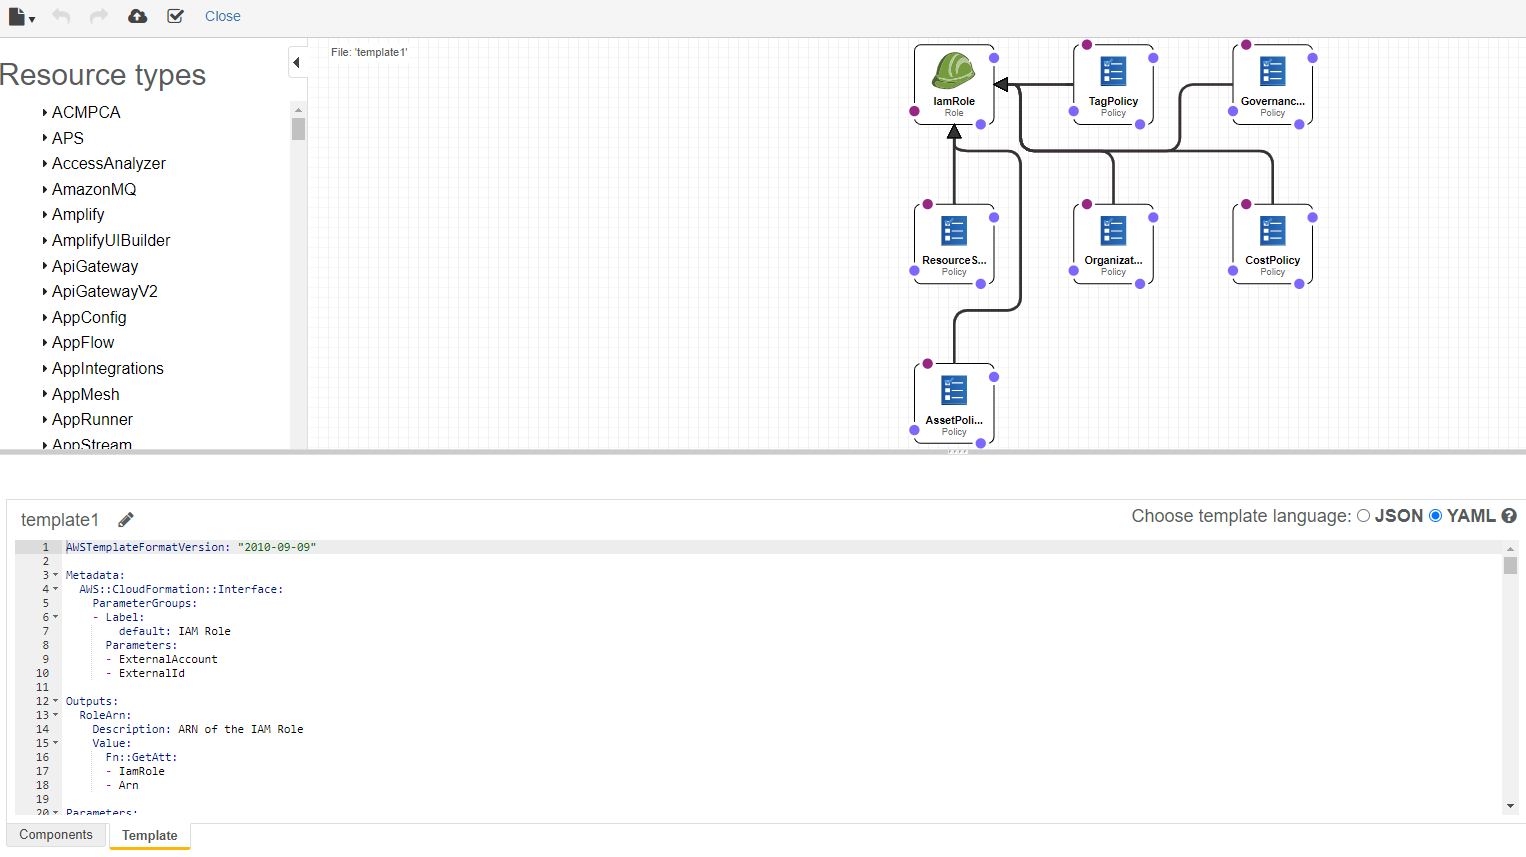
④ On the Update Stack screen, select Edit template in designer, and then click the [View in Designer] button.
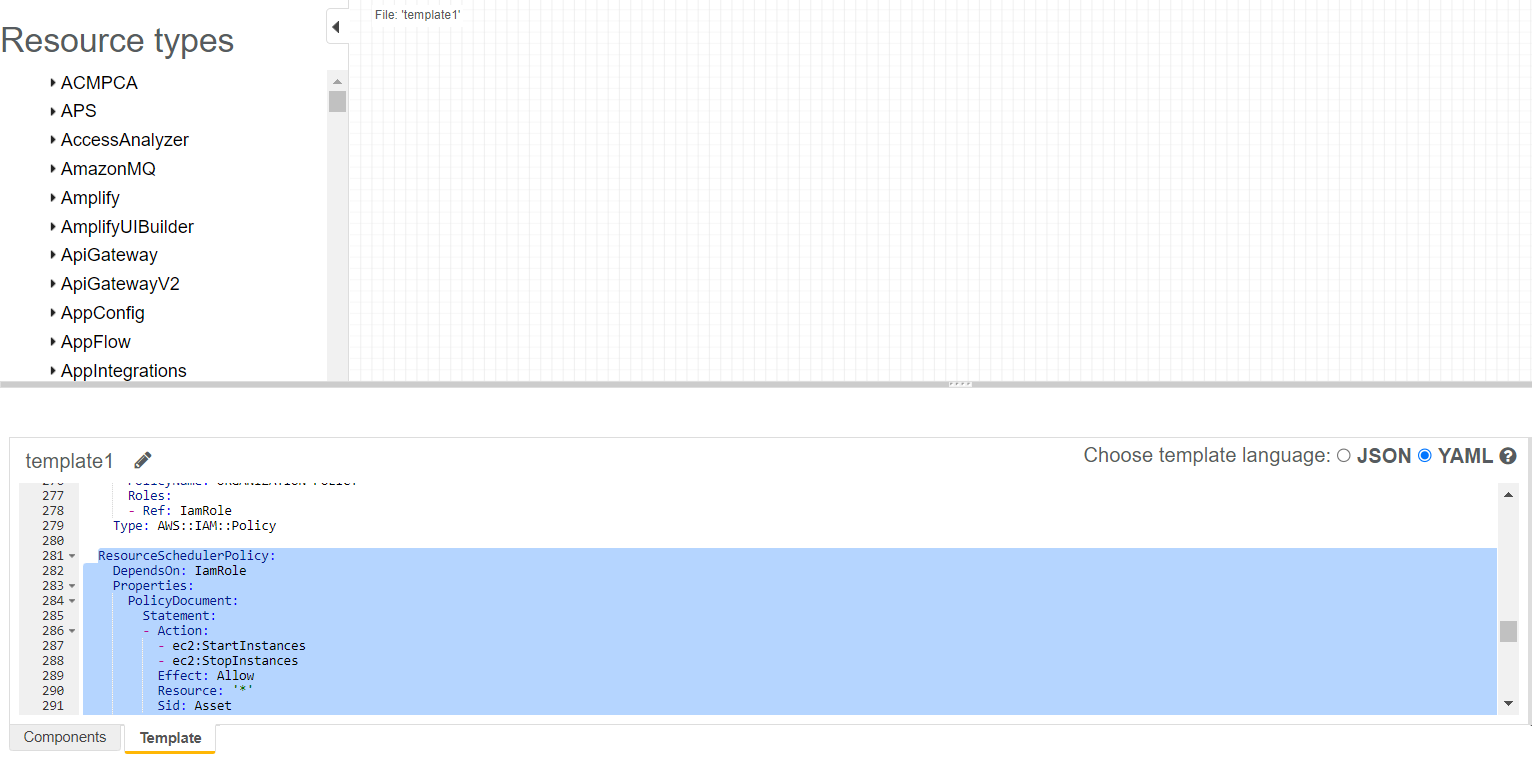
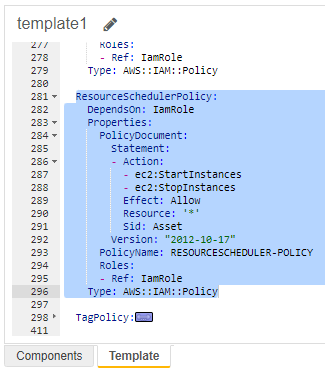
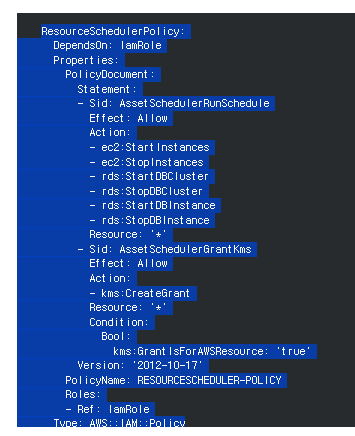
⑤ In the template editing screen, replace the existing ResourceSchedulerPolicy block with the following yaml code.
📜 Note
You can convert the yaml code to json on the website below.
https://onlineyamltools.com/convert-yaml-to-json
                    ResourceSchedulerPolicy:
                      DependsOn: IamRole
                      Properties:
                        PolicyDocument:
                          Statement:
                          - Sid: AssetSchedulerRunSchedule
                            Effect: Allow
                            Action:
                            - ec2:StartInstances
                            - ec2:StopInstances
                            - rds:StartDBCluster
                            - rds:StopDBCluster
                            - rds:StartDBInstance
                            - rds:StopDBInstance
                            Resource: '*'
                          - Sid: AssetSchedulerGrantKms
                            Effect: Allow
                            Action:
                            - kms:CreateGrant
                            Resource: '*'
                            Condition:
                              Bool:
                                kms:GrantIsForAWSResource: 'true'
                          Version: '2012-10-17'
                        PolicyName: RESOURCESCHEDULER-POLICY
                        Roles:
                        - Ref: IamRole
                      Type: AWS::IAM::Policy
If you are using a customer-managed KMS and have customized the key policy instead of using the default key policy, please paste the following YAML code below to explicitly grant additional permissions for that key.
                    ResourceSchedulerPolicy:
                      DependsOn: IamRole
                      Properties:
                        PolicyDocument:
                          Statement:
                          - Sid: AssetSchedulerRunSchedule
                            Effect: Allow
                            Action:
                            - ec2:StartInstances
                            - ec2:StopInstances
                            - rds:StartDBCluster
                            - rds:StopDBCluster
                            - rds:StartDBInstance
                            - rds:StopDBInstance
                            Resource: '*'
                          - Sid: AssetSchedulerGrantKms
                            Effect: Allow
                            Action:
                            - kms:CreateGrant
                            Resource: '*'
                            Condition:
                              Bool:
                                kms:GrantIsForAWSResource: 'true'
                          - Sid: AssetSchedulerCustomerKMS
                            Effect: Allow
                            Action:
                            - kms:Encrypt
                            - kms:Decrypt
                            - kms:ReEncrypt*
                            - kms:GenerateDataKey*
                            - kms:DescribeKey
                            Resource: '*'
                          Version: '2012-10-17'
                        PolicyName: RESOURCESCHEDULER-POLICY
                        Roles:
                        - Ref: IamRole
                      Type: AWS::IAM::Policy
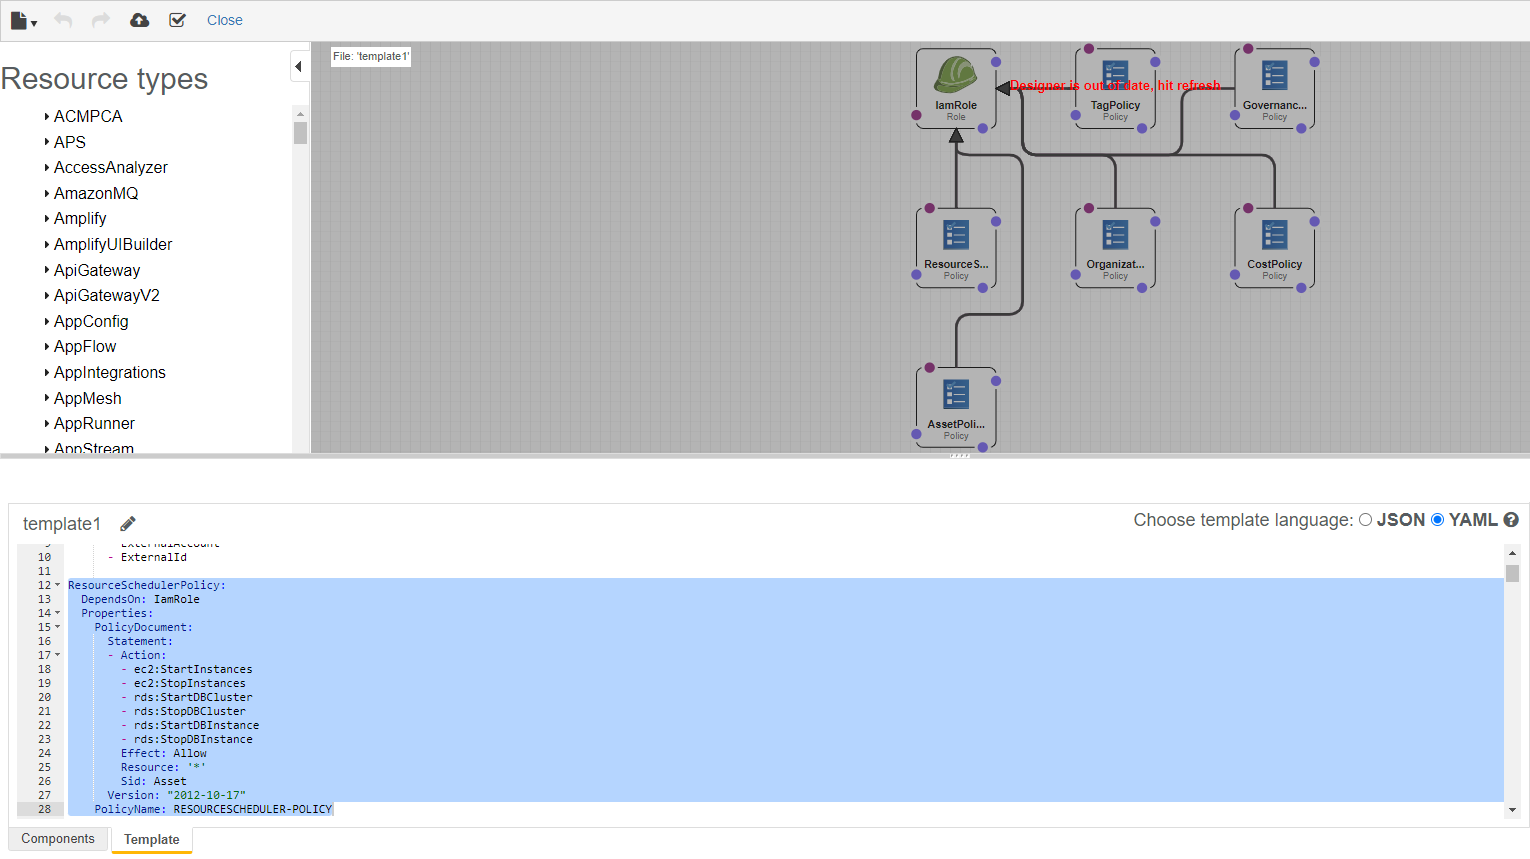
⚠️ Attention
When copying the yaml code and pasting it into the template, make sure to precisely drag to select the copying area and the pasting area as shown in the image below.
⑥ Click the Create stack button in the upper left corner of the screen to save the template.
Setting permissions during account registration
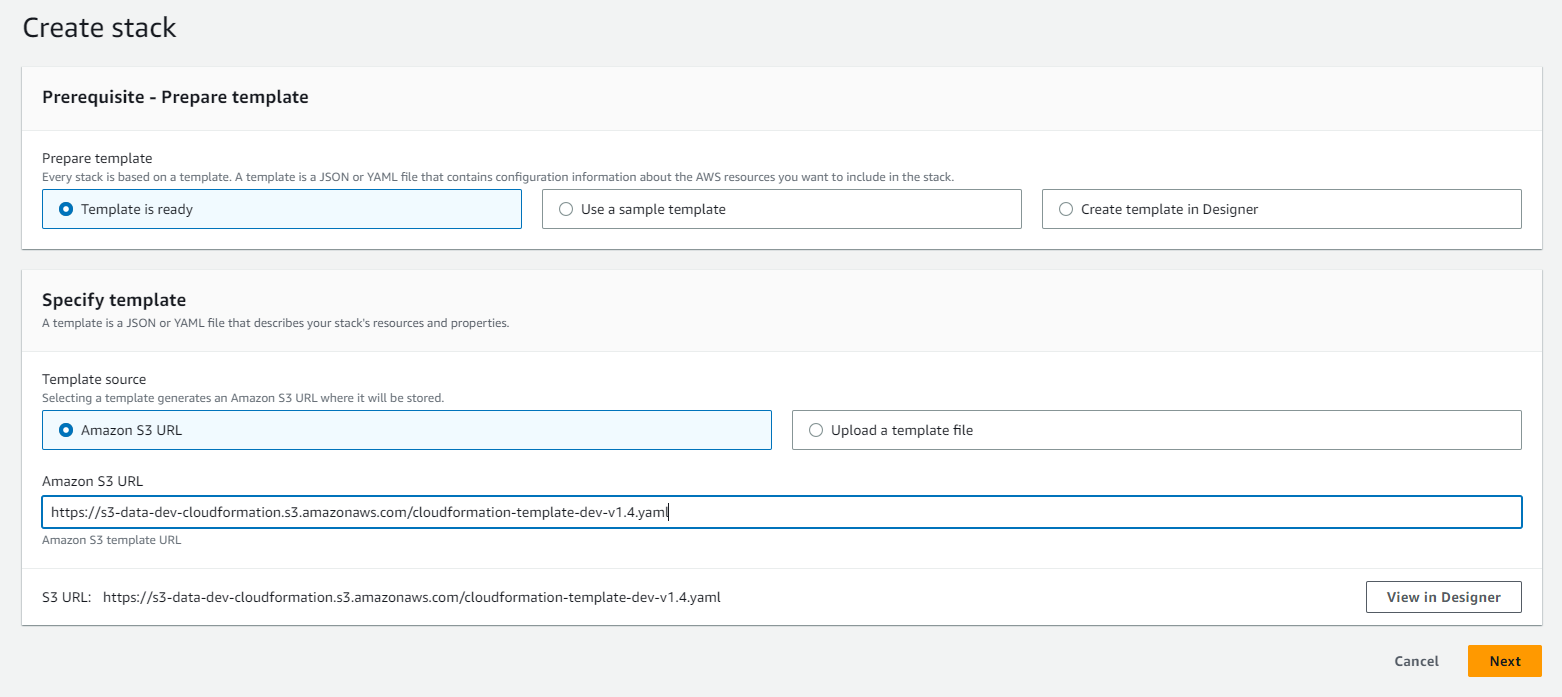
① Register an account in OpsNow Step 3: In Enter template specification information, copy and paste the template URL in Amazon S3 URL.
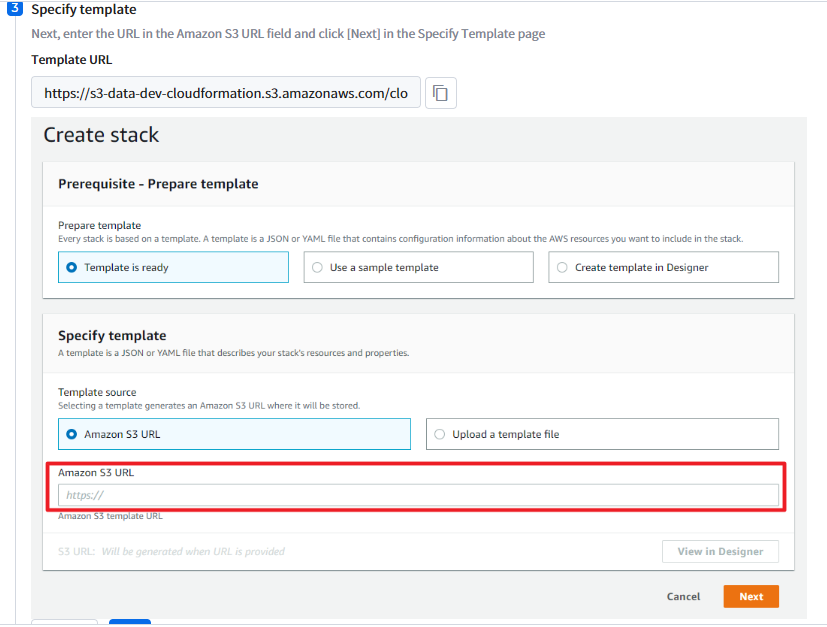
② Click the [View in Designer] button, which is activated when you paste the URL.
③ On the Edit Template screen, paste the YAML code below into the template.
📜 Note
You can convert the yaml code to json on the website below.
https://onlineyamltools.com/convert-yaml-to-json
                    ResourceSchedulerPolicy:
                      DependsOn: IamRole
                      Properties:
                        PolicyDocument:
                          Statement:
                          - Sid: AssetSchedulerRunSchedule
                            Effect: Allow
                            Action:
                            - ec2:StartInstances
                            - ec2:StopInstances
                            - rds:StartDBCluster
                            - rds:StopDBCluster
                            - rds:StartDBInstance
                            - rds:StopDBInstance
                            Resource: '*'
                          - Sid: AssetSchedulerGrantKms
                            Effect: Allow
                            Action:
                            - kms:CreateGrant
                            Resource: '*'
                            Condition:
                              Bool:
                                kms:GrantIsForAWSResource: 'true'
                          Version: '2012-10-17'
                        PolicyName: RESOURCESCHEDULER-POLICY
                        Roles:
                        - Ref: IamRole
                      Type: AWS::IAM::Policy
If you are using a customer-managed KMS and have customized the key policy instead of using the default key policy, please paste the following YAML code below to explicitly grant additional permissions for that key.
                    ResourceSchedulerPolicy:
                      DependsOn: IamRole
                      Properties:
                        PolicyDocument:
                          Statement:
                          - Sid: AssetSchedulerRunSchedule
                            Effect: Allow
                            Action:
                            - ec2:StartInstances
                            - ec2:StopInstances
                            - rds:StartDBCluster
                            - rds:StopDBCluster
                            - rds:StartDBInstance
                            - rds:StopDBInstance
                            Resource: '*'
                          - Sid: AssetSchedulerGrantKms
                            Effect: Allow
                            Action:
                            - kms:CreateGrant
                            Resource: '*'
                            Condition:
                              Bool:
                                kms:GrantIsForAWSResource: 'true'
                          - Sid: AssetSchedulerCustomerKMS
                            Effect: Allow
                            Action:
                            - kms:Encrypt
                            - kms:Decrypt
                            - kms:ReEncrypt*
                            - kms:GenerateDataKey*
                            - kms:DescribeKey
                            Resource: '*'
                          Version: '2012-10-17'
                        PolicyName: RESOURCESCHEDULER-POLICY
                        Roles:
                        - Ref: IamRole
                      Type: AWS::IAM::Policy
④ Click the Create stack button in the upper left corner.
⑤ Return to the OpsNow account registration screen and finish registering your account, which will set your resource scheduler permissions.
Azure Permissions
To use the Resource Scheduler feature, the account user must grant the system permission to start and stop instances. To set Microsoft Azure permissions, you must first add a custom role and then set the created custom role to your app to grant permissions.
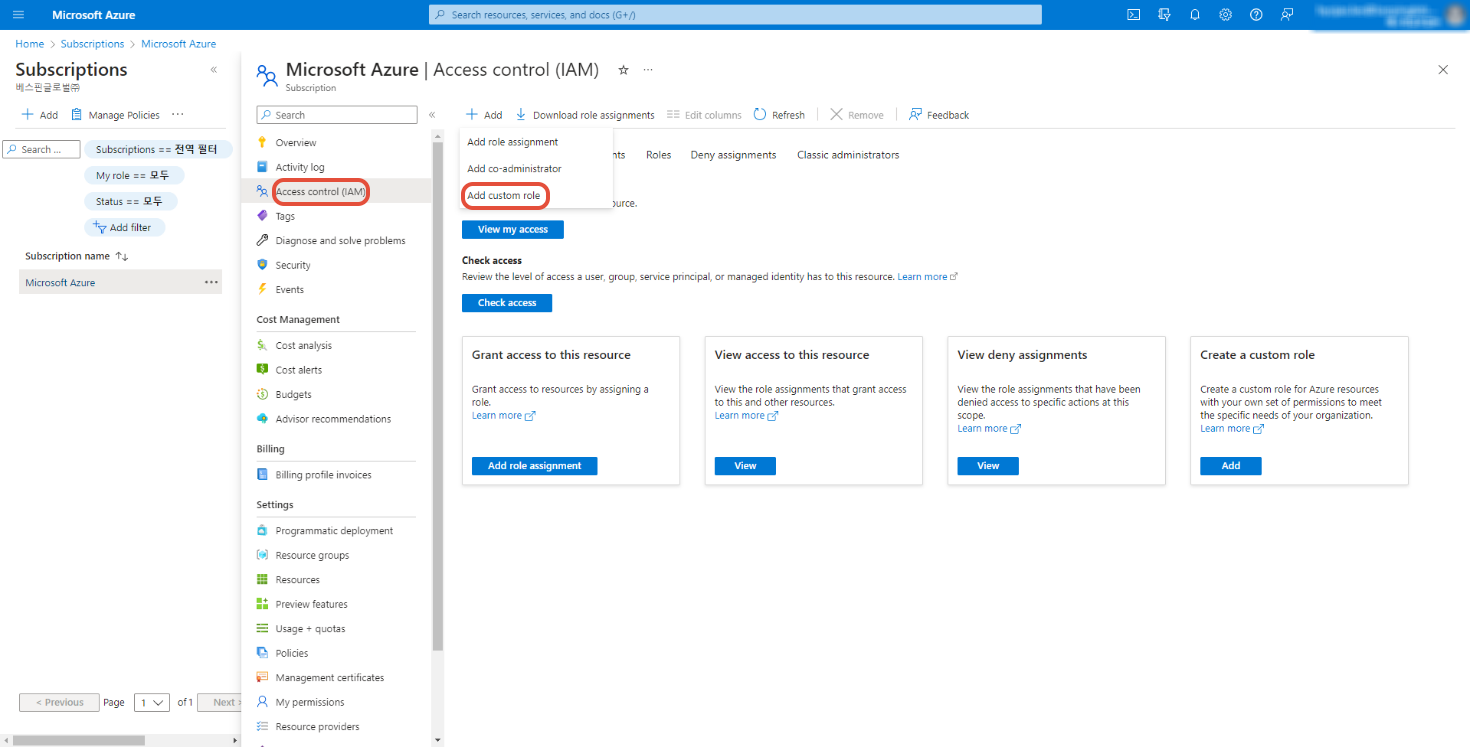
① Access the Azure Portal and click Subscriptions.
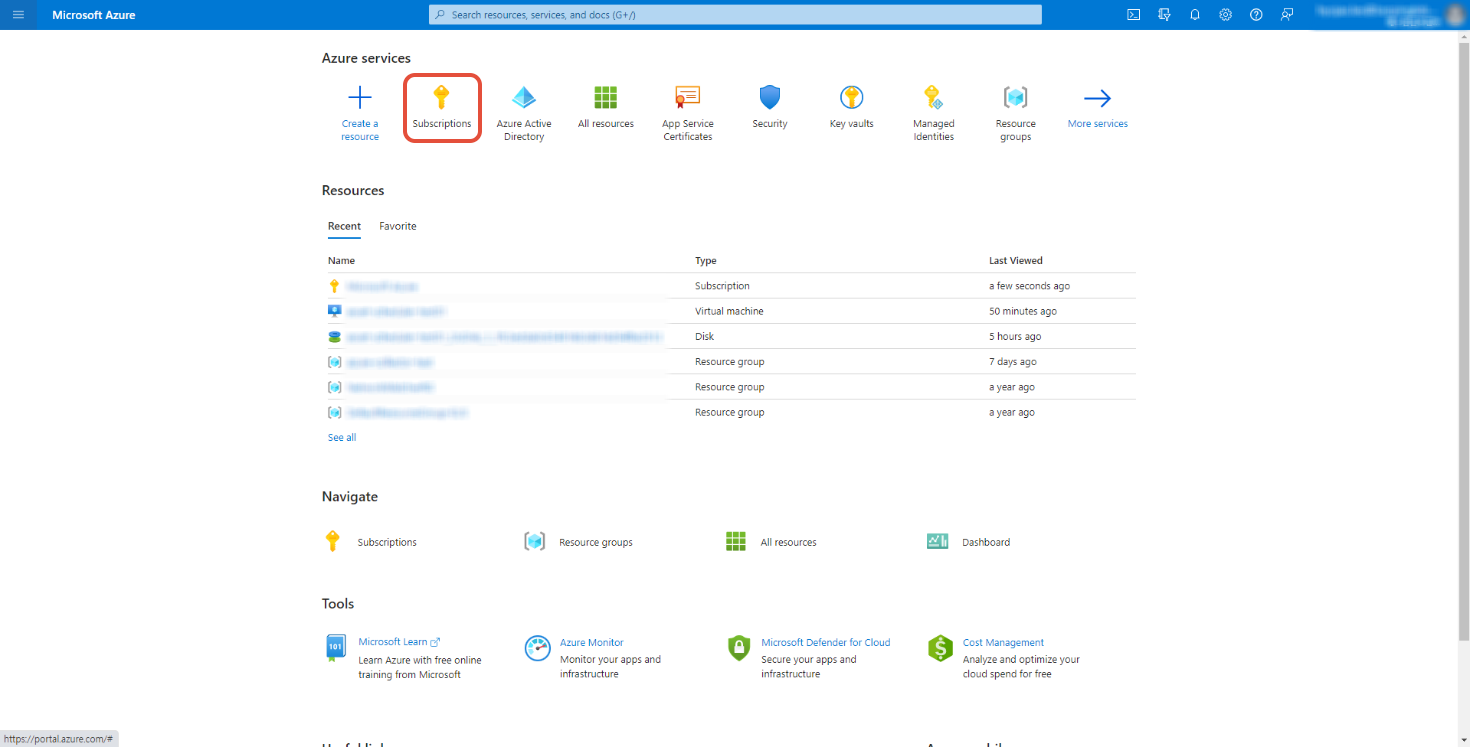
② Click the subscription name.
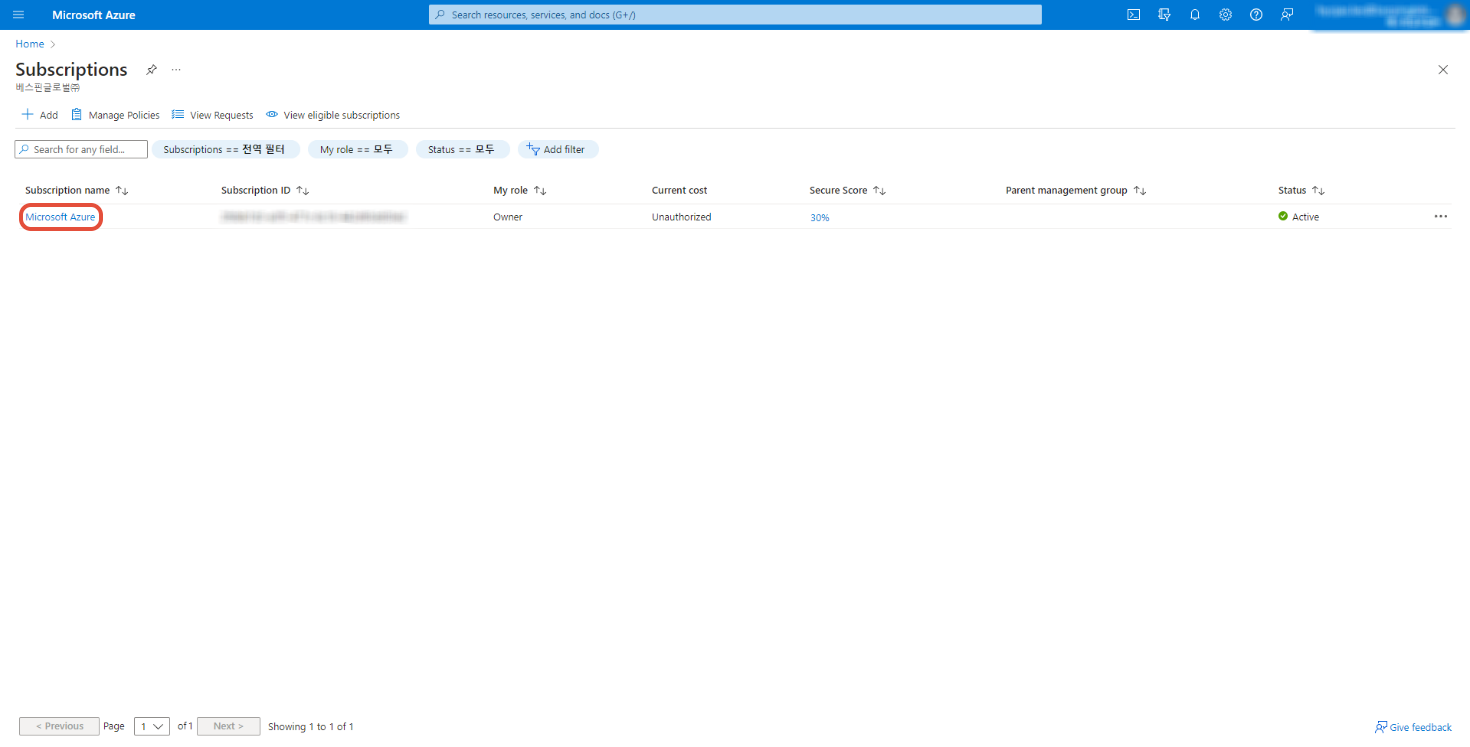
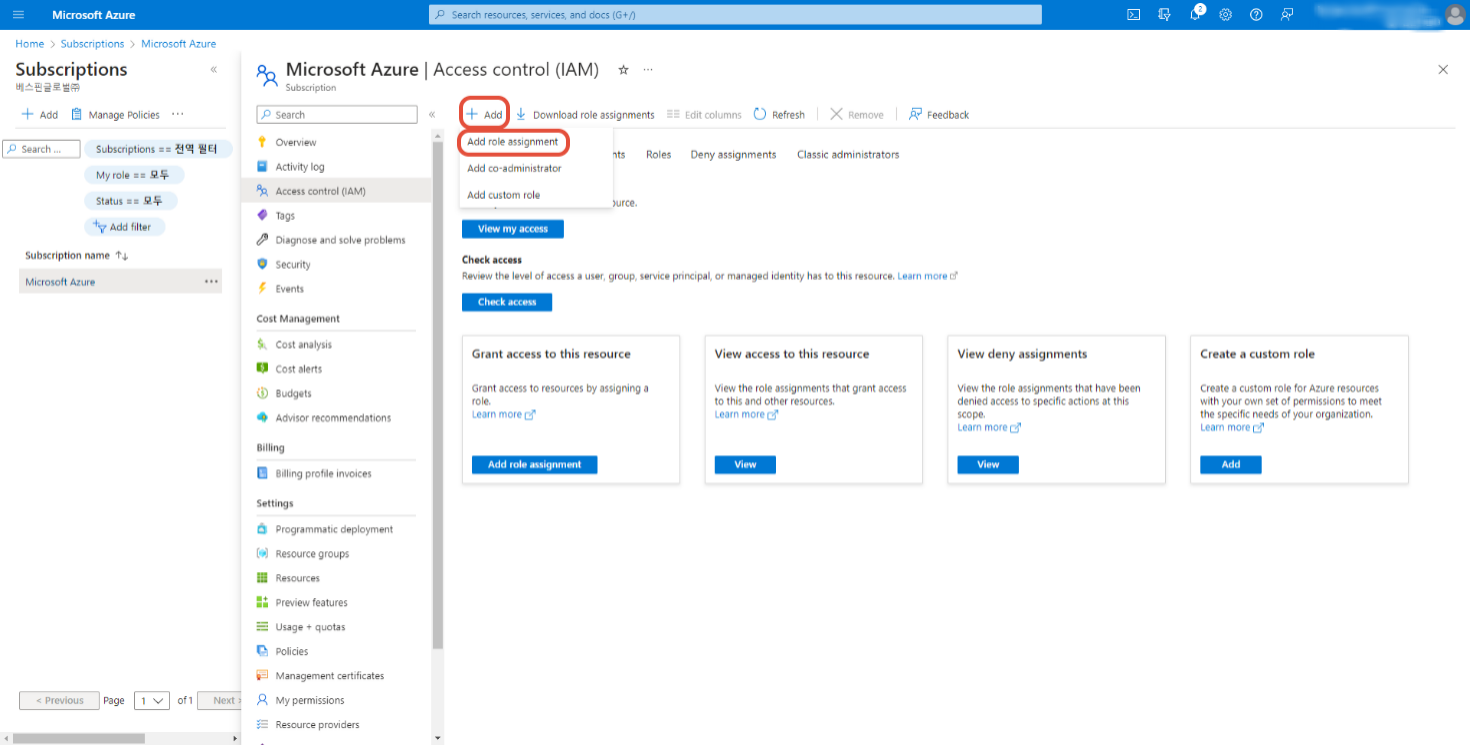
③ Click Access control (IAM) in the left menu, then click the +Add button in the top left corner to select Add custom role.
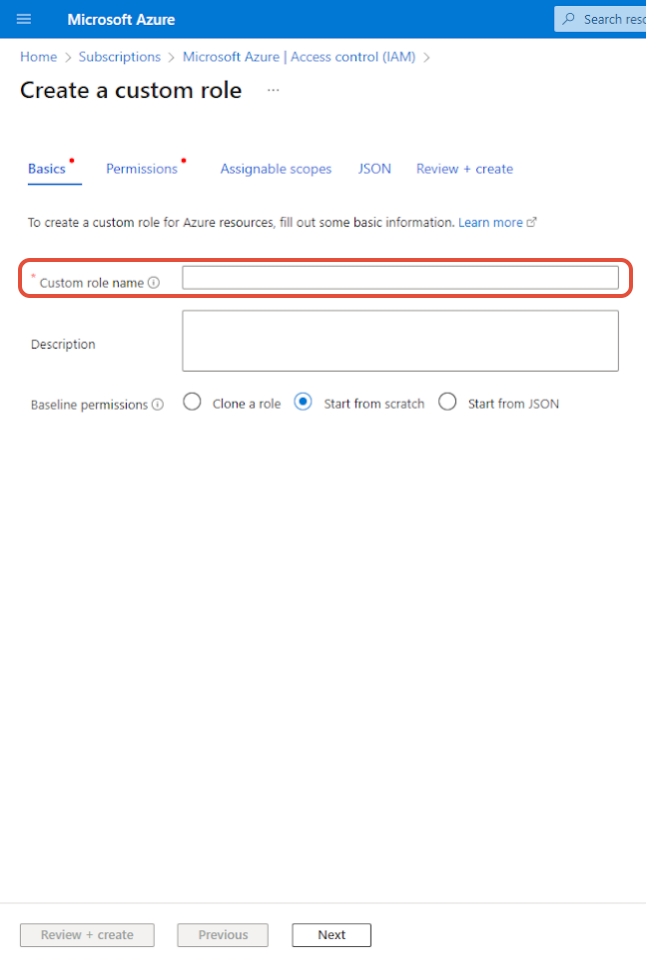
④ Enter a custom role name, and leave the baseline permissions at the default value of Start from scratch.
⑤ On the JSON tab, click the [Edit] button in the upper right corner and copy and paste the code below into the following part ("actions" : [Paste code here]).
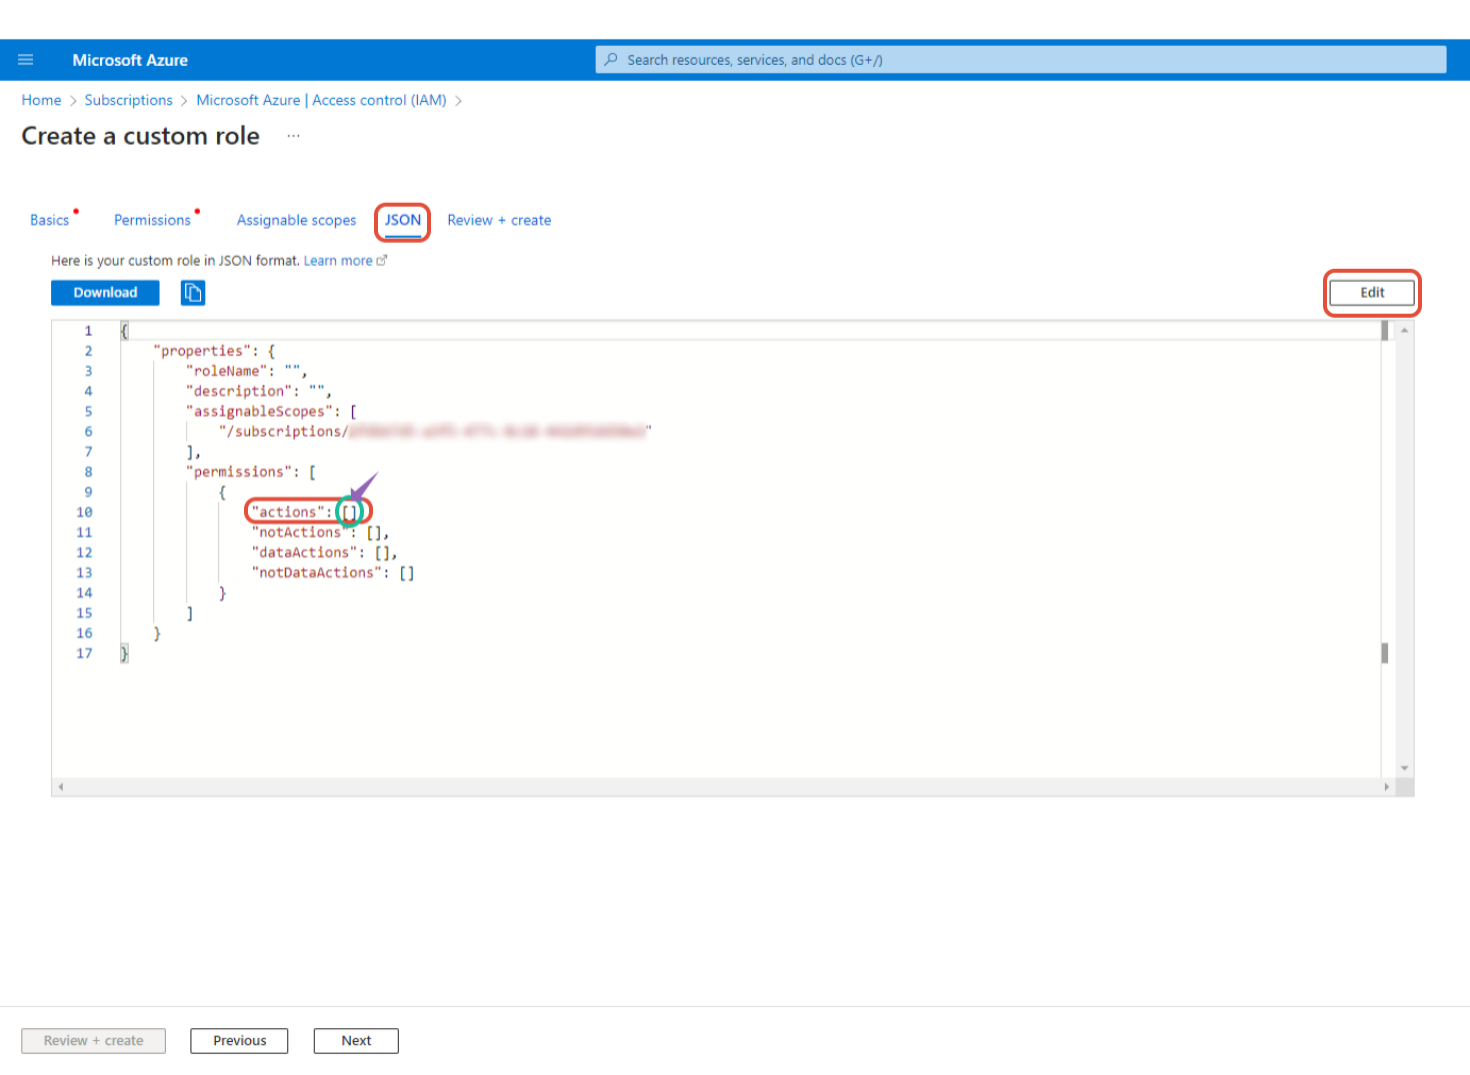
"Microsoft.DBforMariaDB/servers/start/action",
"Microsoft.DBforMariaDB/servers/stop/action",
"Microsoft.DBforPostgreSQL/flexibleServers/start/action",
"Microsoft.DBforPostgreSQL/flexibleServers/stop/action"
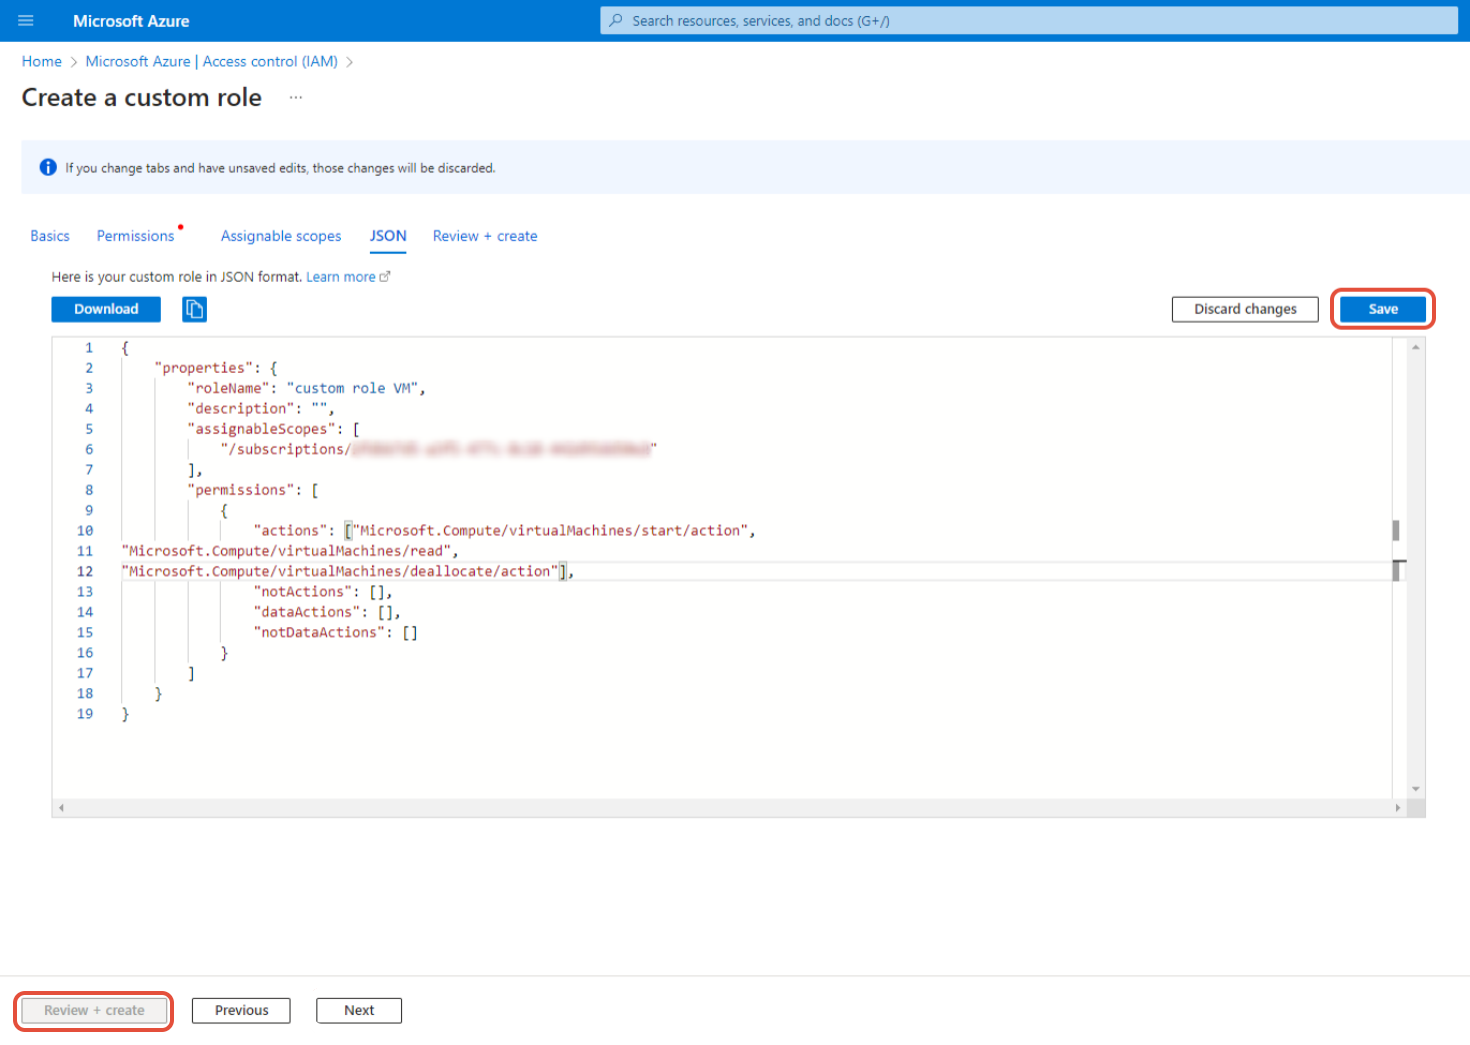
"Microsoft.Compute/virtualMachines/start/action",
"Microsoft.Compute/virtualMachines/deallocate/action",
"Microsoft.DBforMySQL/flexibleServers/start/action",
"Microsoft.DBforMySQL/flexibleServers/stop/action",
"Microsoft.DBforMySQL/servers/start/action",
"Microsoft.DBforMySQL/servers/stop/action"⑥ Click the [Save] button on the top right and the [Review+Create] button on the bottom left.
⑦ On the Access Control (IAM) screen, click the +Add button in the upper left corner and select Add role assignment.
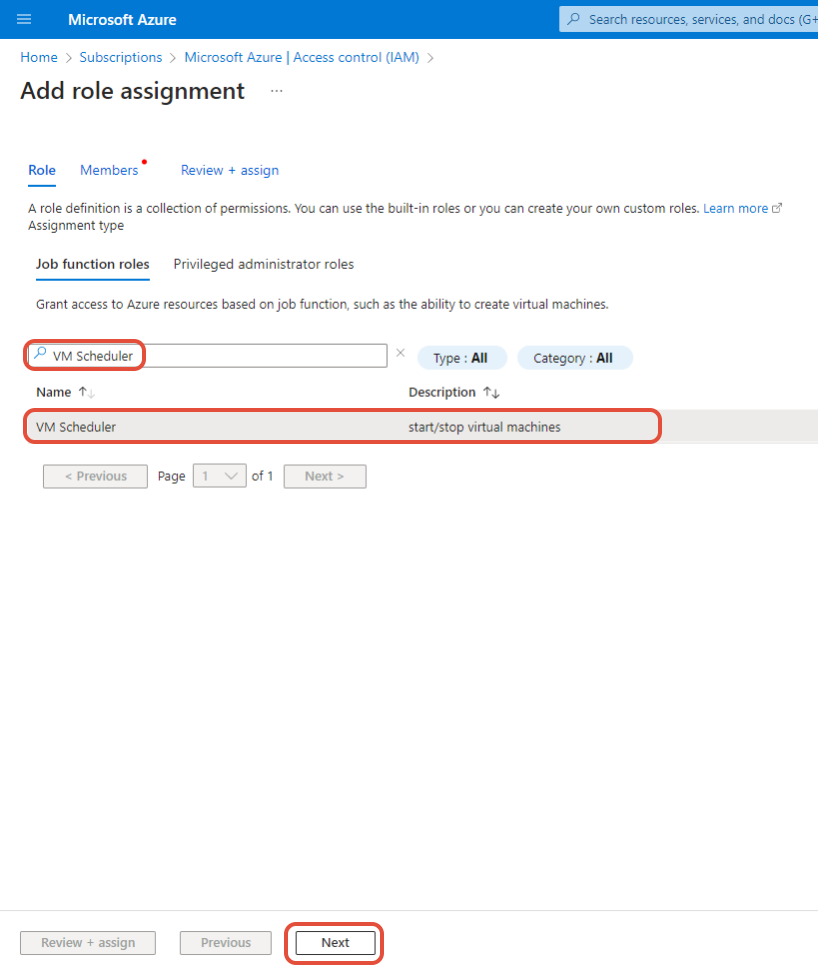
⑧ On the Role tab, search for and click the name of the role you created, then click the [Next] button in the lower right corner.
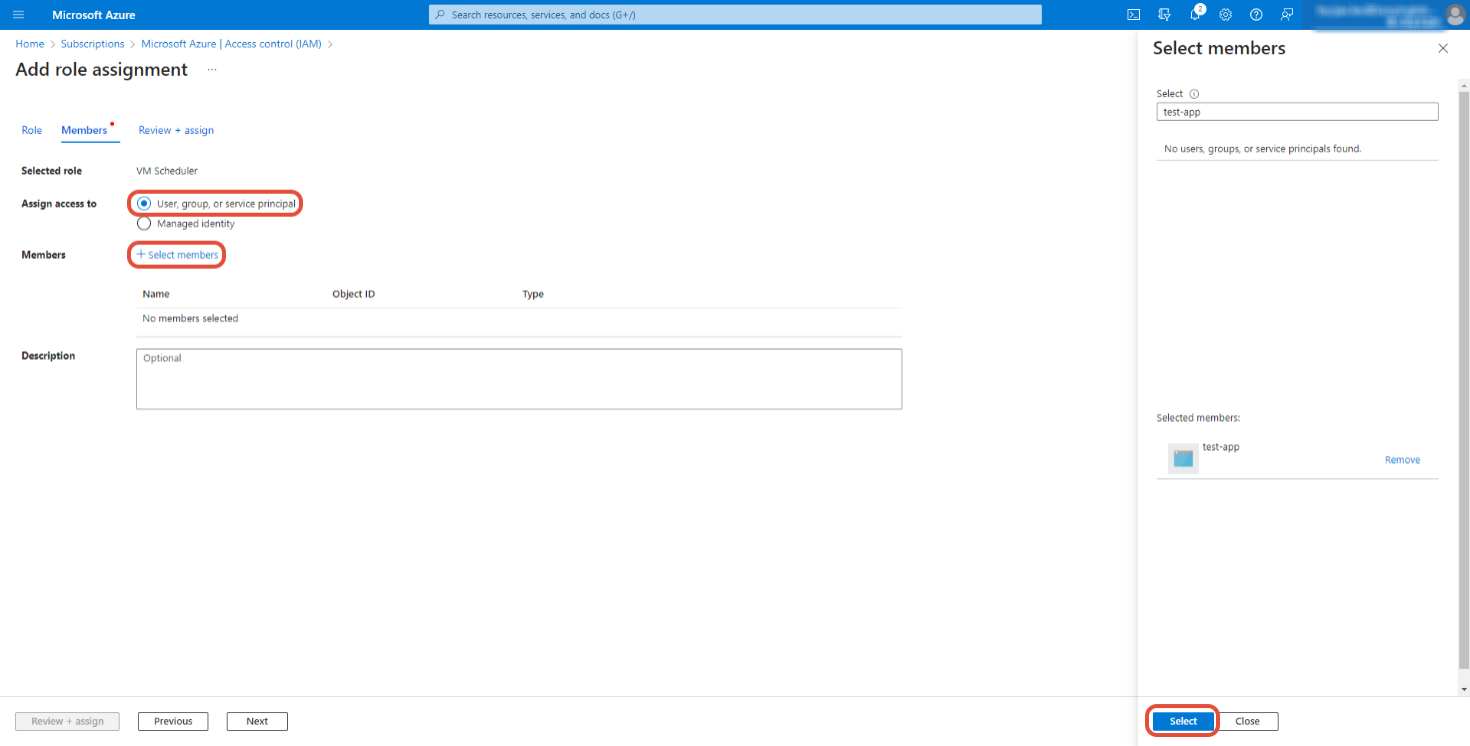
⑨ On the Members tab, assign access to: User, group, or service principal, then click the +Select members button for Members. In the right wing, select the app to which you want to apply the custom role and click the [Select] button.
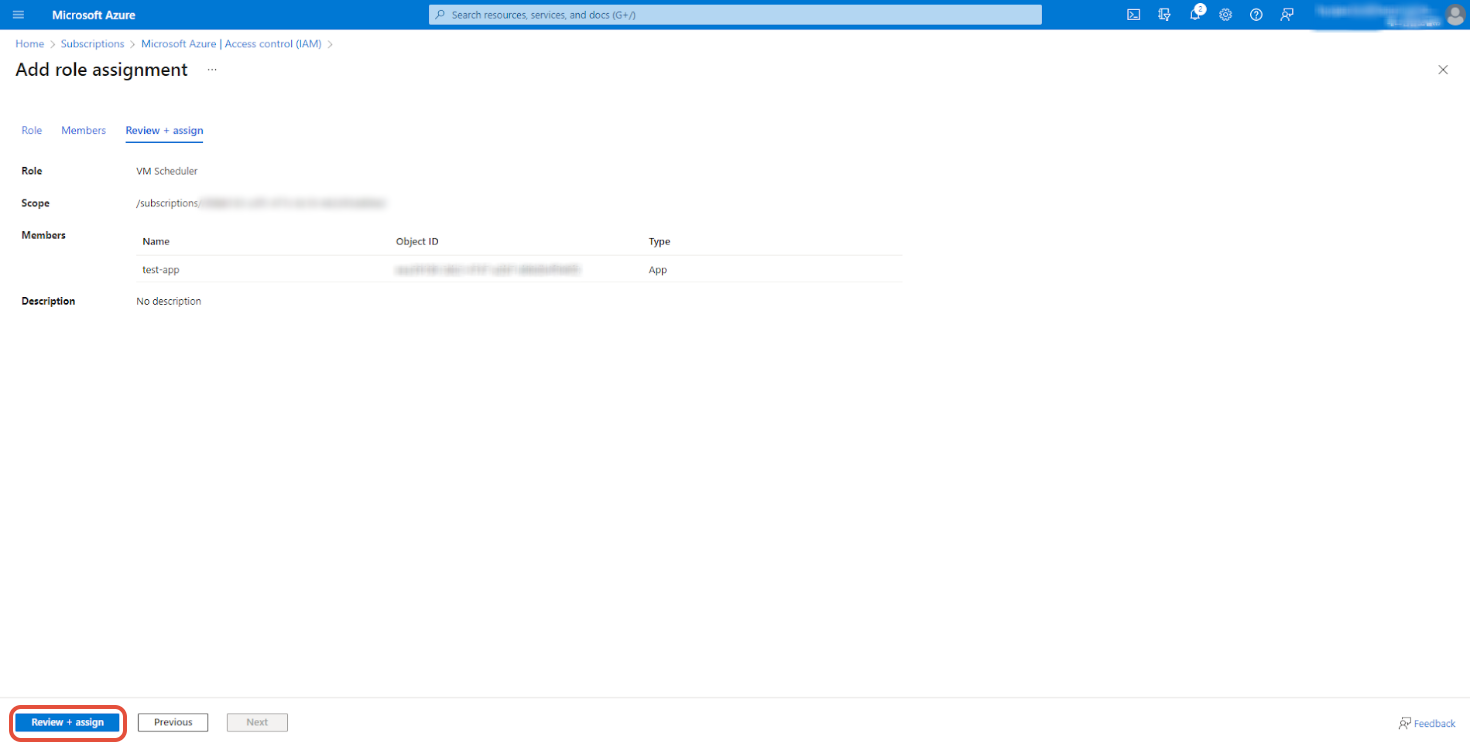
⑩ Click the [Review+Assign] button in the lower left corner of the screen.
GCP Permissions
You need to grant ‘compute.instances.start’ and ‘compute.instances.stop’ permissions to the System to use Resource Scheduler. Follow the instructions below to grant necessary permissions by creating a role on the GCP console to the System.
📜 Note: Only the Owners who has the permissions to create a role can grant such permissions to the System.
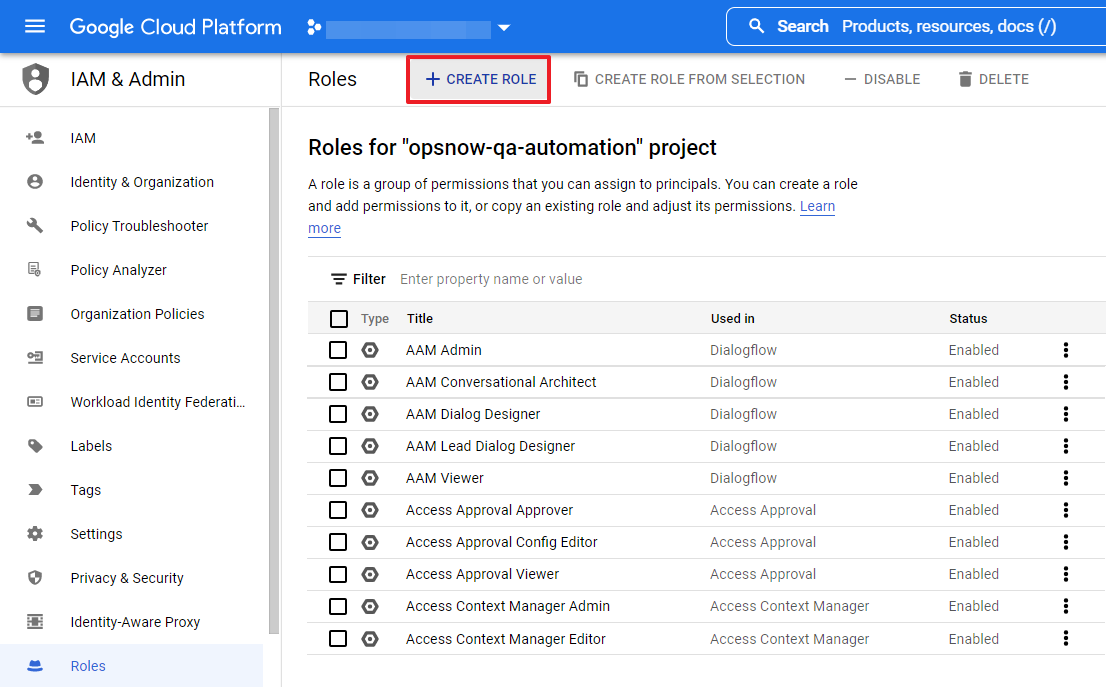
① Go to GCP Console Home and move to IAM & Admin > Roles page.
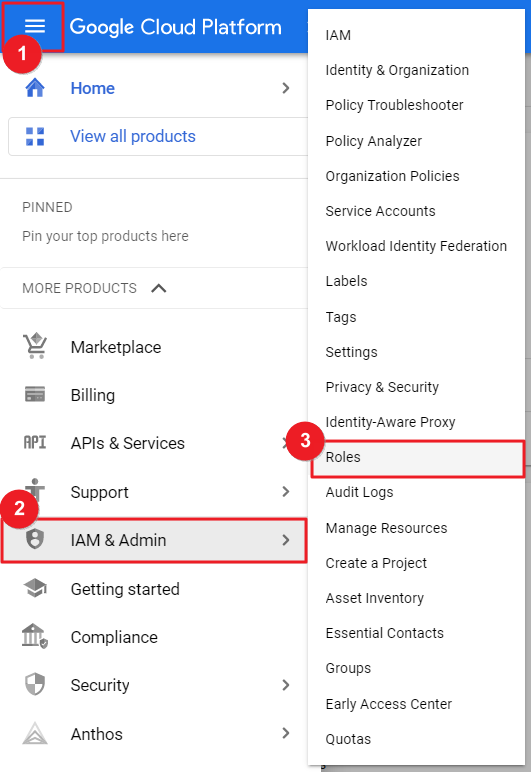
② Click [CREATE ROLE].
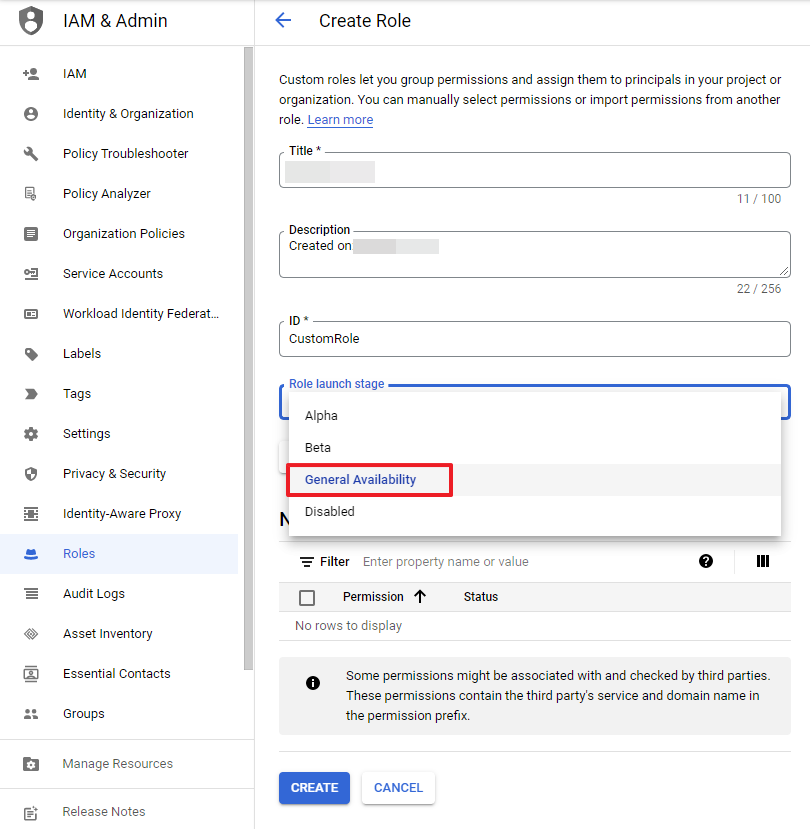
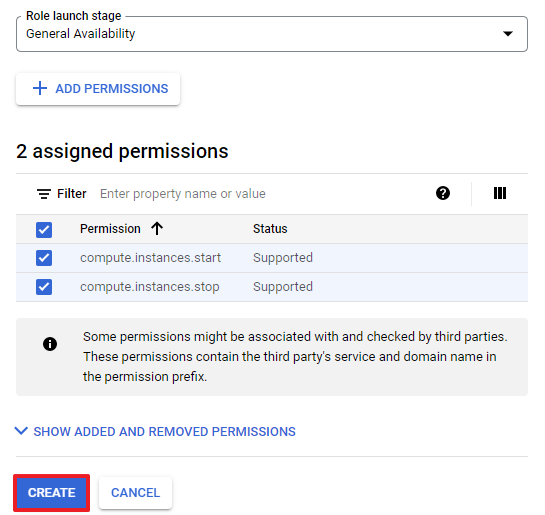
③ Enter Title and ID and select General Availability for the Role launch stage.
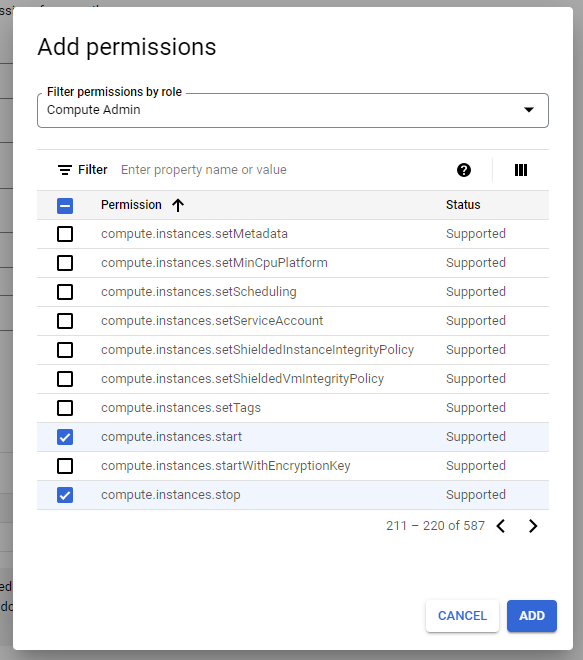
④ Click the [ADD PERMISSIONS] button and select Compute Admin from the Filter permissions by role drop-down list. And then search and select compute.instances.start and compute.instances.stop from the permissions list. Click the [ADD] button.
⑤ Click [CREATE] to complete creating a role.
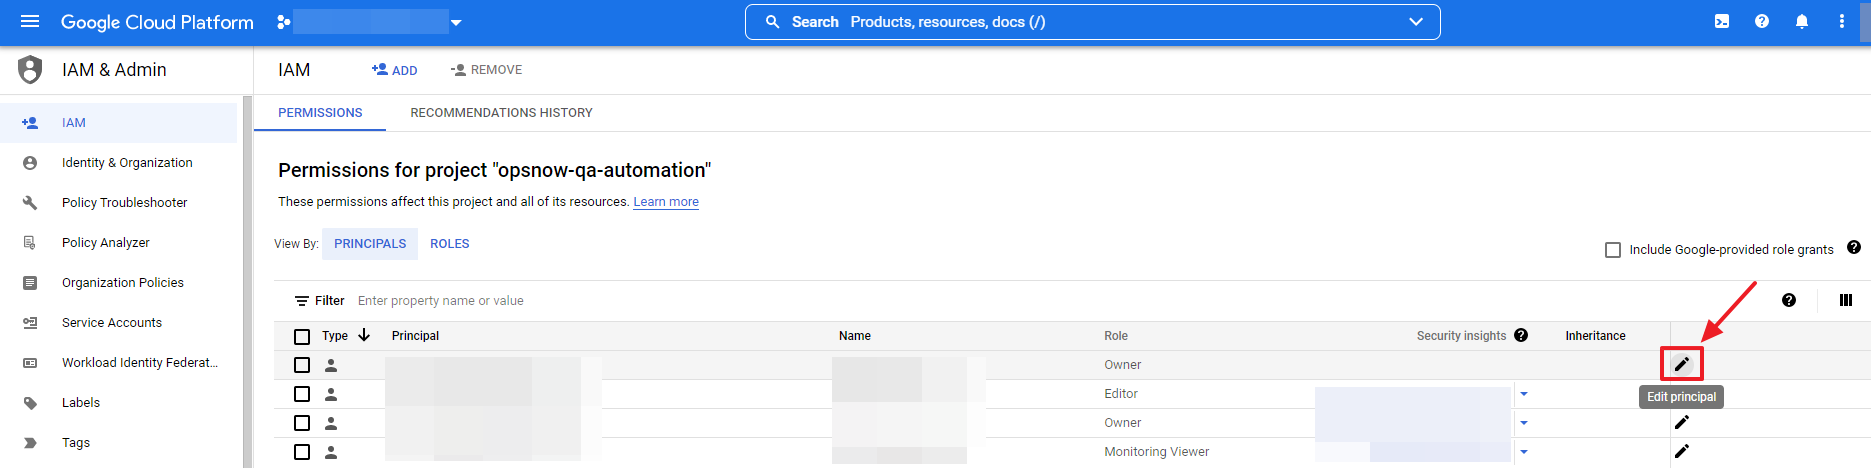
⑥ Now, go to IAM & Admin > IAM page to edit the current permissions. To edit the principal (service account) permission linked to the Resource Scheduler menu, click the pencil icon on the right.
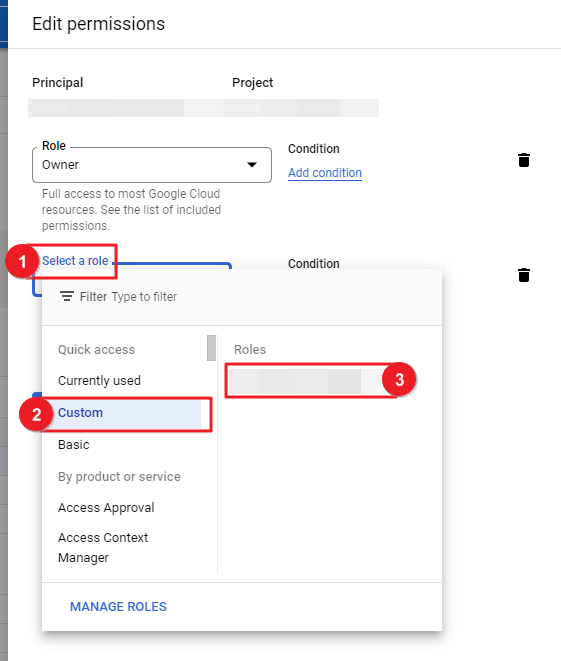
⑦ Click [ADD ANOTHER ROLE] and select Custom for the Select a role field and then select the created Role.
⑧ All required permission settings are now completed.
Create Resource Schedule
This section explains how to create a Schedule to start or stop the instances whenever you want.
① Go to Asset > Resource Scheduler > Schedule tab, and click Create.
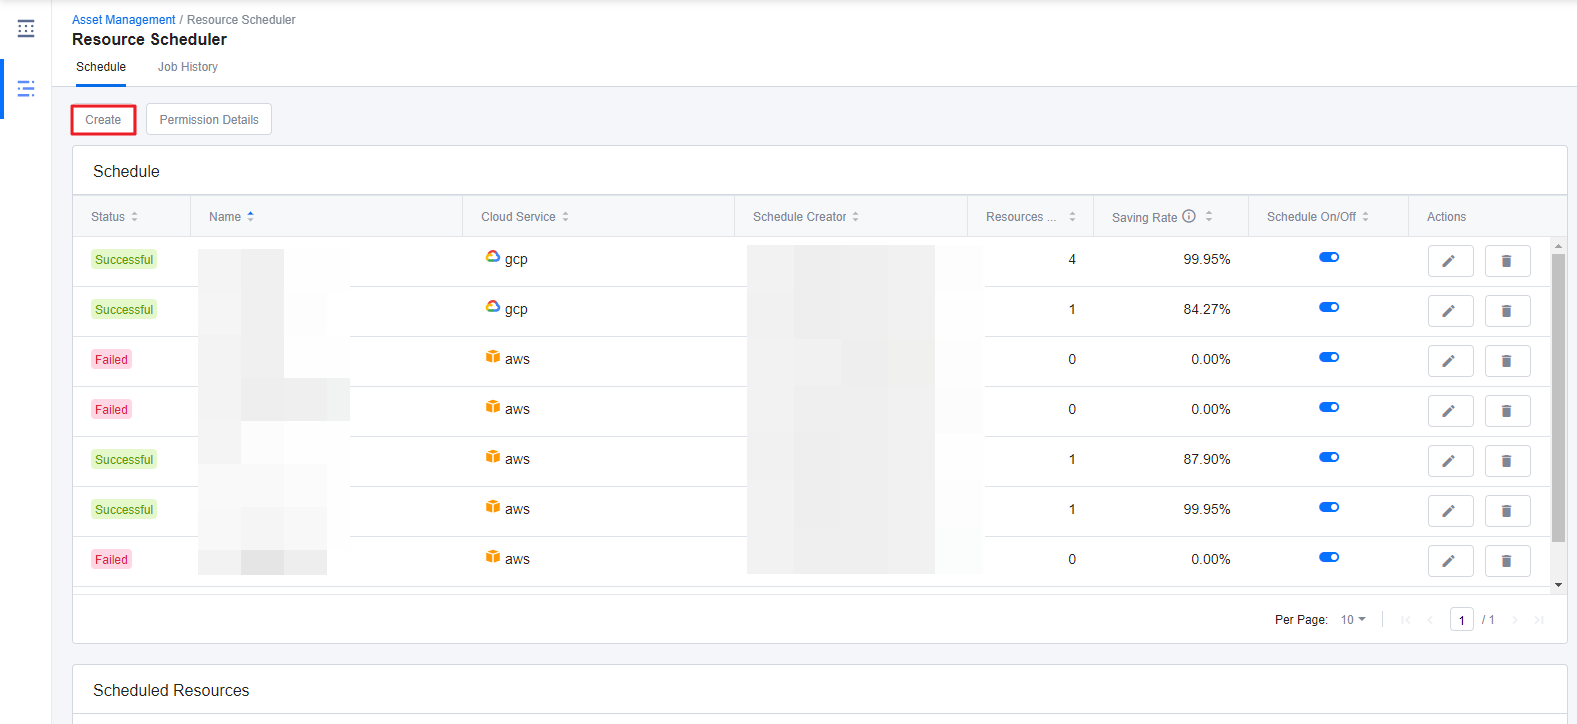
② Enter a Name, without any space, and select a Cloud Service Provider as well as a Resource Type for this schedule.
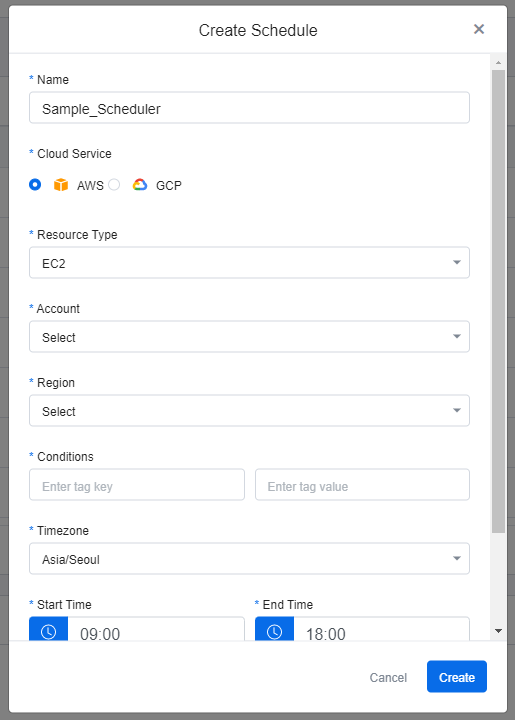
③ Fill in all items as they are required to create a schedule.
| Item | Description |
|---|---|
| Account/Project | Registered accounts on the Cloud Accounts of the Service Portal are provided in the dropdown options. Select the cloud account alias. |
| Region | Select a region for the resource. |
| Conditions | Enter value and key, which are the conditions for this schedule. For AWS resources, enter tag key and tag value. For GCP resources, enter label key and label value. Only the resources matching the given key and value are subject to this schedule. The AWS tags can be applied in the Service Portal > Tag Assistant. |
| Timezone | Select a timezone. |
| Start and End Time | Enter the start and end time for the Scheduler. You can either enter the time directly or click the Clock icon to select the time. When you are setting the time for the schedule, you can only enter the time in H:mm form. You cannot enter any other special characters or letters here. |
| Days | Select one or more days that you want the Schedule to run. |
💡 Go to Tag Assistant Guide for more information.
④ Click Create to create a new Schedule.
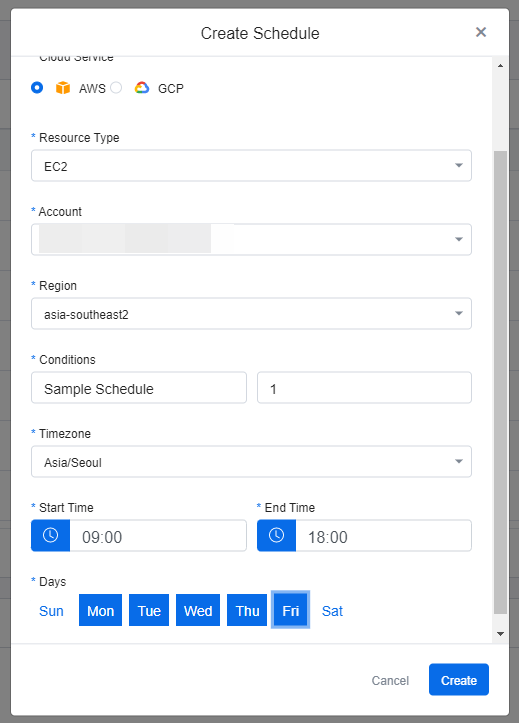
View Scheduled Resources
This section explains how to view the created schedules and the scheduled resources.
① Click a schedule from the list on the Schedule tab. If the number of scheduled resource is 0, then no resources are shown in the Scheduled Resources table.
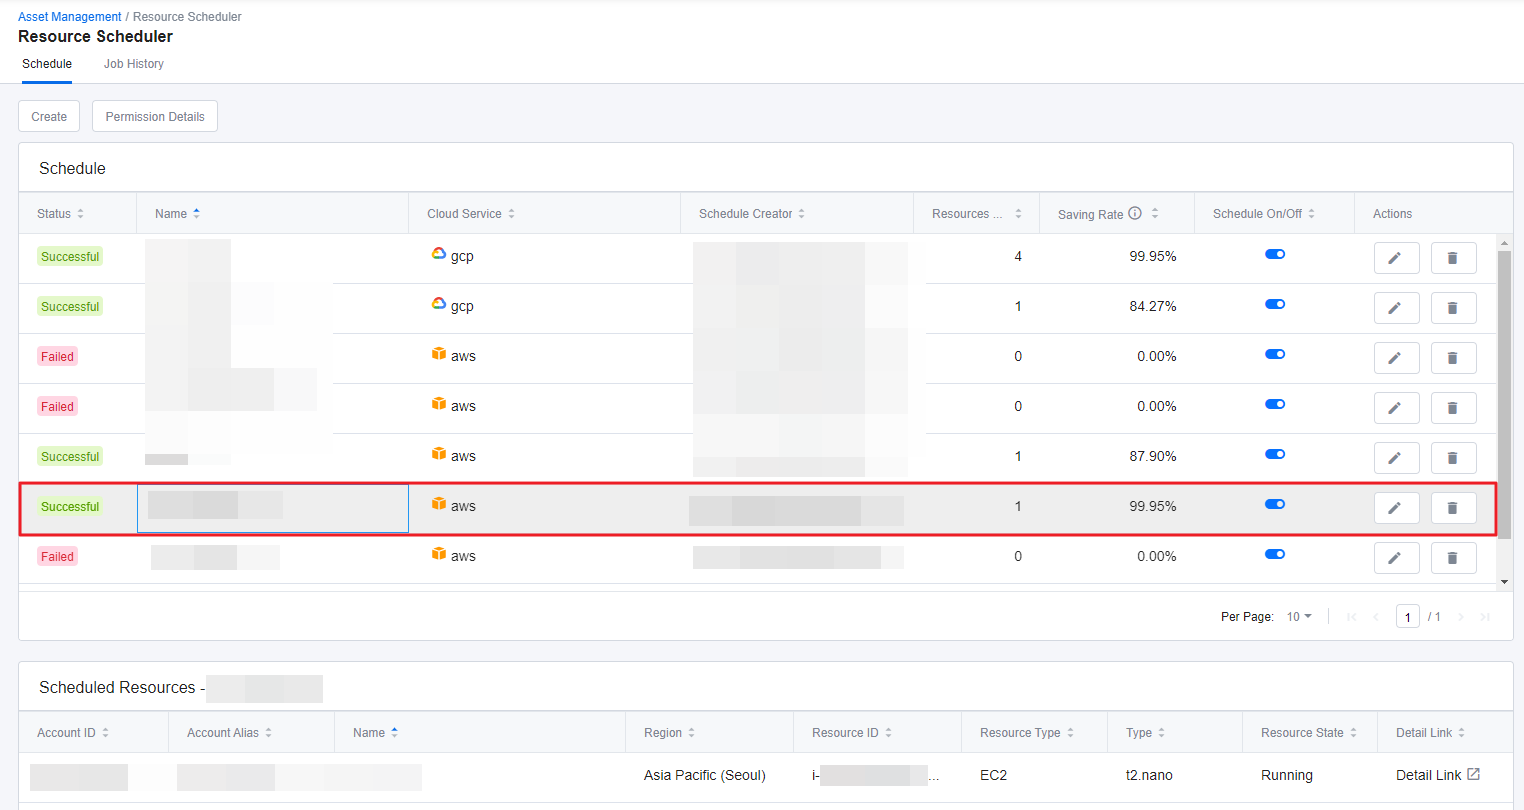
② You can view Account/Project ID, Account/Project Alias, Schedule Name, Region, Resource ID, Resource Type, Instance Type, and the resources’ current State under the Scheduled Resources table. If you want to view more details about the resource, click Detail Link.
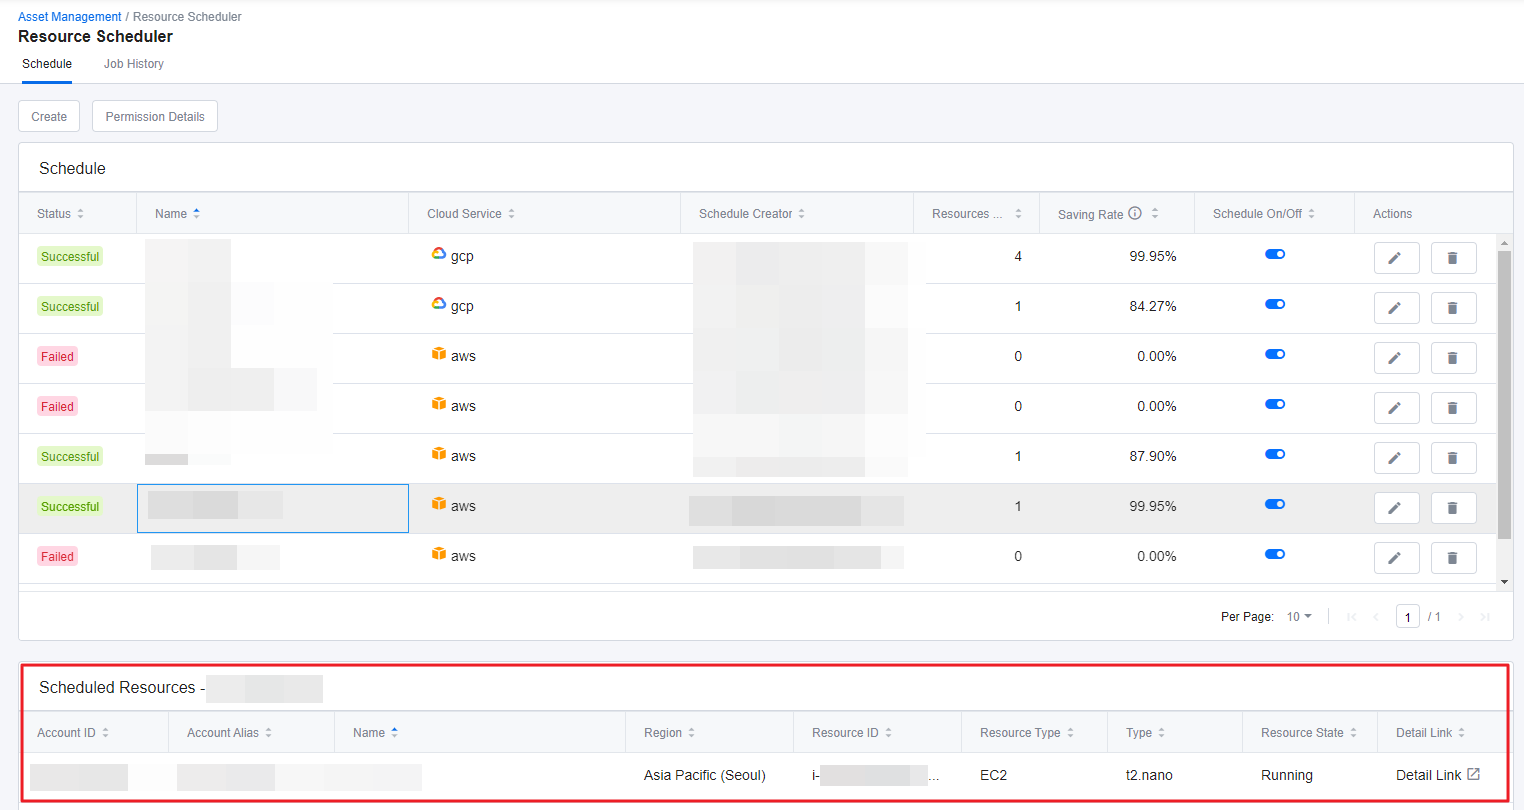
View Schedule History
This section explains how to view the history of previously executed schedules.
① Go to Job History tab.
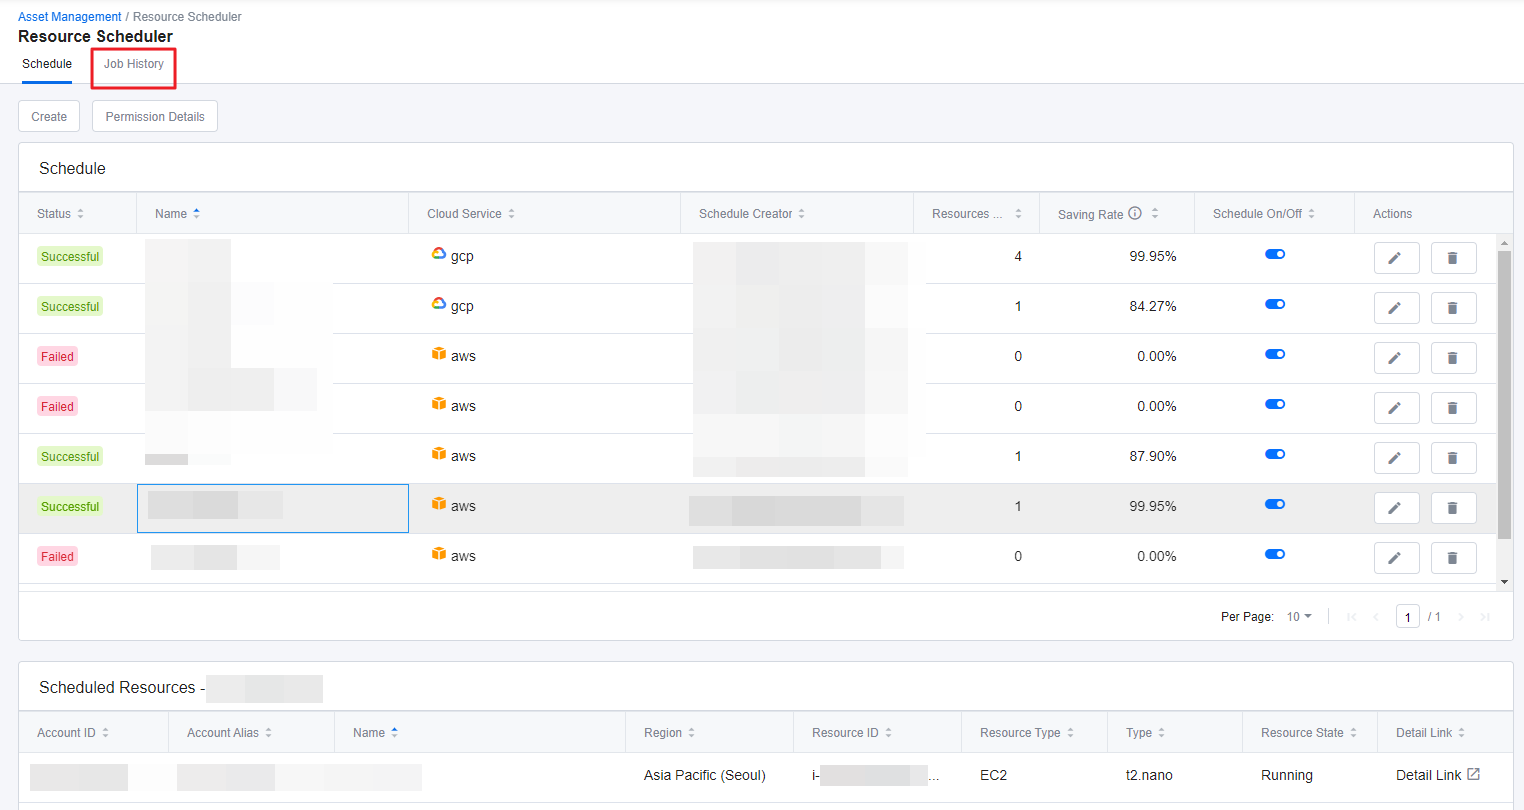
② You can view all of the executed schedules when the resource was Started or Stopped, and you can also search for specific job history from the top of the page.
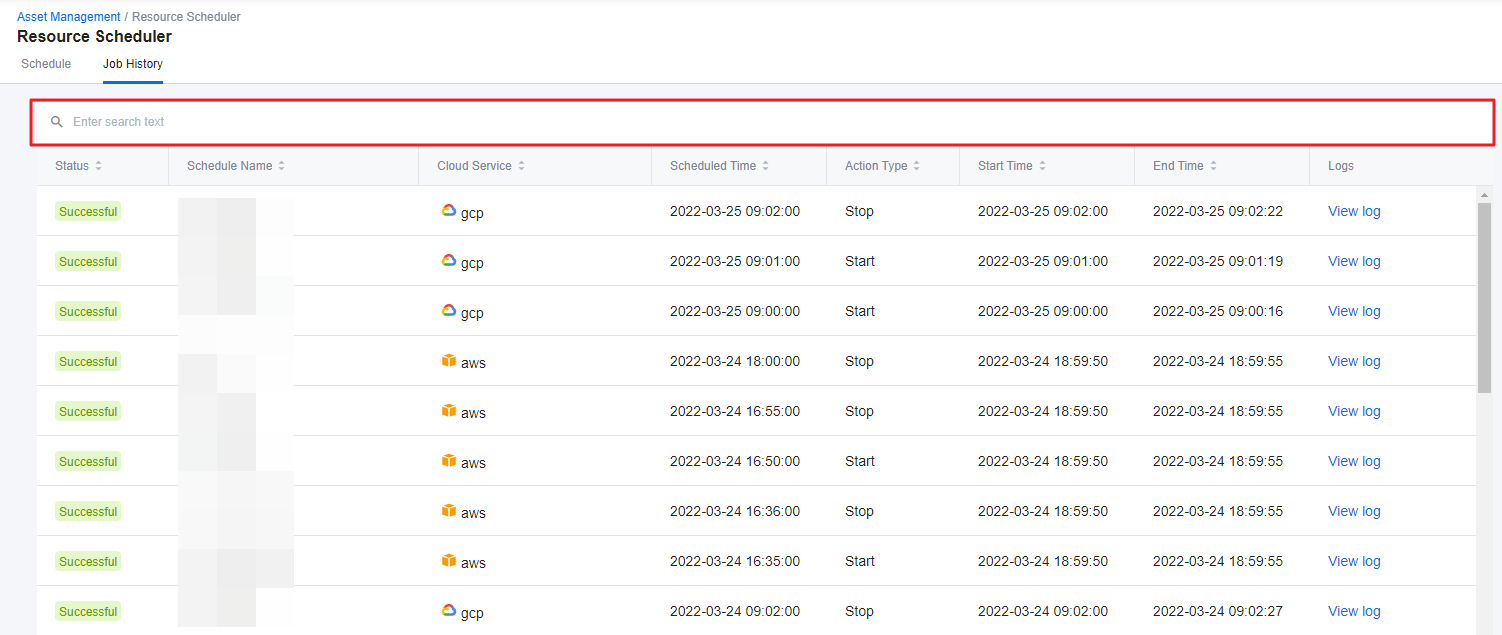
③ Click View log to see refined and summarized version of the job log.
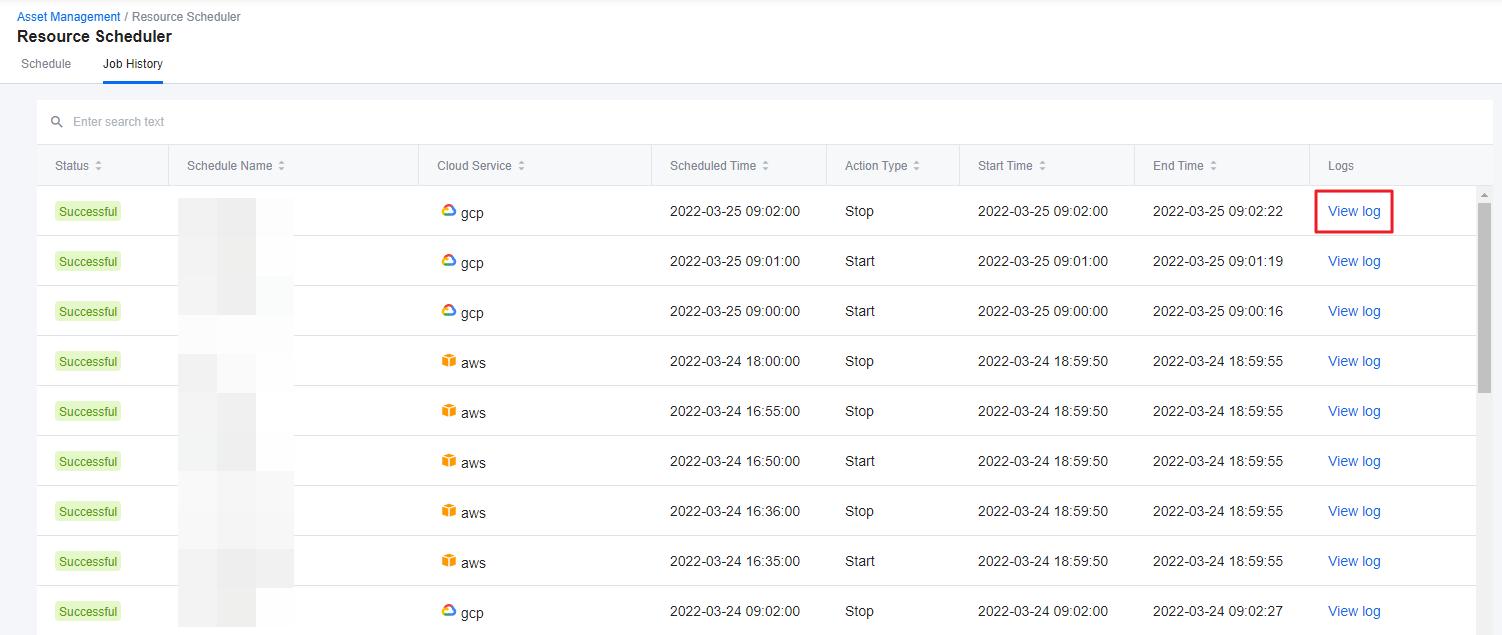
Turn On and Off Schedule
This section explains how to turn on or off the Scheduler.
① Select a resource schedule from the Schedule tab and click the On/Off toggle switch.
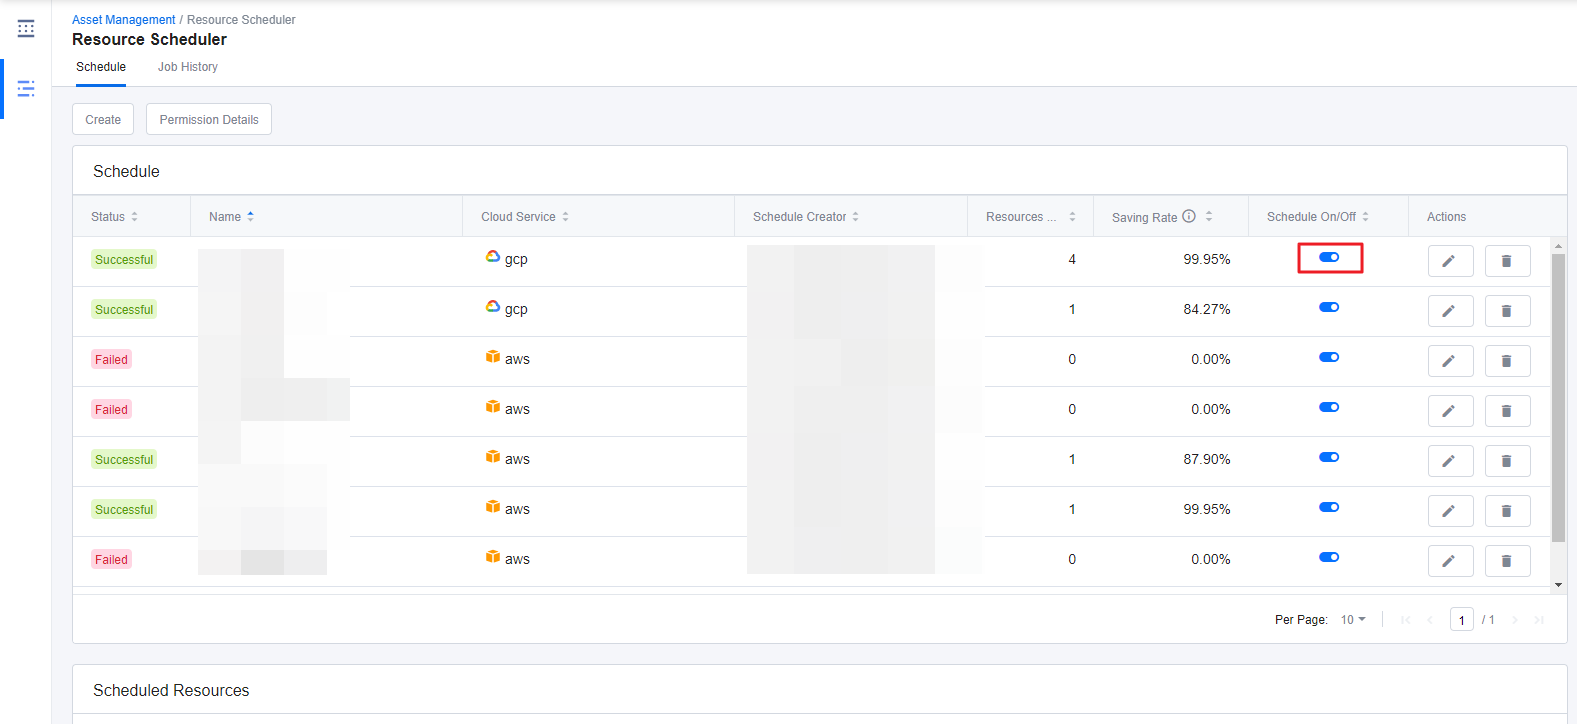
② When the schedule is running or on, it displays blue color, and when it is not, it displays gray color, meaning the schedule is currently off.
Modify Resource Schedule
This section explains how to modify a created resource schedule. Only the Schedule Creator who created the schedule can modify it.
① Select the schedule that you want to modify and click the [Pencil] icon.
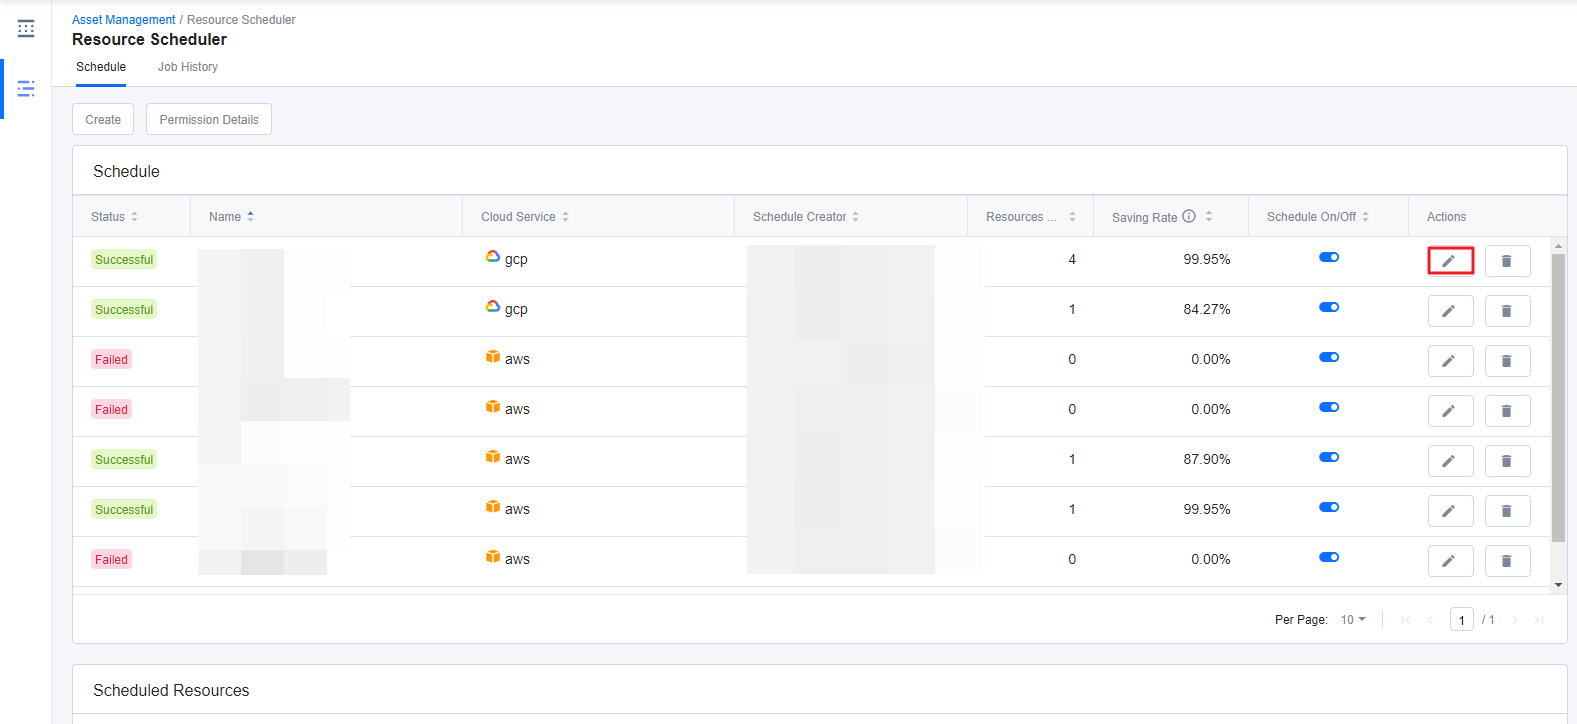
② Modify Schedule window that looks exactly the same as the Create Schedule appears. Make changes and click [Save] on the lower right corner.
Delete Resource Schedule
This section explains how to delete a created resource schedule. Only the Schedule Creator who created the schedule can delete it.
① Select the schedule that you want to delete and click the [Trash bin] icon.
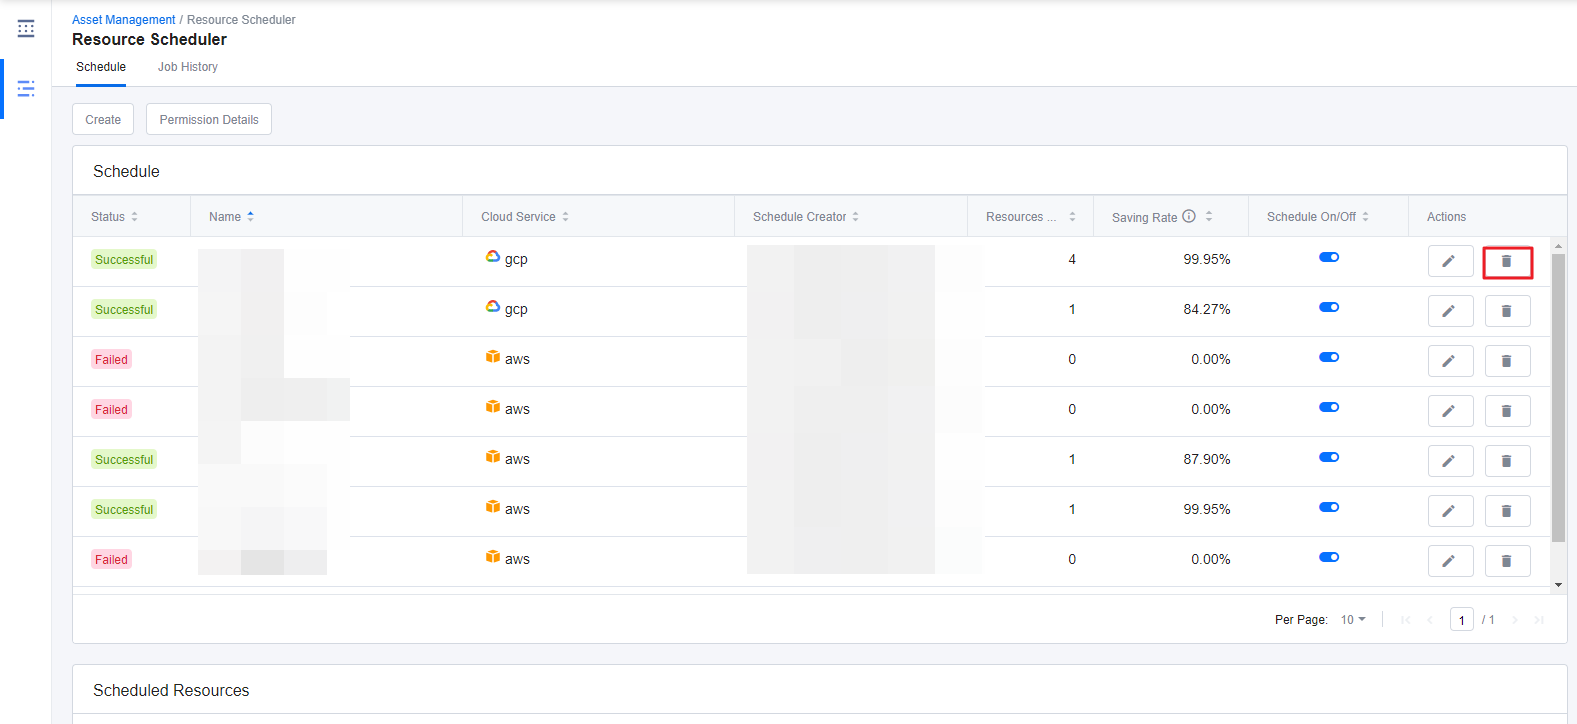
② A window appears to confirm the delete action. Click [Delete] to go ahead and delete the schedule.
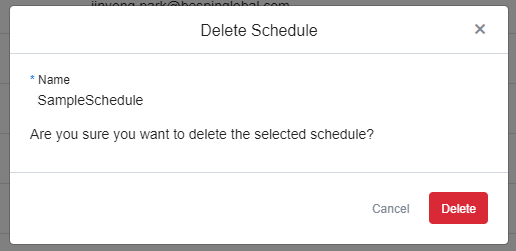
Tag Assistant
Asset > Tag Assistant
Tags enable you to categorize your resources in different ways, for example, by purpose, owner, or environment. You can add tags to resources like account, region, and product, and can quickly identify and filter a specific resource based on tags that you’ve assigned to it. Tag Assistant is the right tool for you to add tags to resources easily.
Tag Assistant allows you to add and delete tags on resources directly in Service Portal instead of accessing AWS console to the job. In AWS Management Console, you need to log in with each account to edit tags for each product. Therefore, it is a time consuming process for tagging resources and can cause human error. Whereas Tag Assistant allows you to add or delete tags on multiple accounts, regions, and resources, and easily manage tag history as well.
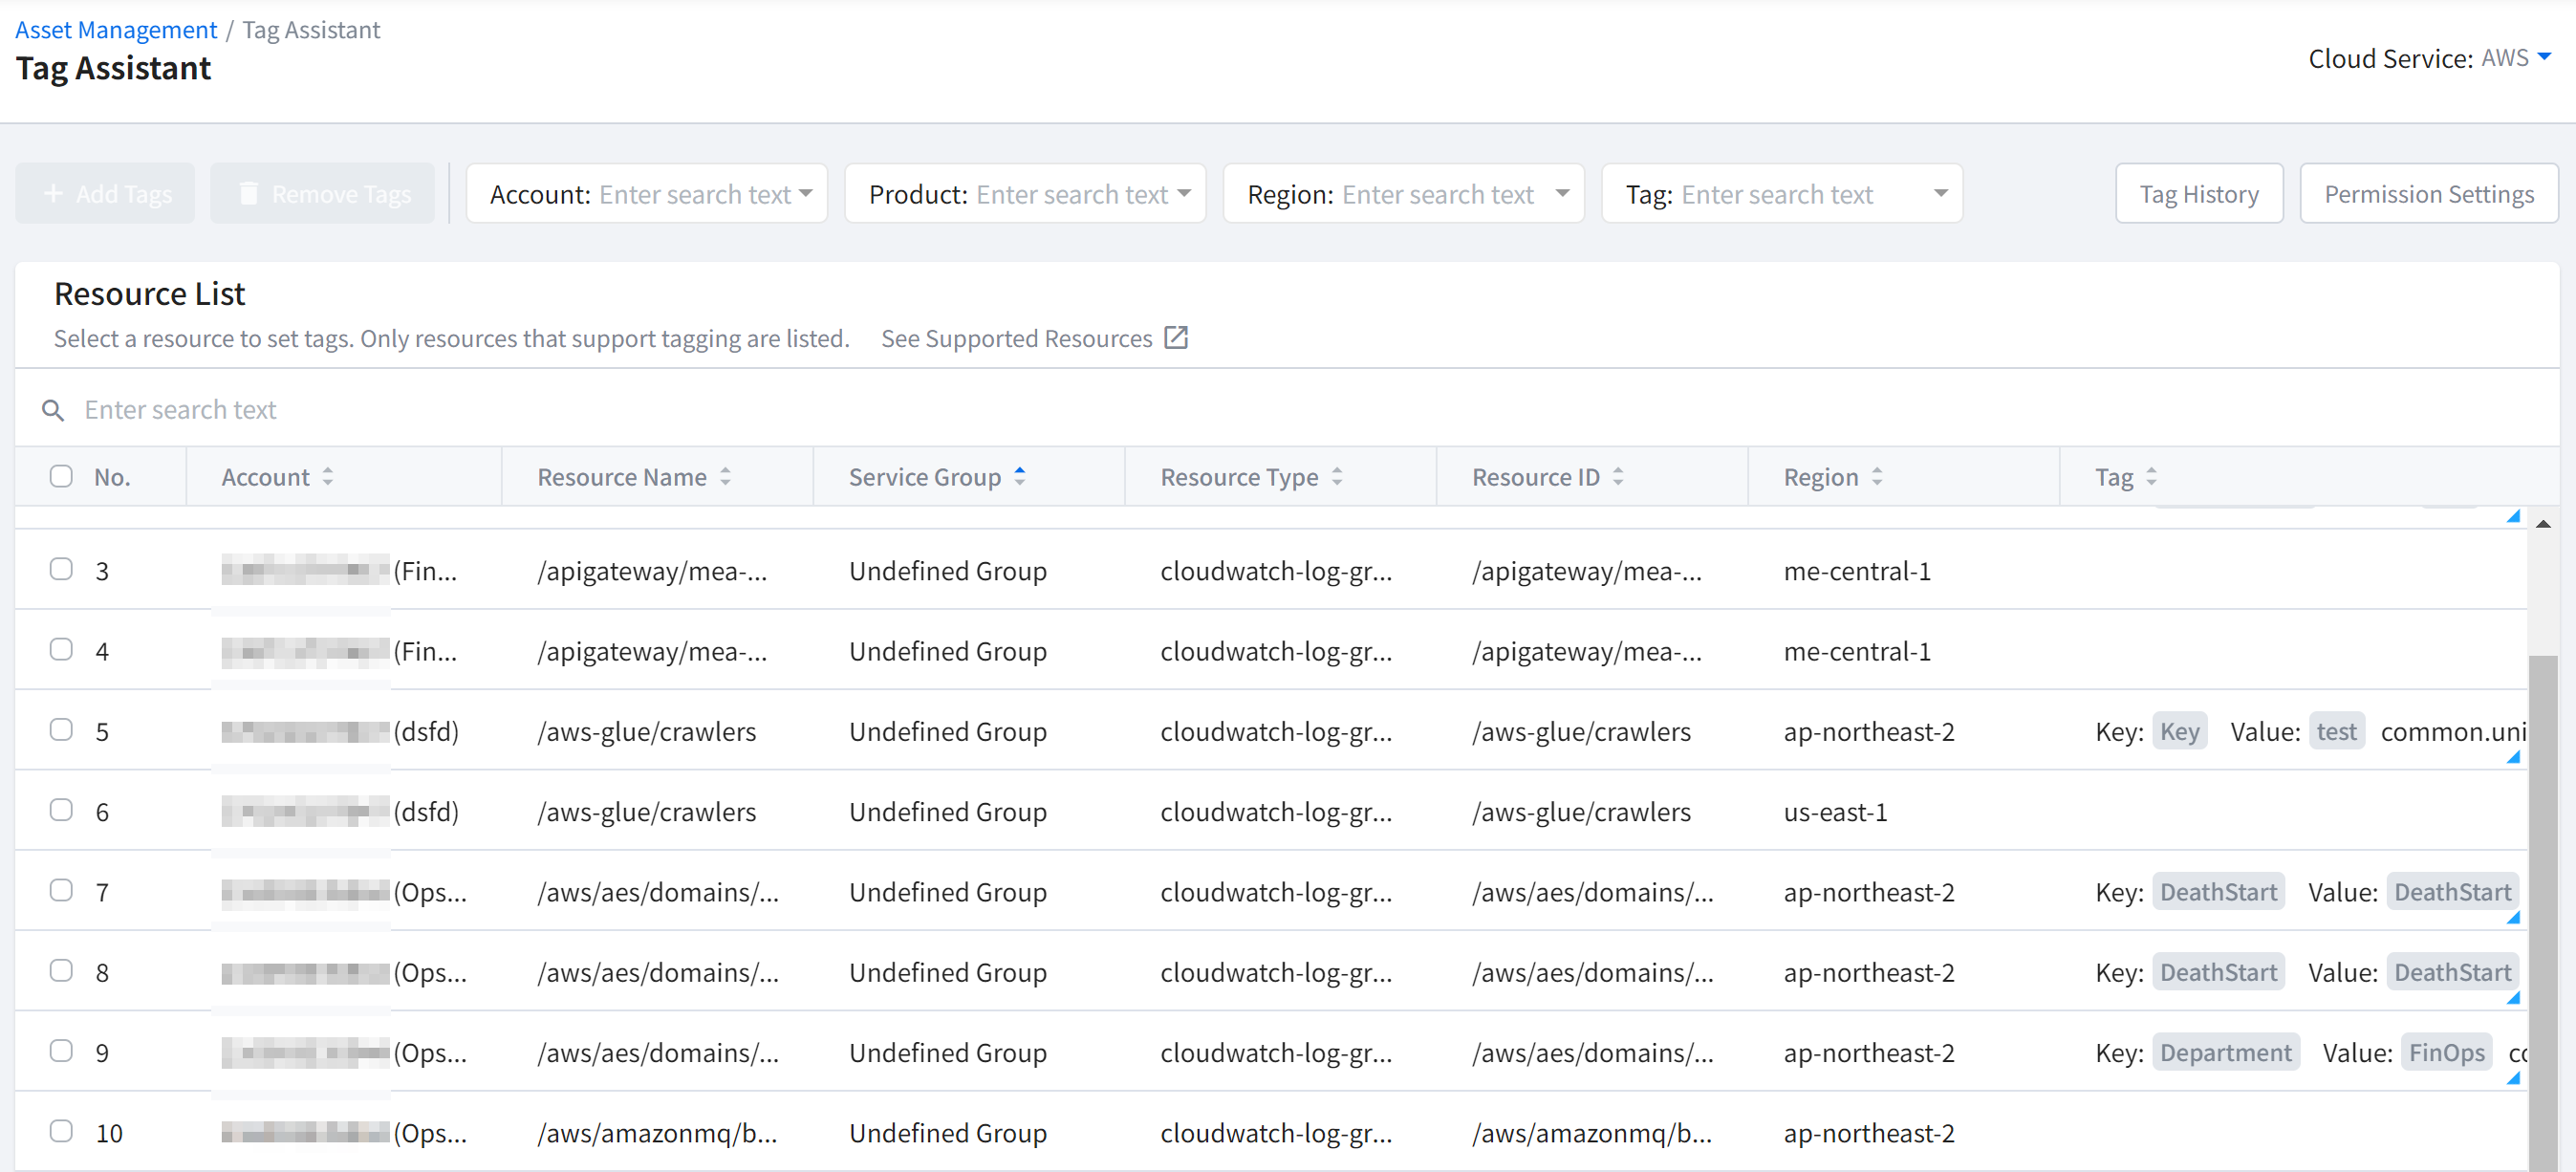
AWS Permissions
To use Tag Assistant, you need a Write Tag permission. To add the permission, copy the JSON policy statement provided by Permission Settings of Tag Assistant and paste it in AWS Management Console. Before you get started working with Tag Assistant, be sure you have add Write Tag permission to accounts respectively.
There are two ways to add permission.
There are two ways to add permission from: IAM Access Key or Cross-Account Access. To add permission, choose one of the methods and proceed depending on whether you used IAM Access Key or Cross-Account Access when you register cloud accounts.
IAM Access Key
① Copy an ACCESS KEY of an account you want to grant permission from Service Portal > Cloud Account > IAM Access Key tab.
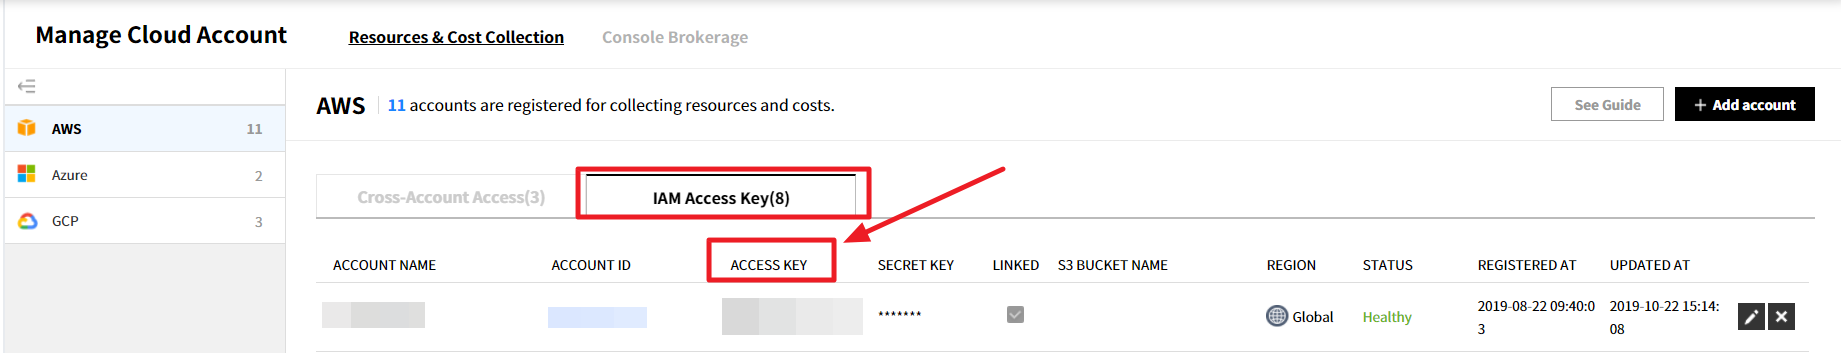
② Click Users in the left pane of the IAM menu in the AWS Management Console.
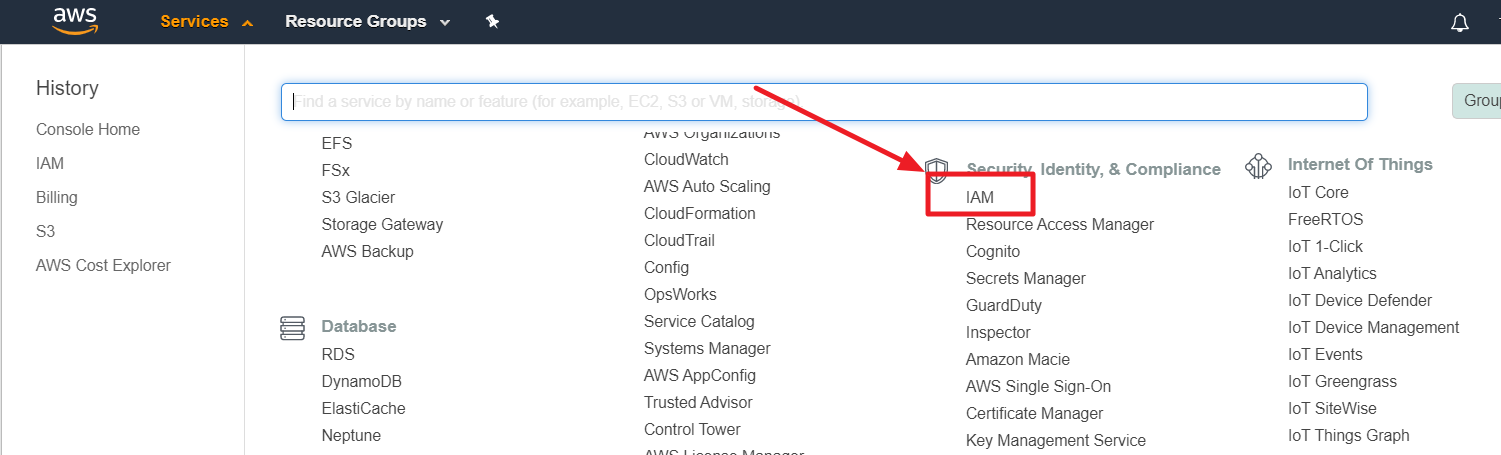
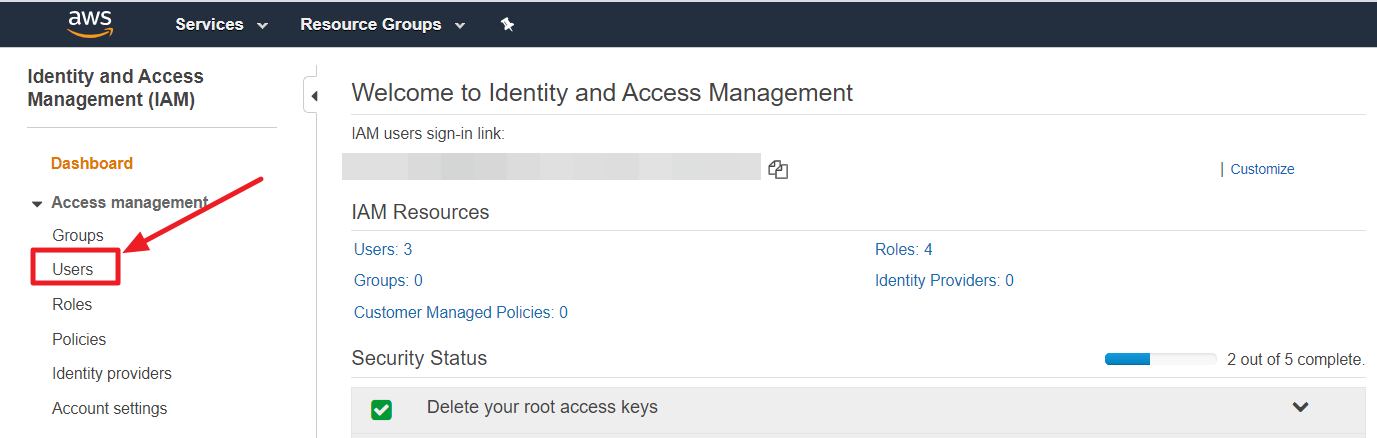
③ Search a user by using the ACCESS KEY copied from Service Portal.
④ Select a user from the list and click the [Add Permissions].
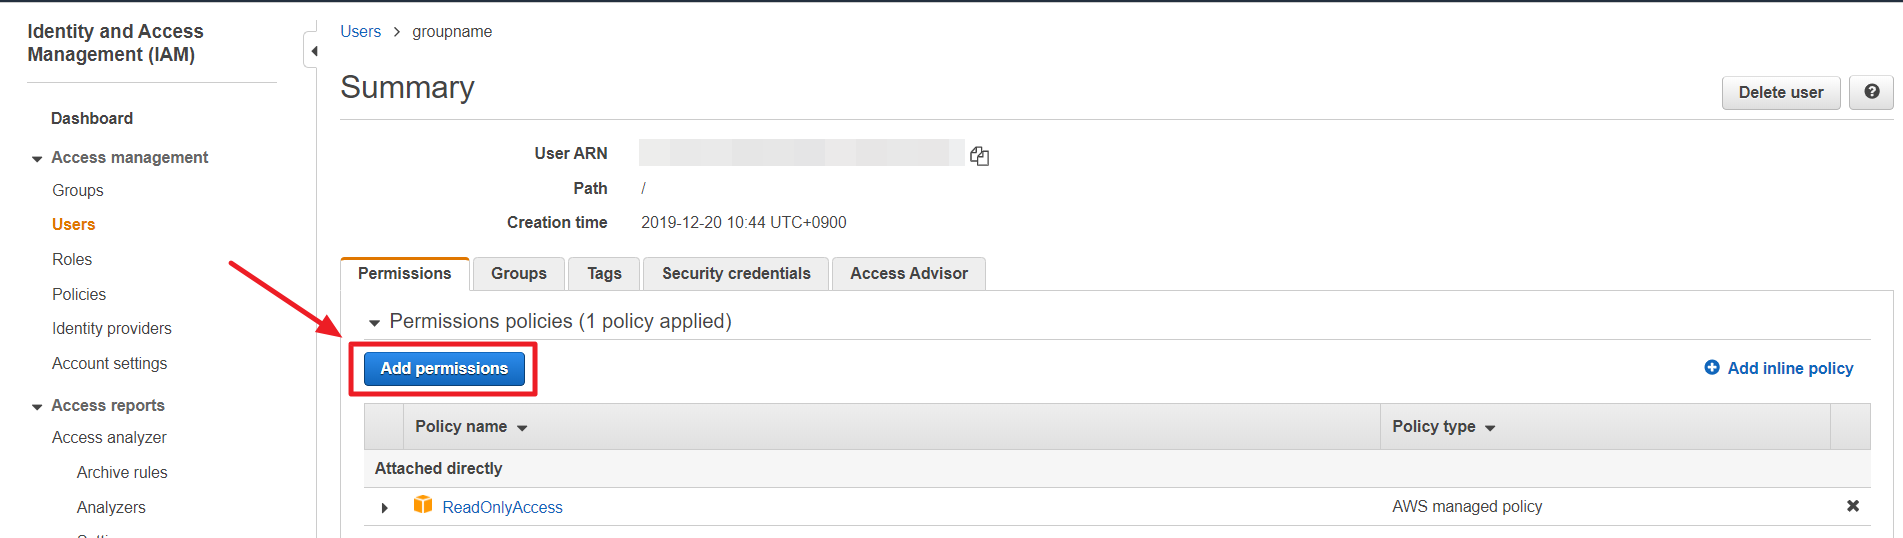
⑤ In Grant Permission page, select Attach existing policies directly.
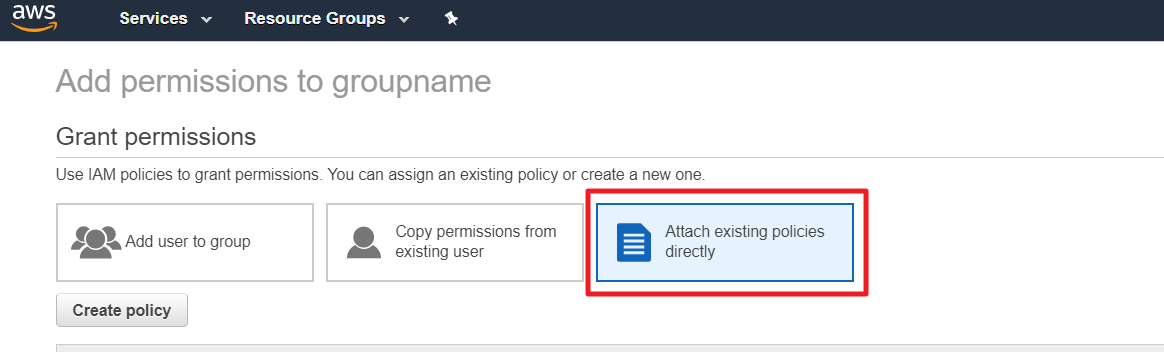
⑥ Click [Create policy] button and select JSON tab.
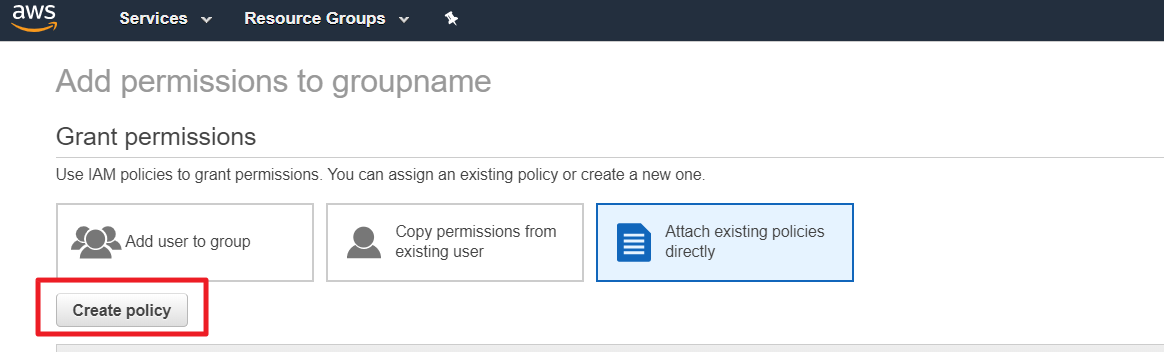
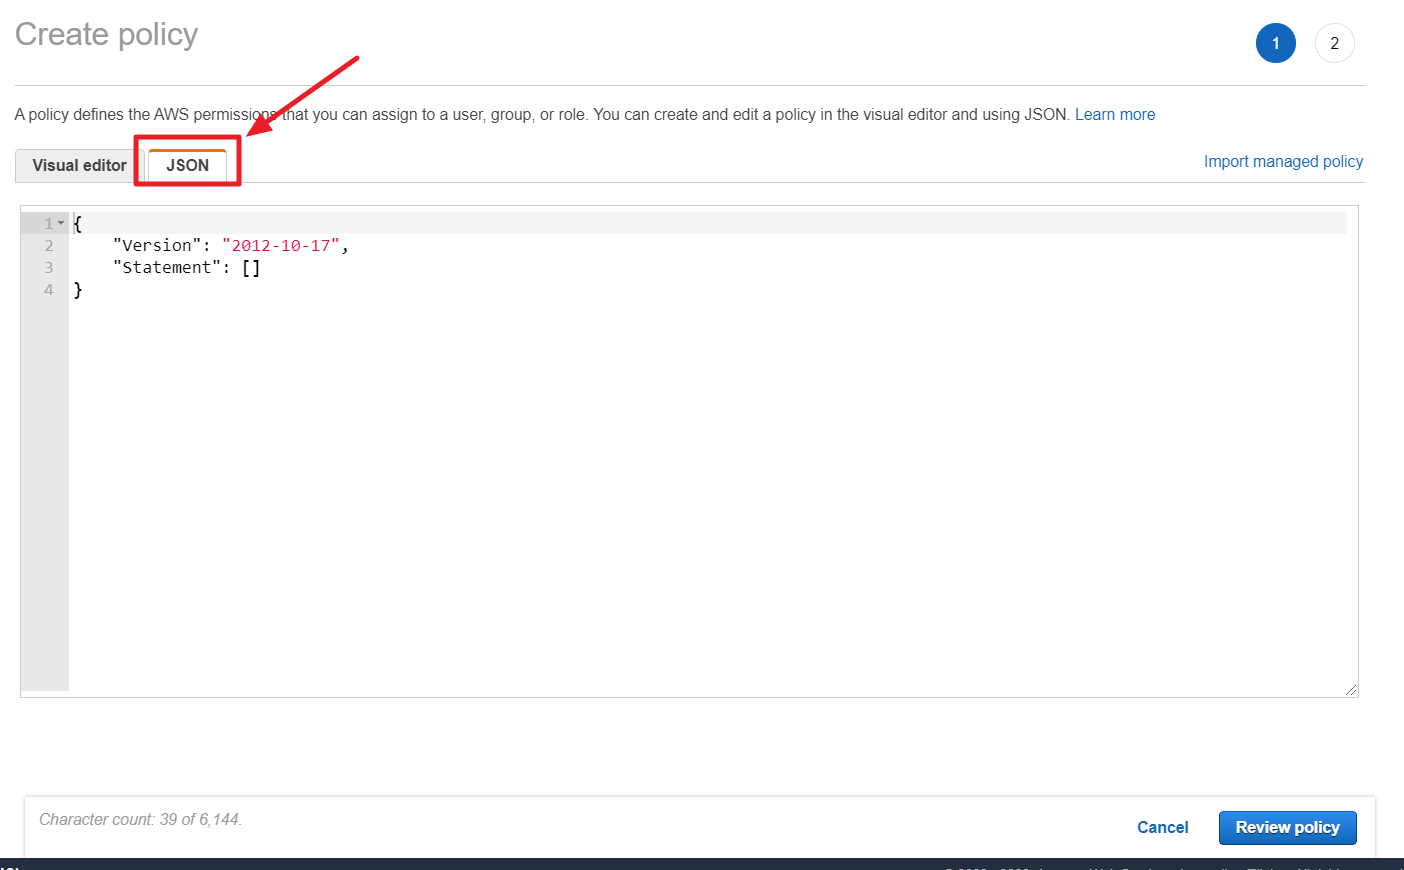
⑦ In Tag Assistant console, click the [Permission Settings] and then copy the JSON policy statement from the pop-up window.
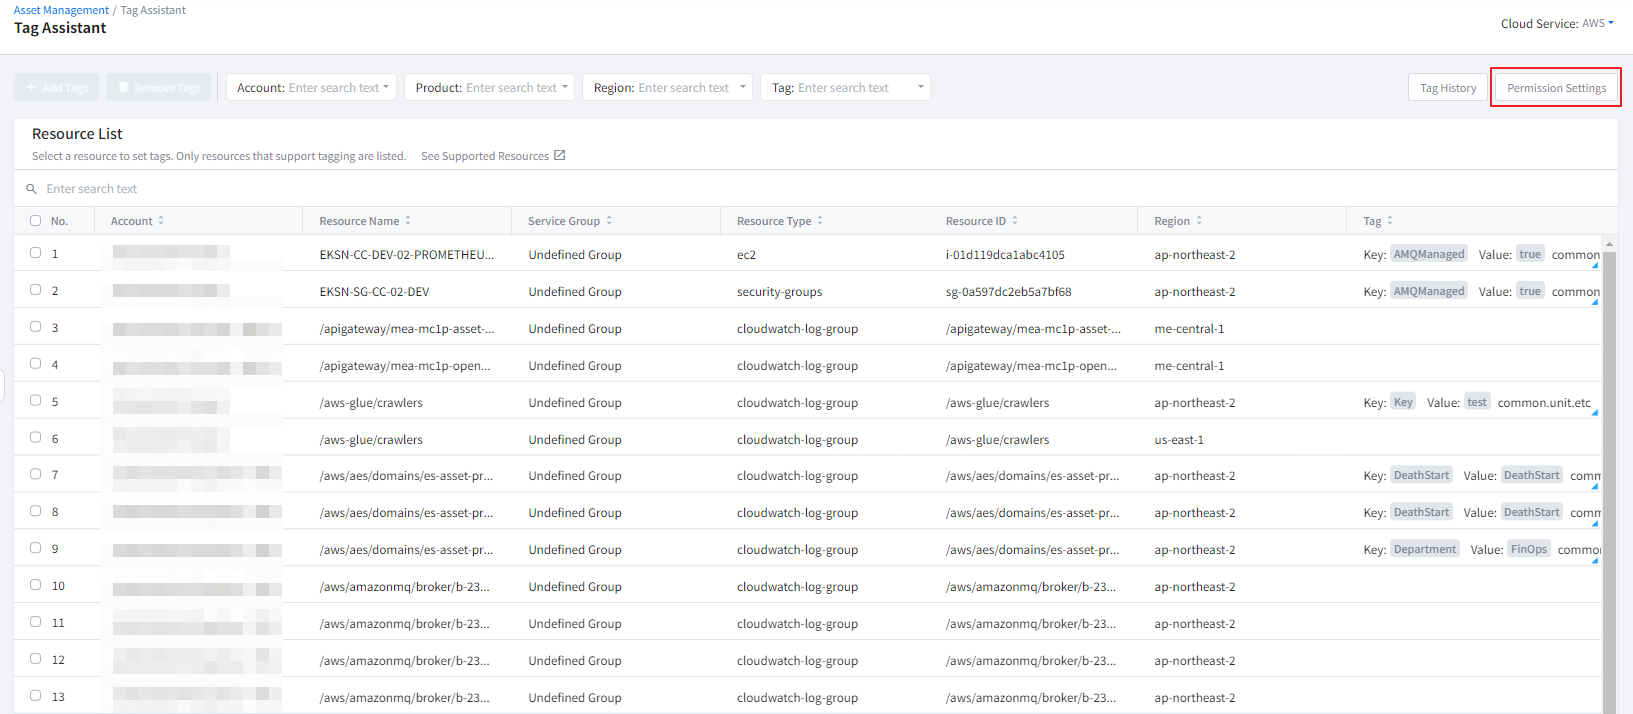
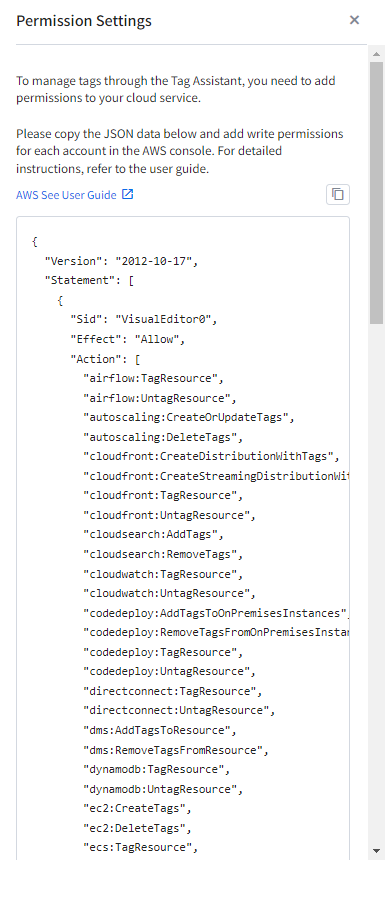
⑧ Paste the copied JSON data to the JSON tab in the AWS Console and then click the [Review Policy] button.
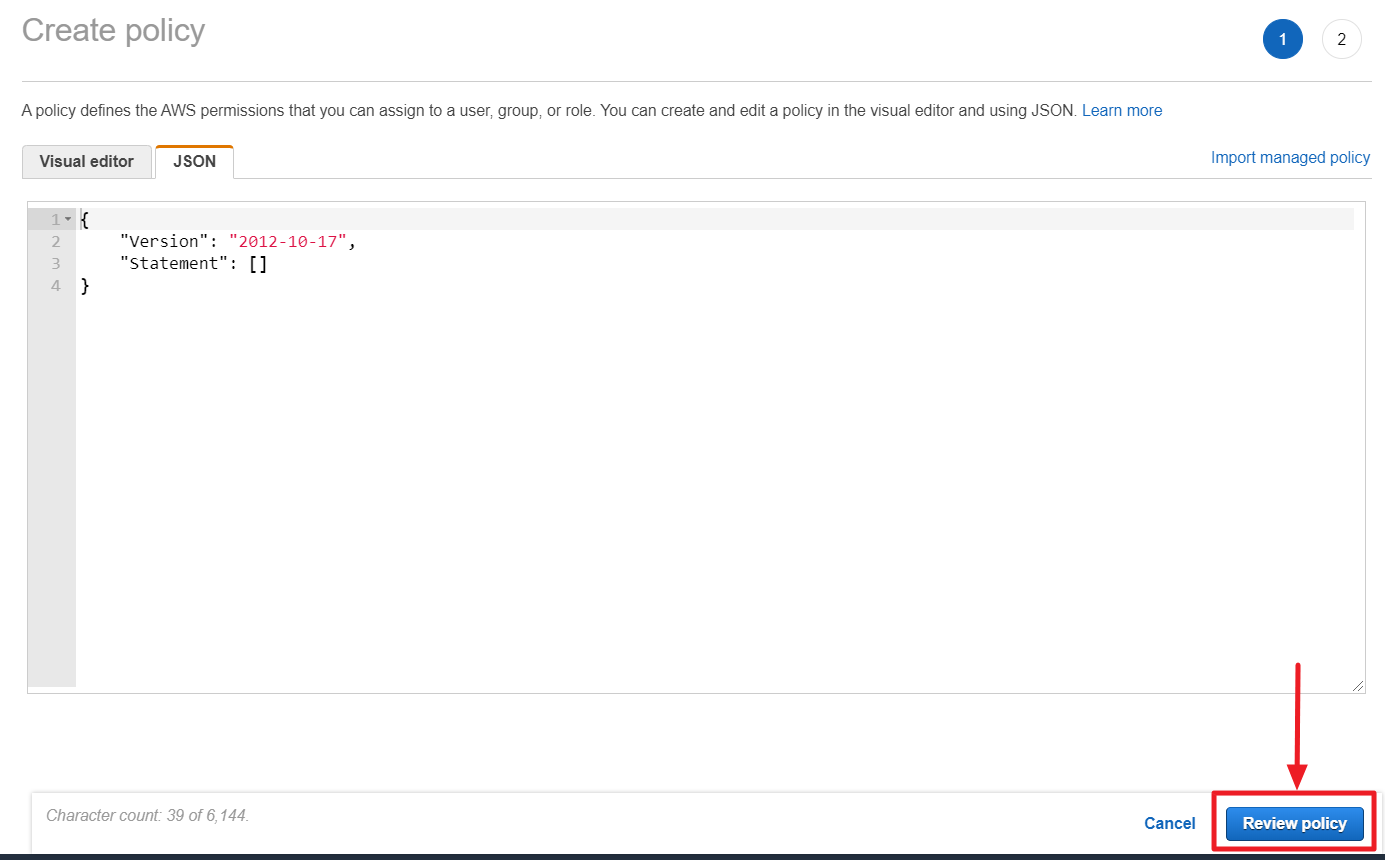
⑨ Click [Create policy] button after entering required values like name and description.
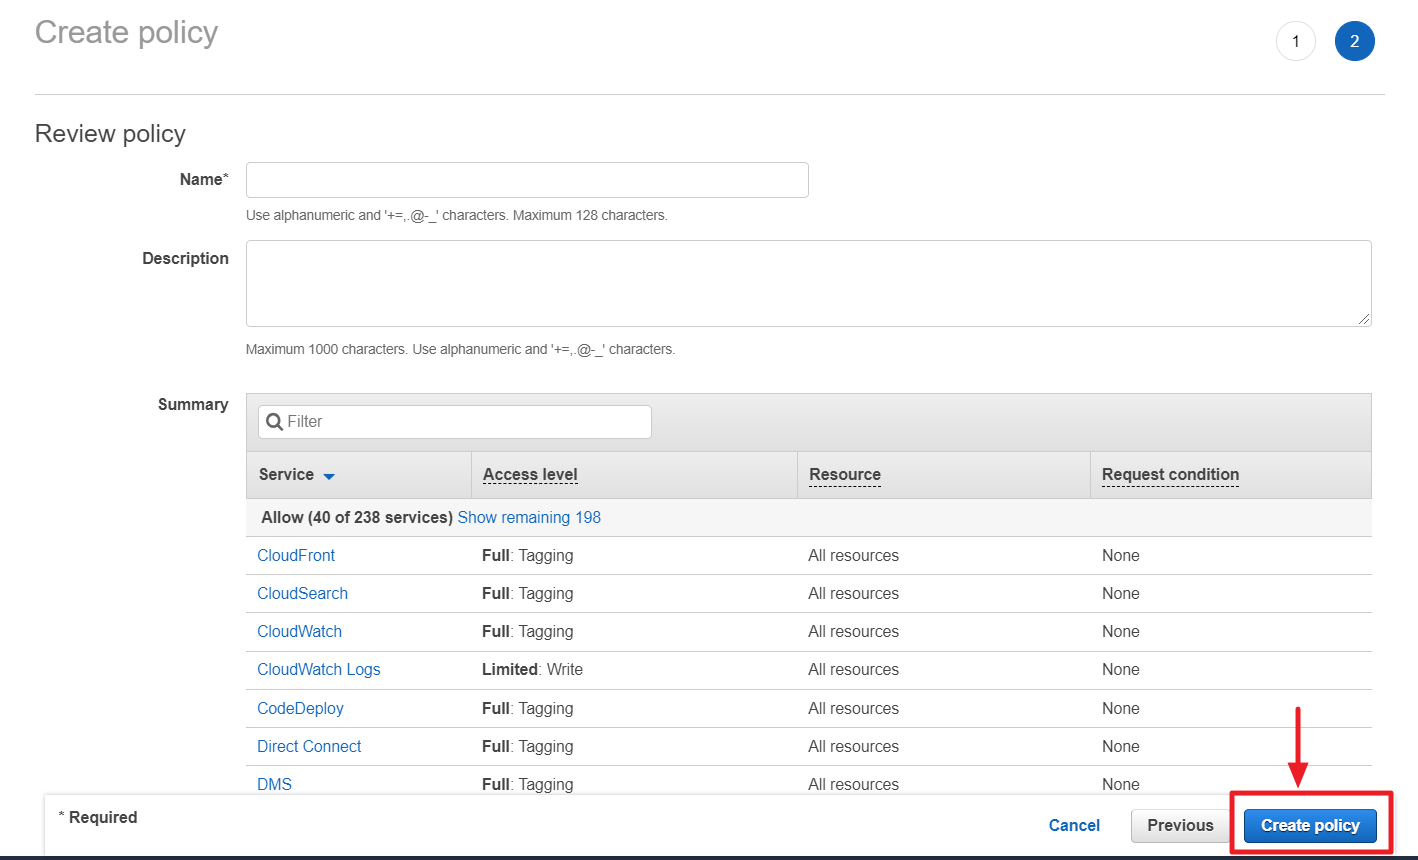
Cross-Account Access
① Copy a ROLE NAME of an account you want to grant permission from Service Portal > Cloud Account > Cross-Account Access tab.
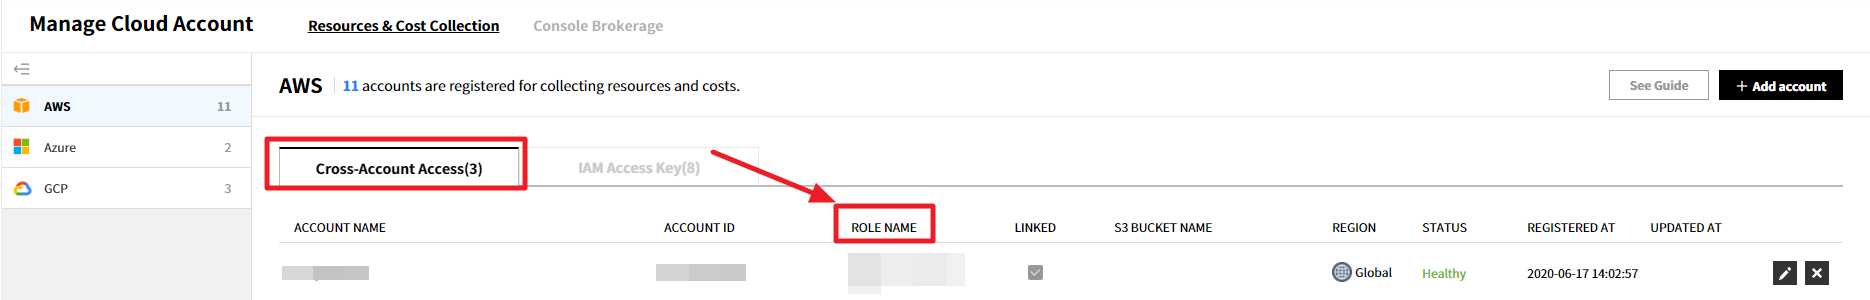
② Click Roles in the left pane of the IAM menu in the AWS Management Console.
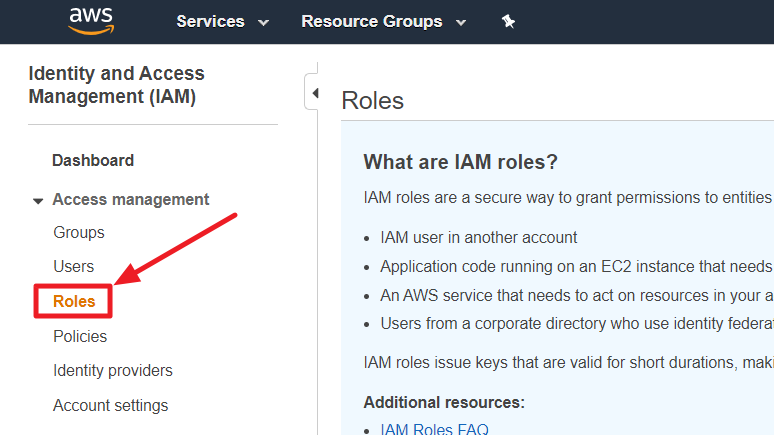
③ Search a user by using the ROLE NAME copied from Service Portal.
④ Select a role from the list and click the [Attach policies].
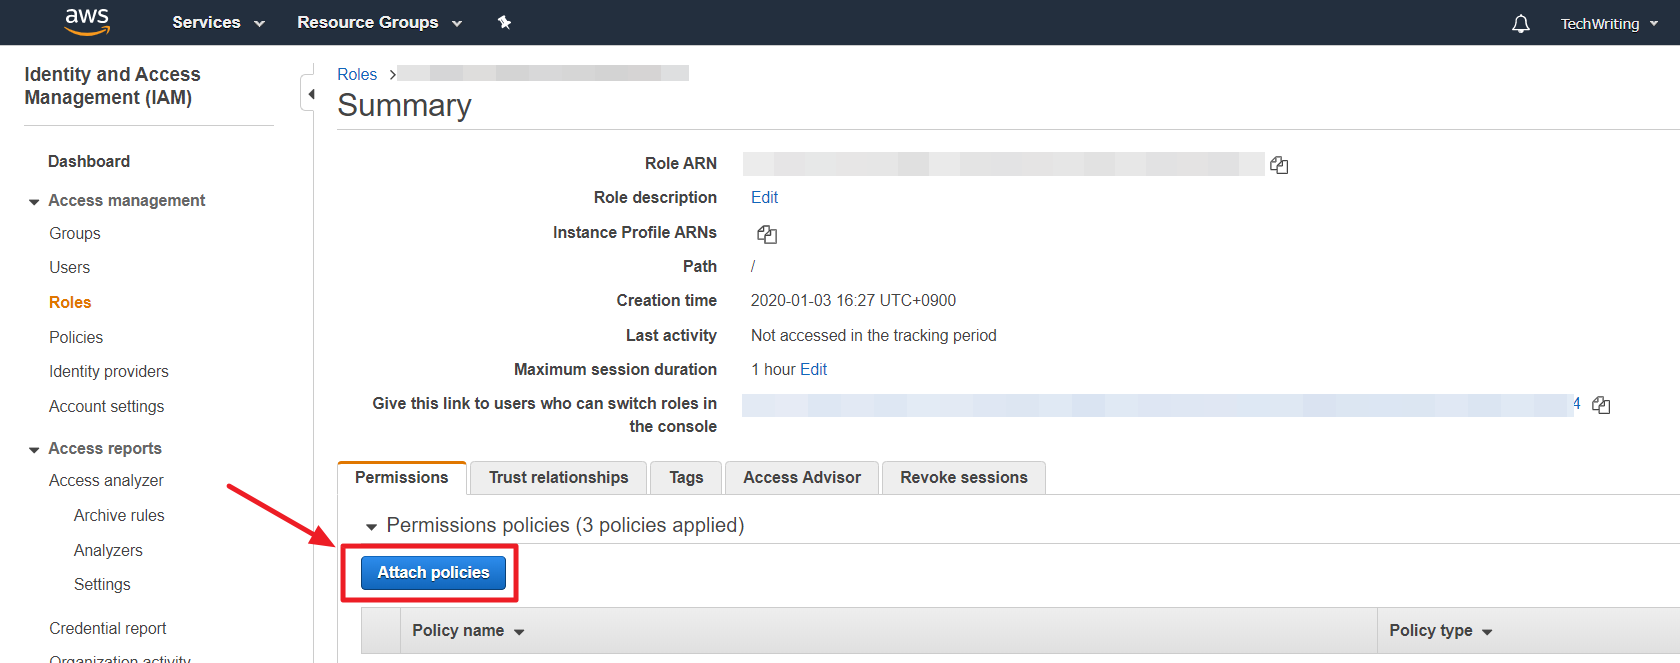
⑤ In Attach Permission page, select [Create policy].
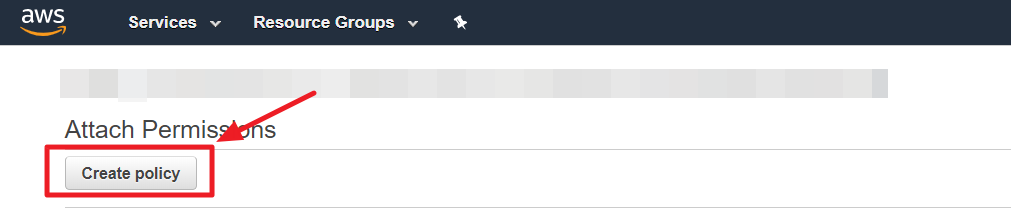
⑥ In Create Policy page, choose JSON tab.
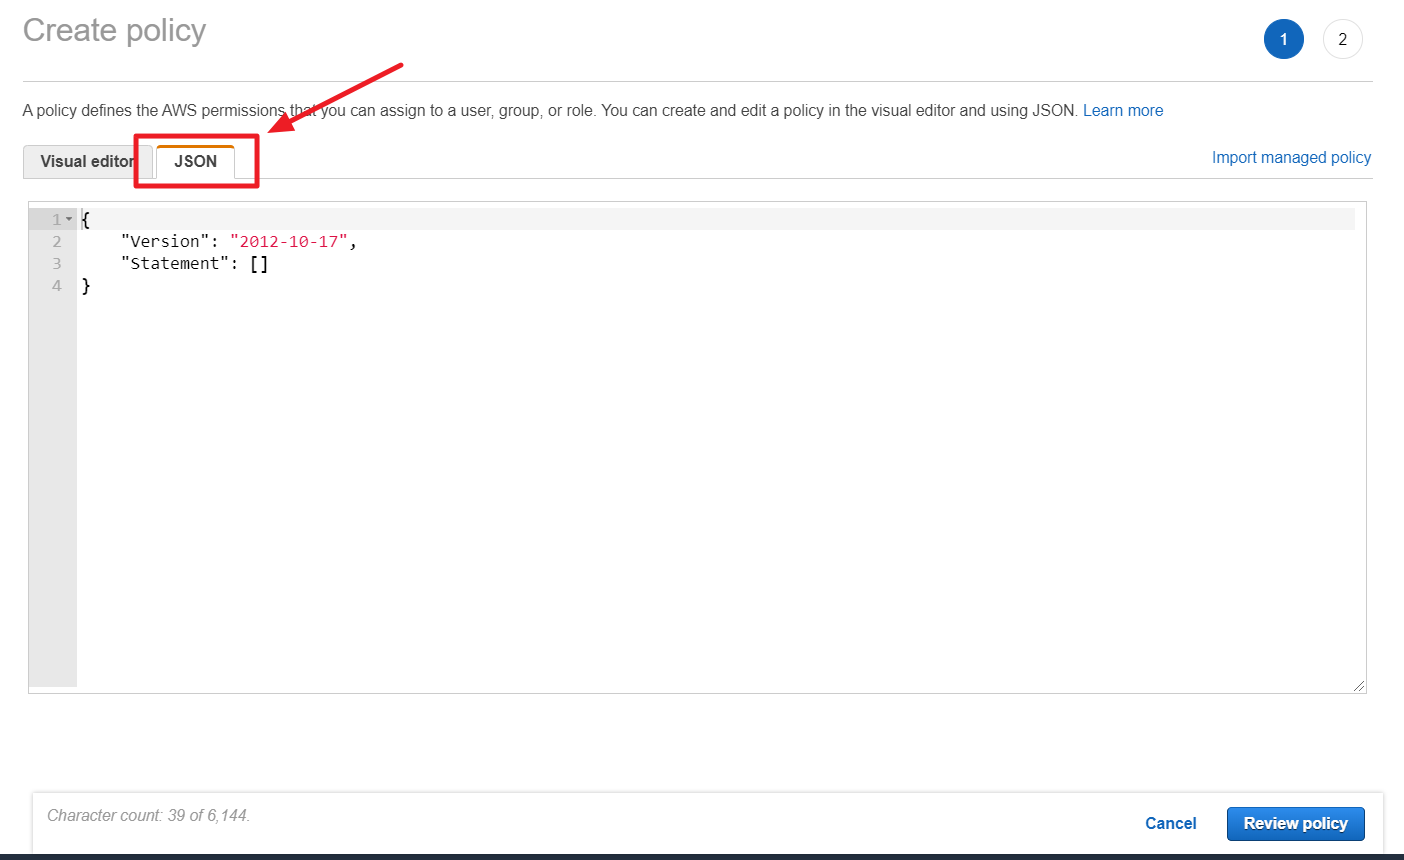
⑦ In Tag Assistant console, click the [Permission Settings] and then copy the JSON policy statement from the pop-up window.
⑧ Paste the copied JSON data to the JSON tab in the AWS Console and click the [Review Policy] button.
⑨ Click [Create policy] button after entering required values like name and description.
Azure Permissions
To add tags to Microsoft Azure resources using the Tag Assistant, you need to first add the permissions to manage tags in the console.
① Access the Azure Portal and click Subscriptions.
② Click the subscription name.
③ Click Access control (IAM) in the left menu, then click the +Add button in the top left corner to select Add custome role.
④ Enter a custom role name, and leave the baseline permissions at the default value of Start from scratch.
⑤ On the JSON tab, click the [Edit] button in the upper right corner and copy and paste the code below into the following part ("actions" : [Paste code here]).
⑥ Click the [Save] button on the top right and the [Review+Create] button on the bottom left.
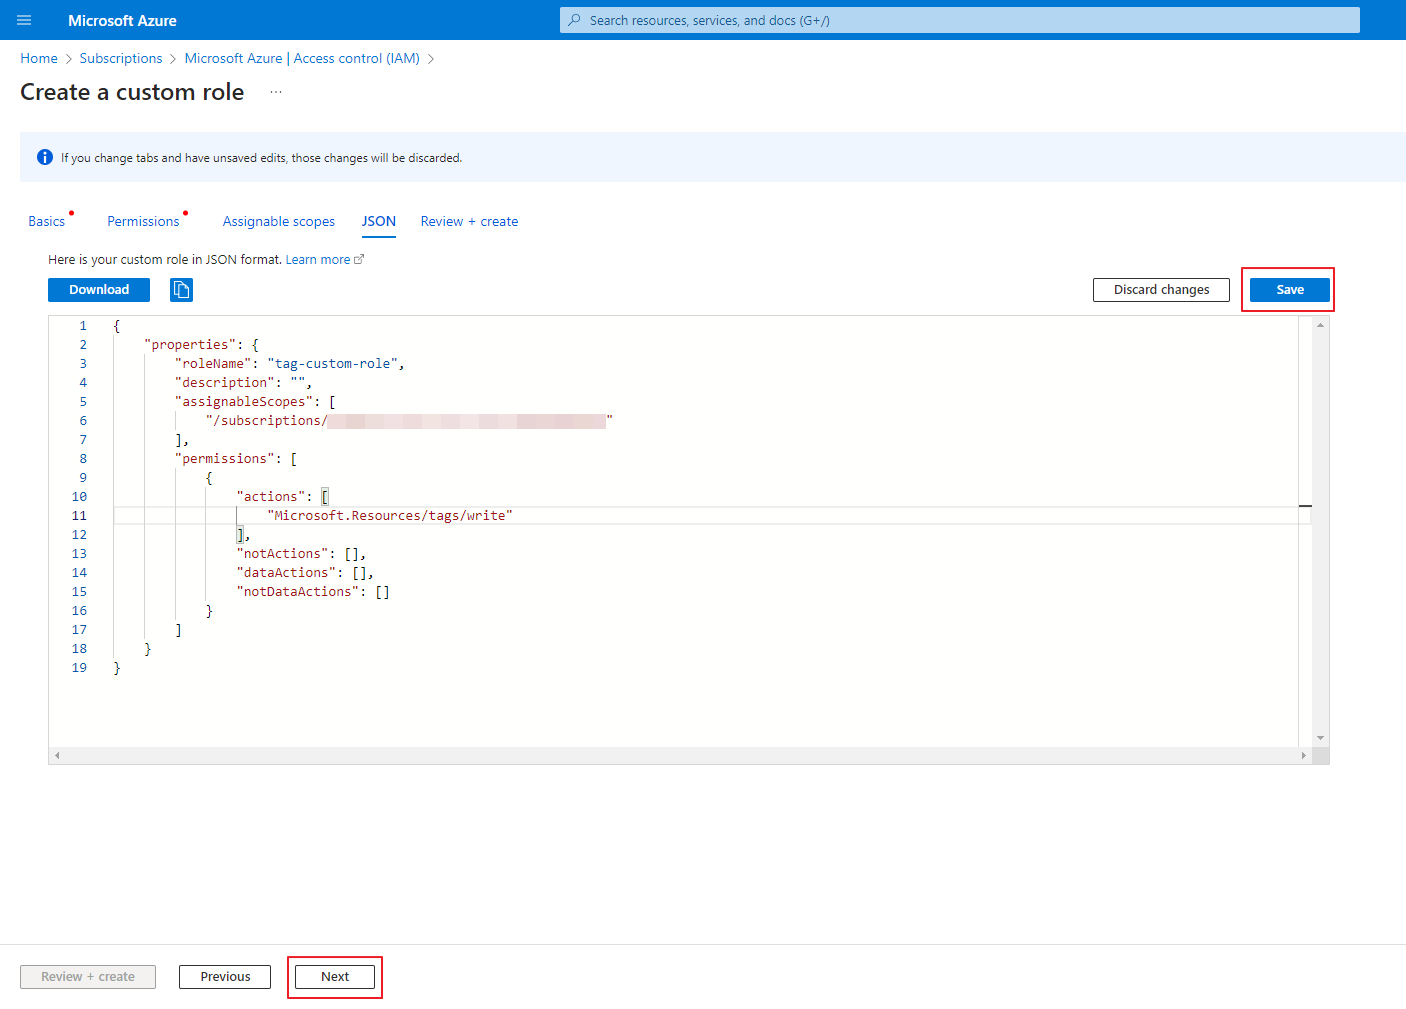
⑦ On the Access Control (IAM) screen, click the +Add button in the upper left corner and select Add role assignment.
⑧ On the Role tab, search for and click the name of the role you created, then click the [Next] button in the lower right corner.
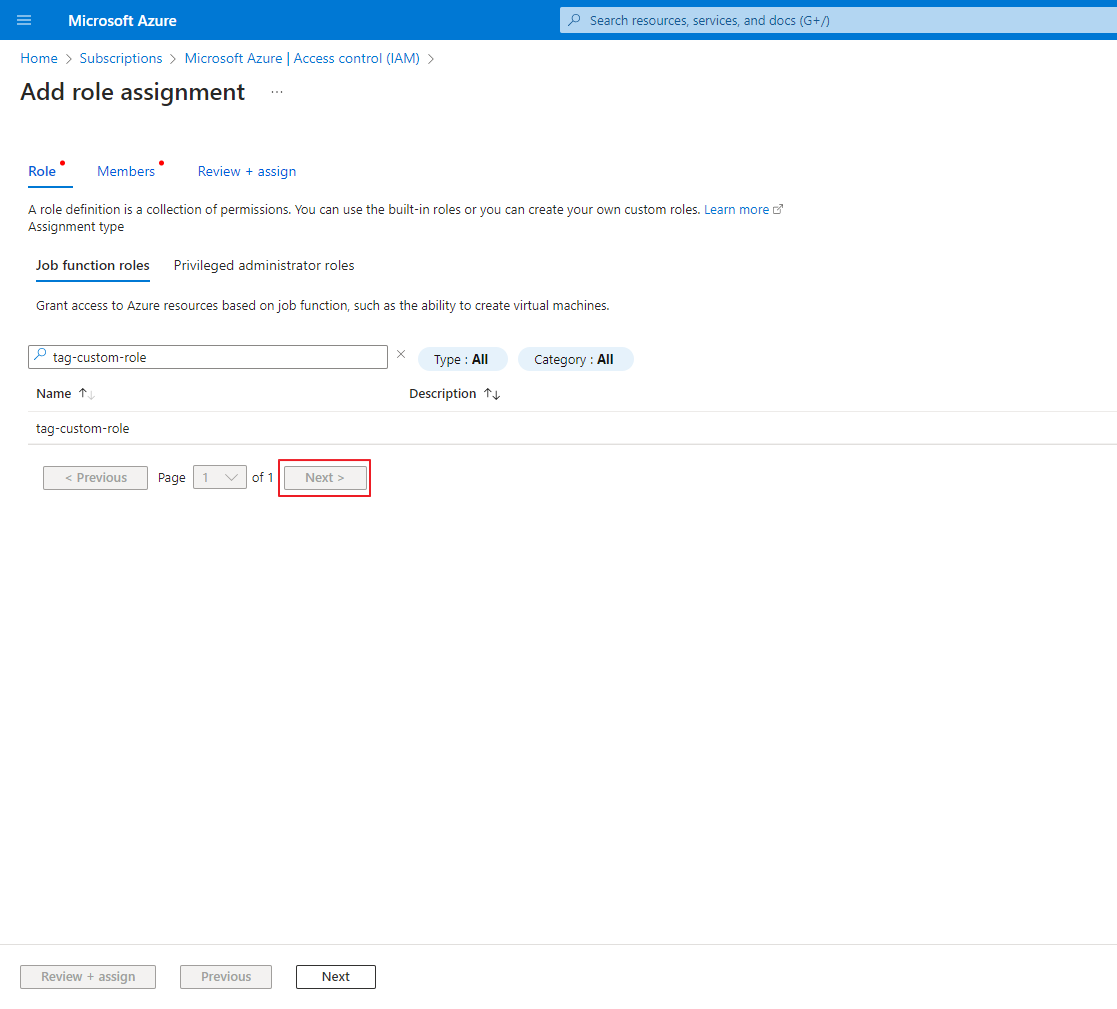
⑨ On the Members tab, assign access to: User, group, or service principal, then click the +Select members button for Members. In the right wing, select the app to which you want to apply the custom role and click the [Select] button.
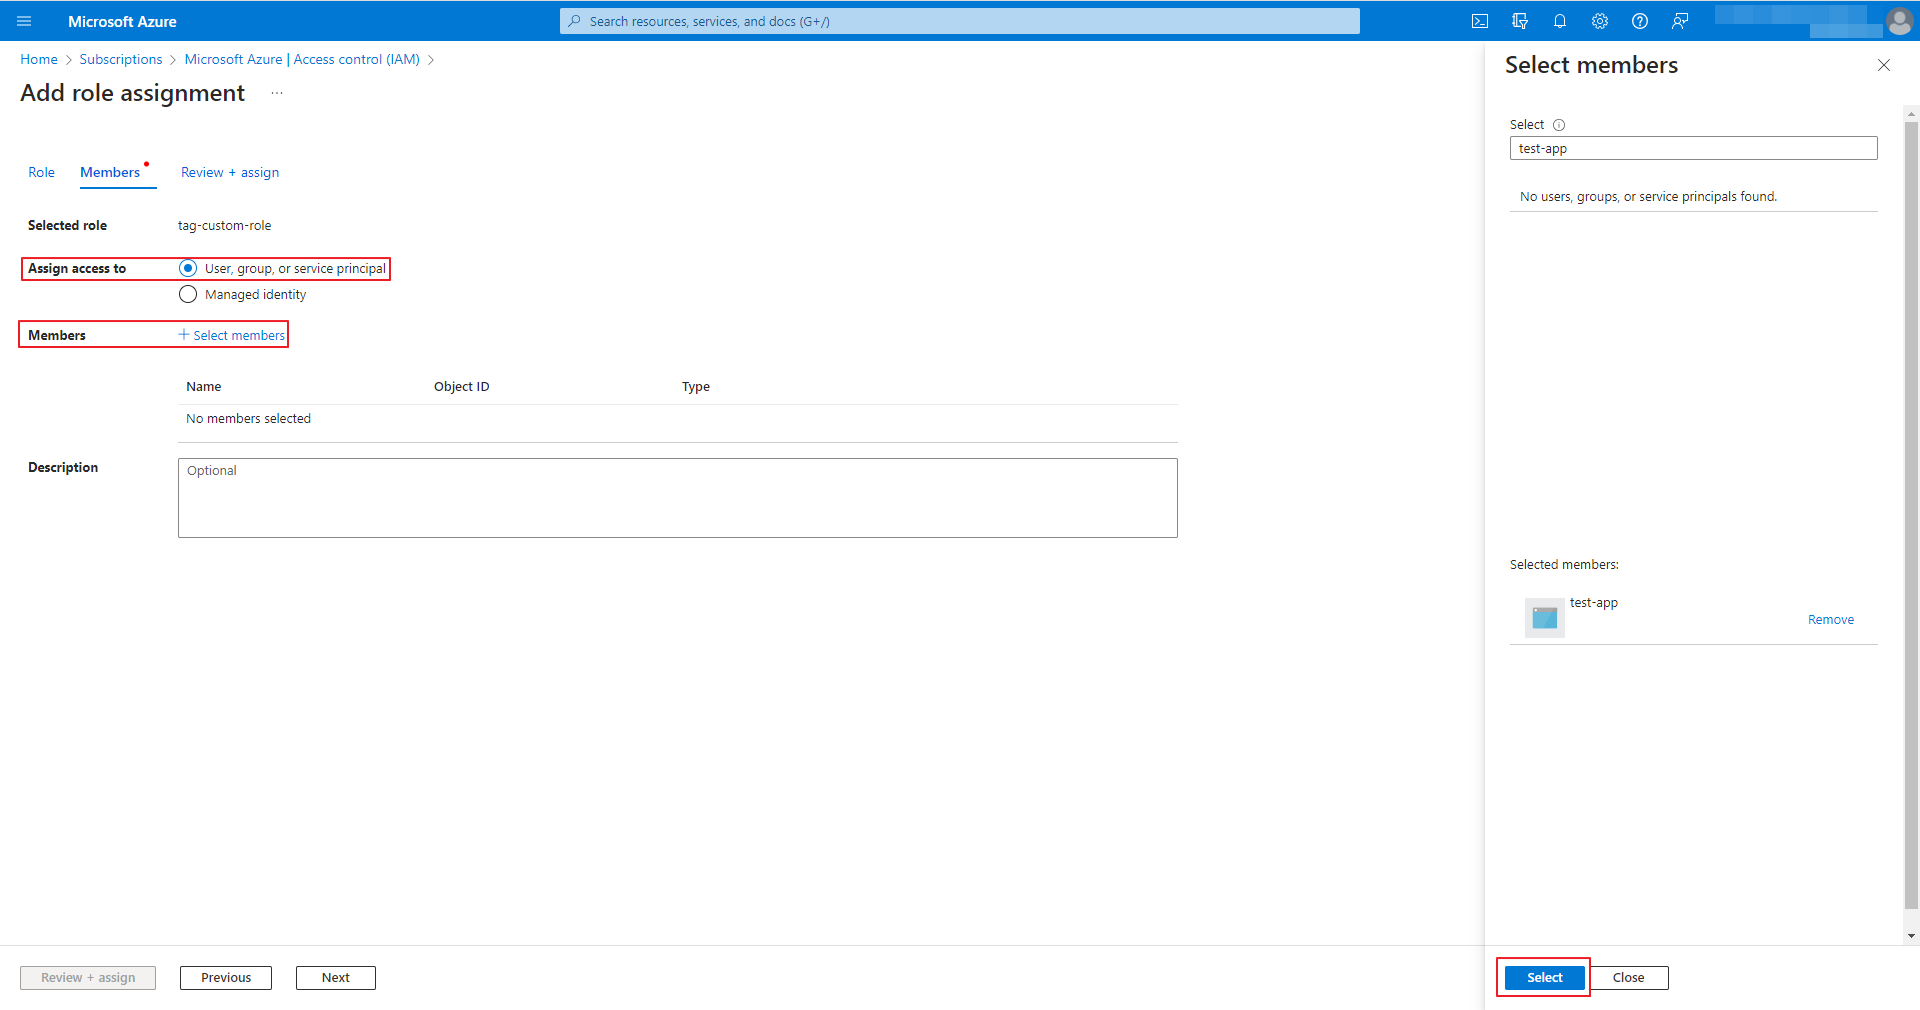
⑩ Click the [Review+Assign] button in the lower left corner of the screen.
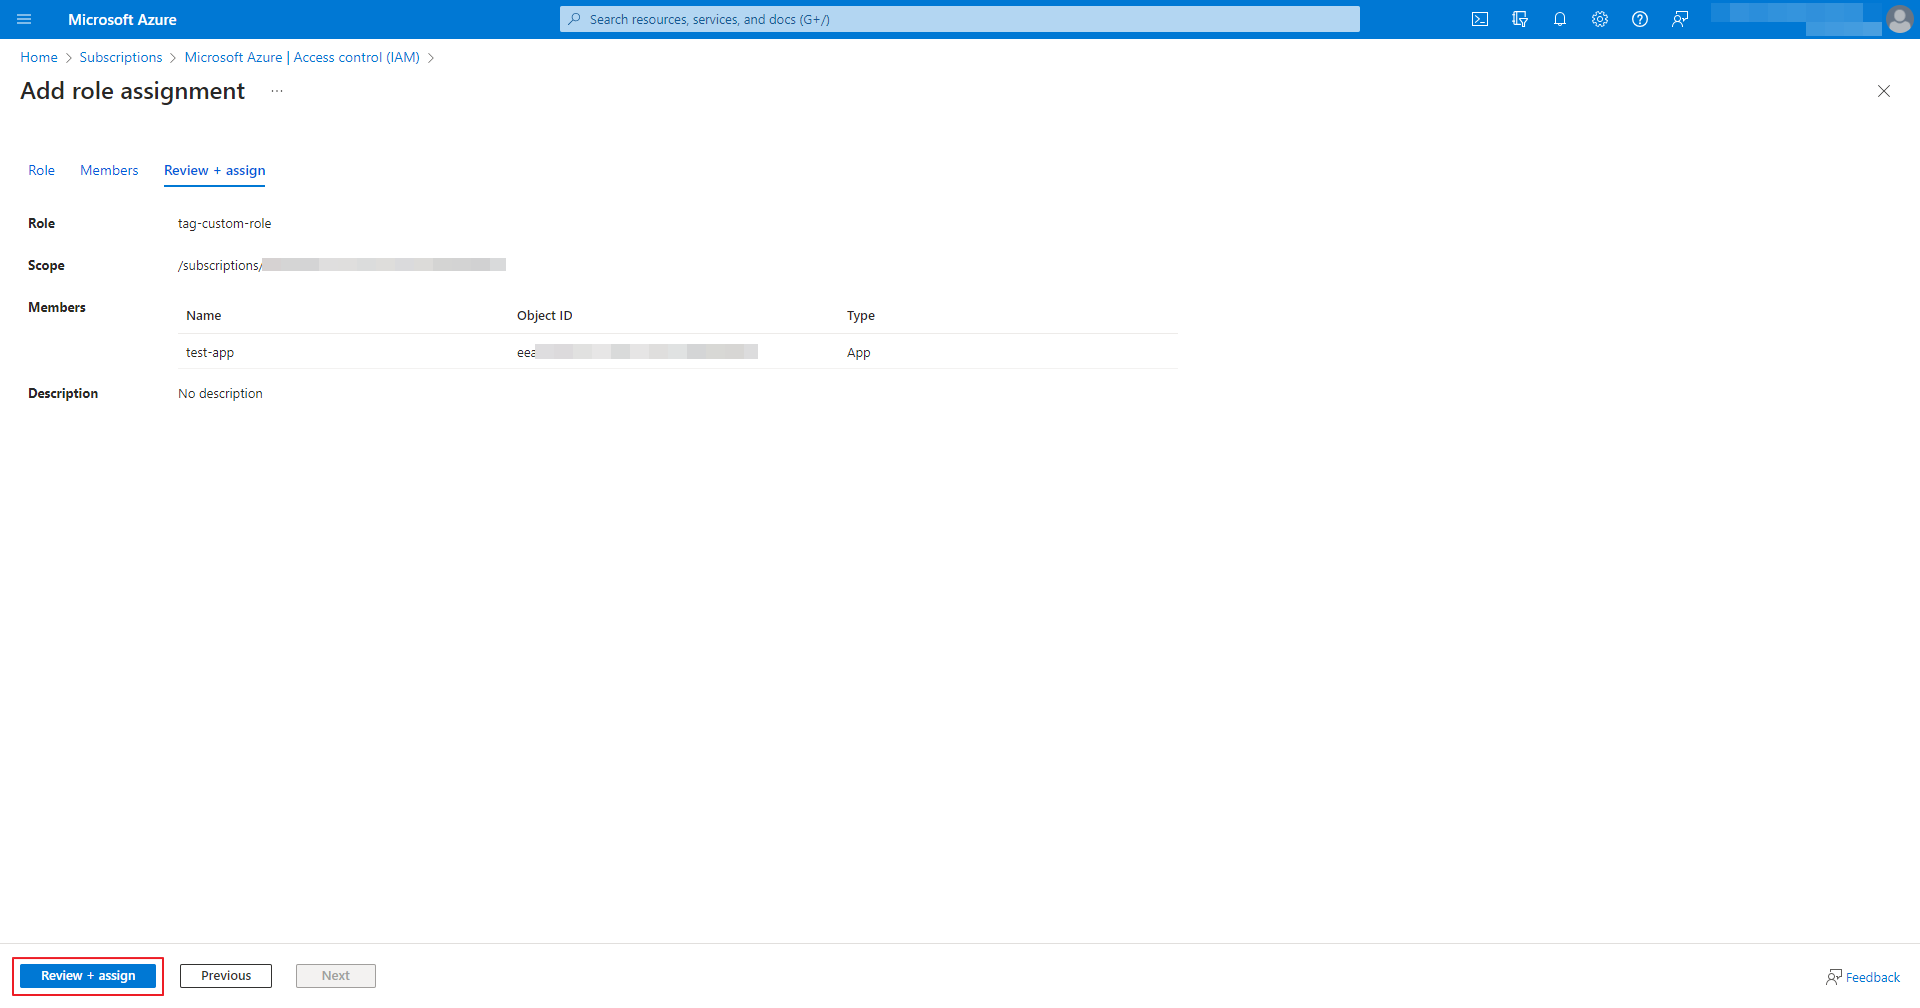
GCP Permissions
To add labels to Google Cloud resources through Tag Assistant, you must add permissions on the Google Cloud console first.
① Select GCP for the cloud service.
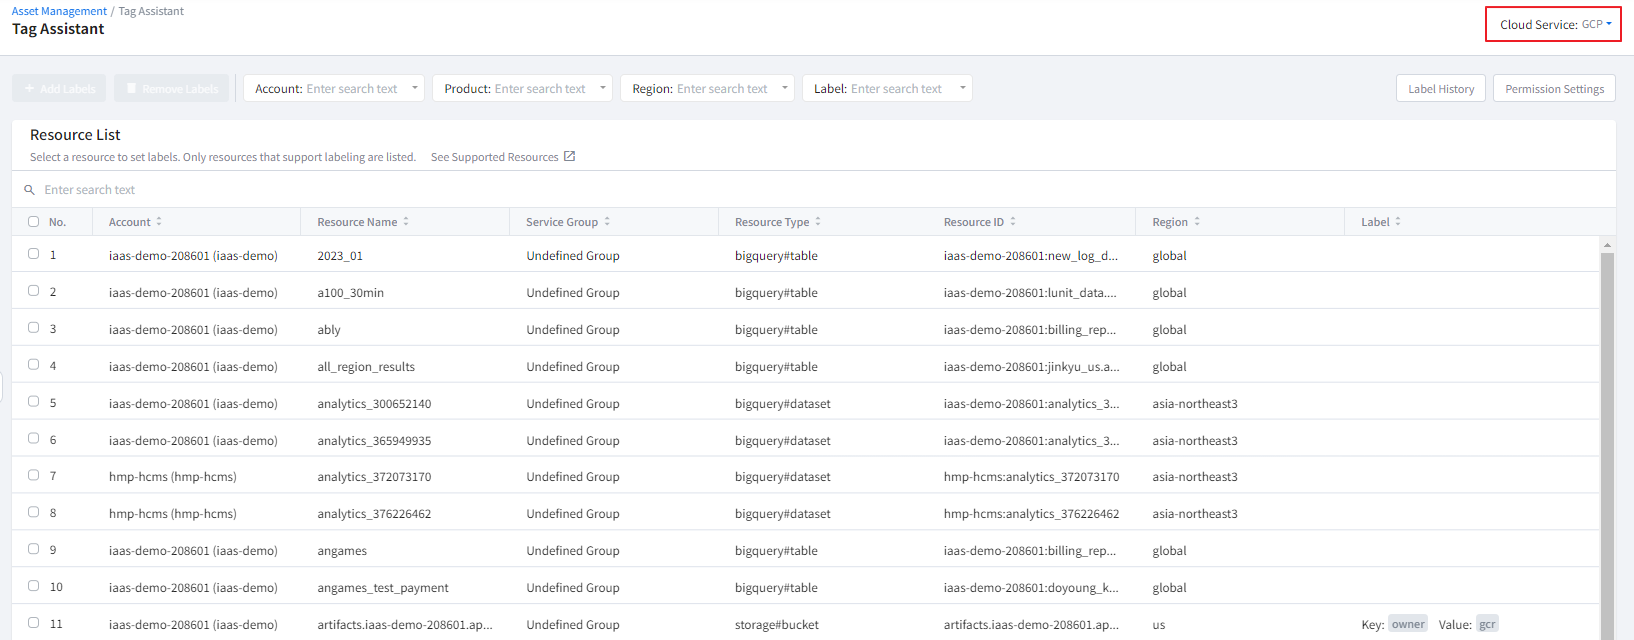
② Click [Permission Settings] on top right and check permissions to add.
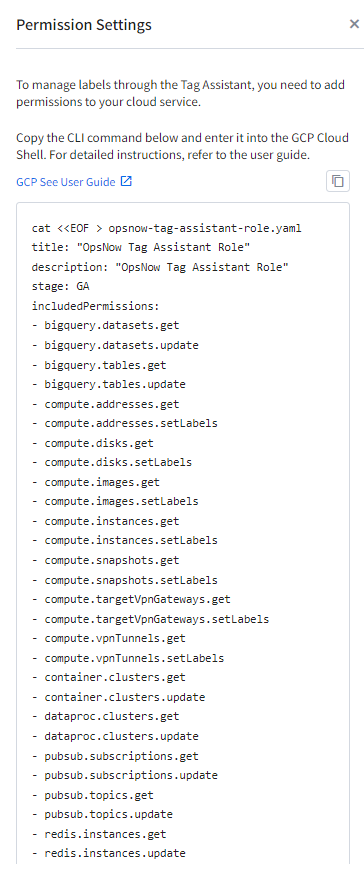
③ Access the GCP console in a new window and launch Cloud Shell.

④ Enter the following CLI command in Cloud Shell to add permission information.
                    cat <<EOF > opsnow-tag-assistant-role.yaml
                    title: "OpsNow Tag Assistant Role"
                    description: "OpsNow Tag Assistant Role"
                    stage: GA
                    includedPermissions:
                    - bigquery.datasets.get
                    - bigquery.datasets.update
                    - bigquery.tables.get
                    - bigquery.tables.update
                    - compute.addresses.get
                    - compute.addresses.setLabels
                    - compute.disks.get
                    - compute.disks.setLabels
                    - compute.images.get
                    - compute.images.setLabels
                    - compute.instances.get
                    - compute.instances.setLabels
                    - compute.snapshots.get
                    - compute.snapshots.setLabels
                    - compute.targetVpnGateways.get
                    - compute.targetVpnGateways.setLabels
                    - compute.vpnTunnels.get
                    - compute.vpnTunnels.setLabels
                    - container.clusters.get
                    - container.clusters.update
                    - dataproc.clusters.get
                    - dataproc.clusters.update
                    - pubsub.subscriptions.get
                    - pubsub.subscriptions.update
                    - pubsub.topics.get
                    - pubsub.topics.update
                    - redis.instances.get
                    - redis.instances.update
                    - storage.buckets.get
                    - storage.buckets.update
                    EOF
⑤ Enter the following CLI command to create IAM roles.
                    gcloud iam roles create opsnow_tag_assistant --project=$(gcloud config get-value project) --file=opsnow-tag-assistant-role.yaml
                    rm opsnow-tag-assistant-role.yaml
⑥ Click the [Authorize] button in the Cloud Shell authorization popup window.
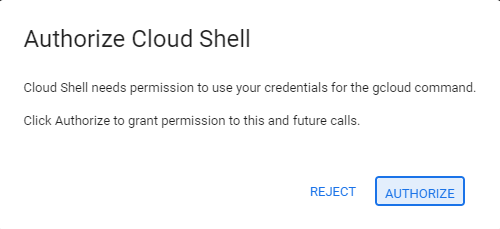
⑦ Go to the Roles menu under the IAM & Admin tab to verify the created Tag Assistant role.
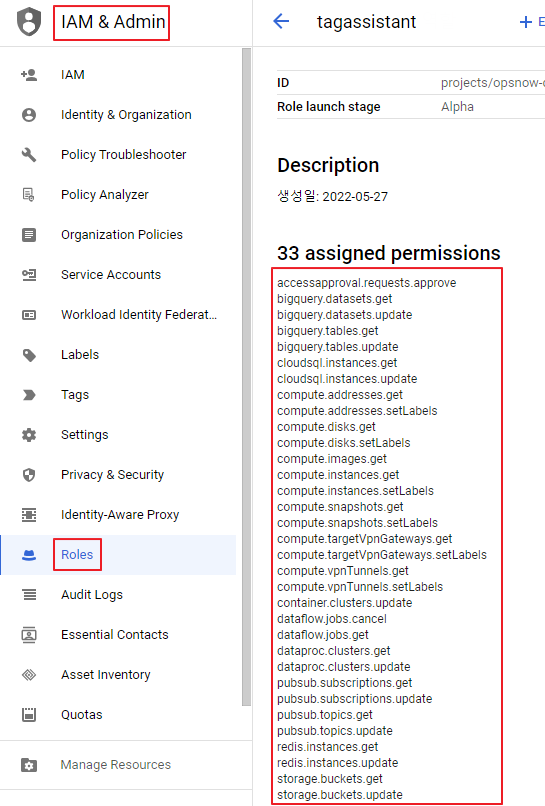
⑧ Click Service Accounts under the IAM & Admin tab and copy the Email address registered on OpsNow.
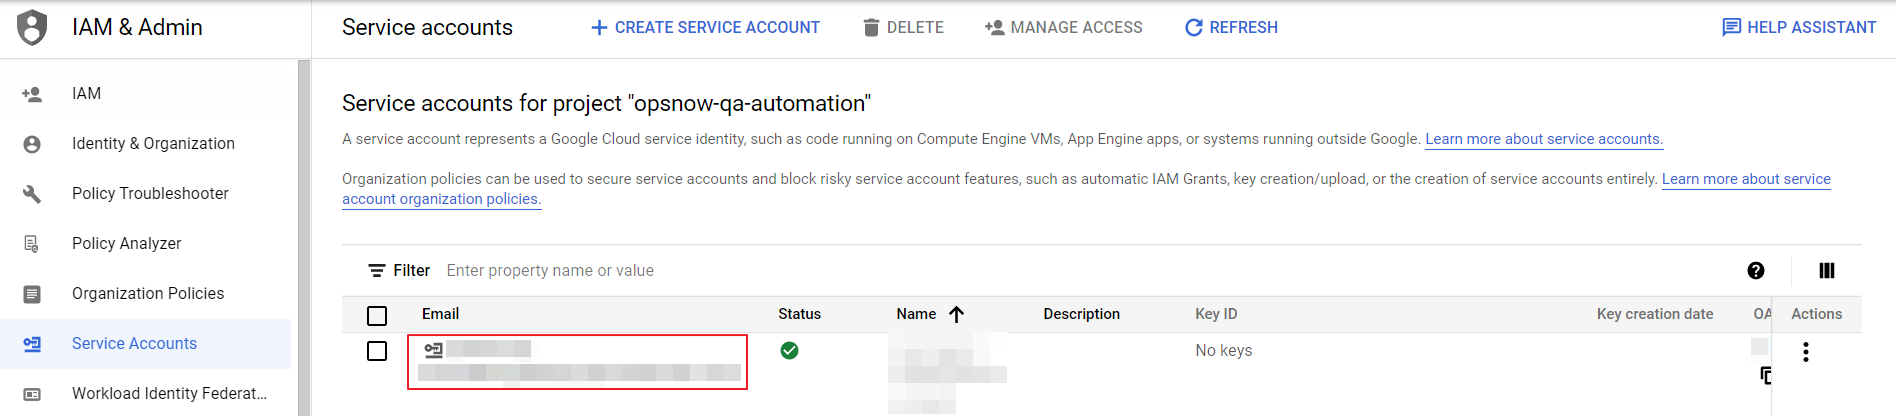
⑨ Click Manage Resources on bottom left, select the account registered on OpsNow and click [ADD PRINCIPAL] from the page unfolded on the right.
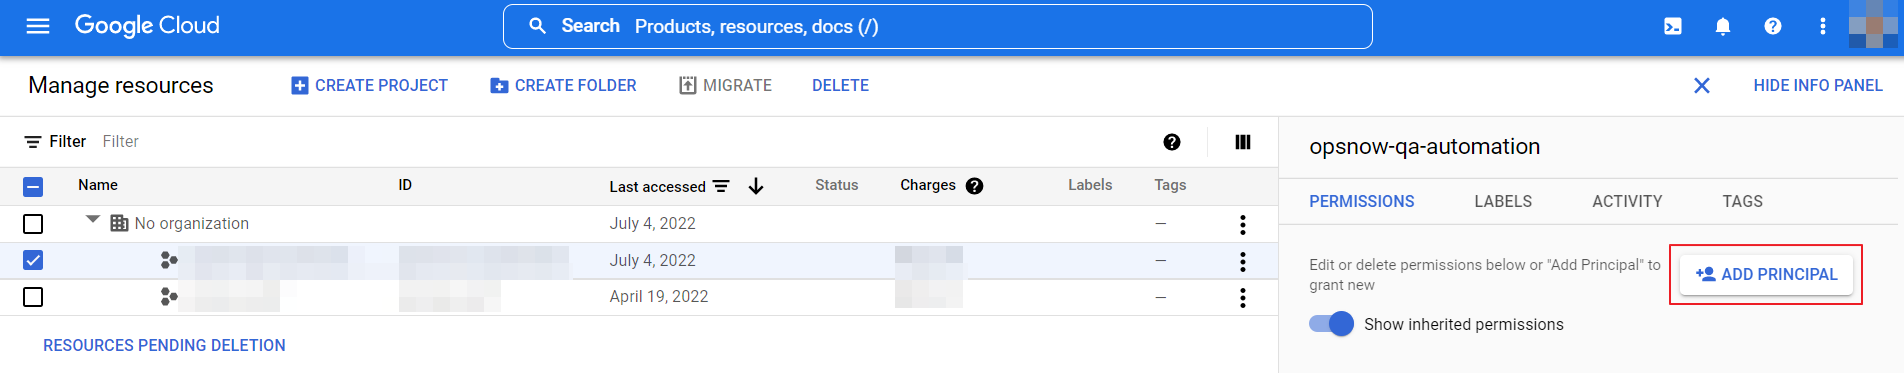
⑩ Paste the copied Email address in the New principals field, click the Select a role field below and select the role you created in Step 4-7 from the Custom filter.
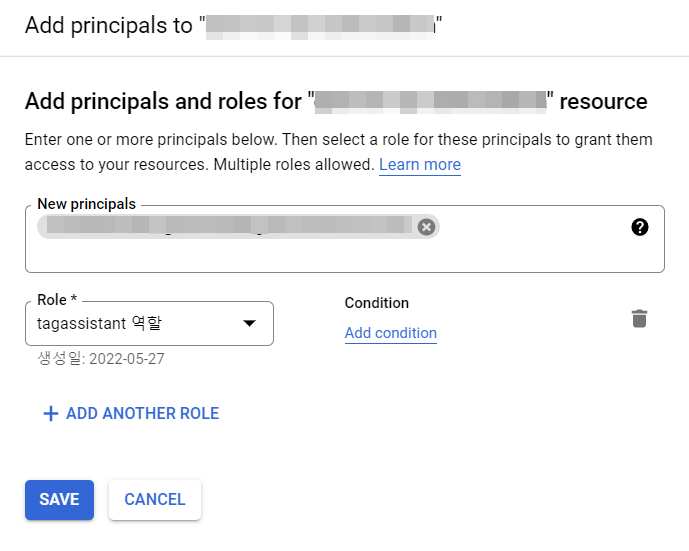
⑪ Click [Save] to have the permissions added.
Add and Remove Tags
Add Tags
① First, select your desired cloud service from the dropdown menu in the top right corner of the page, and then choose the resources to which you want to add tags from the list.
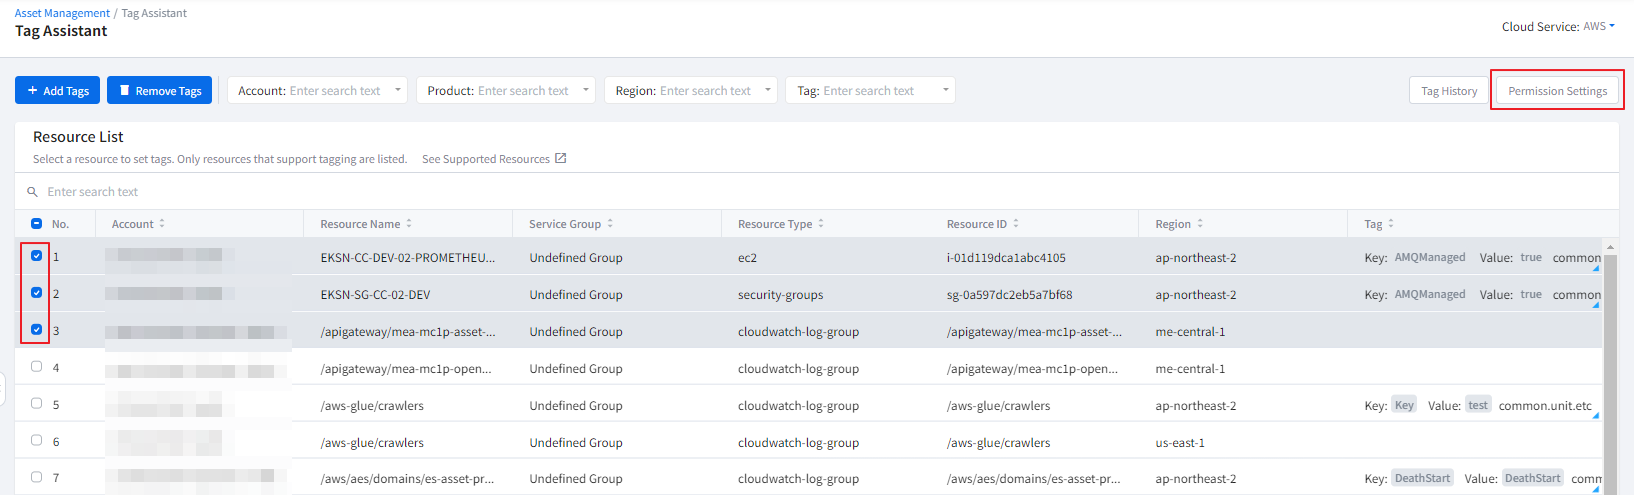
② Click the [+Add Tags] button in the top left corner.
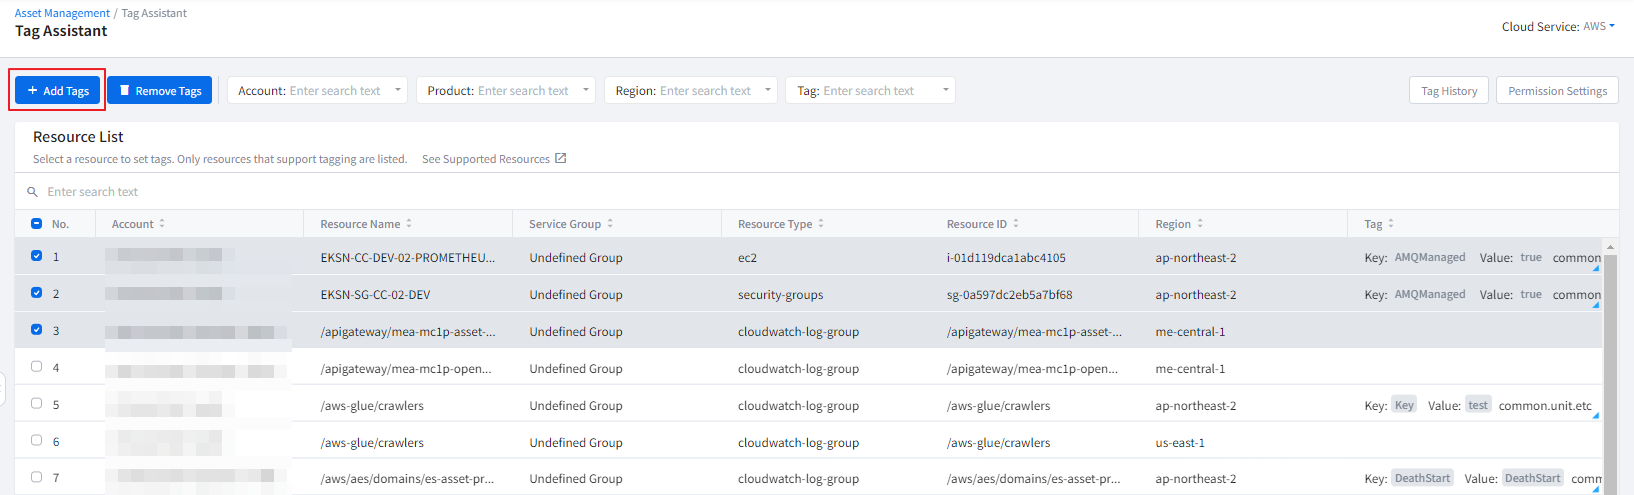
③ When the Add Tags pop-up appears, click the [Apply] button after selecting Tag Key and Tag Value. You can either add an existing tag key/value or a new tag key/value.
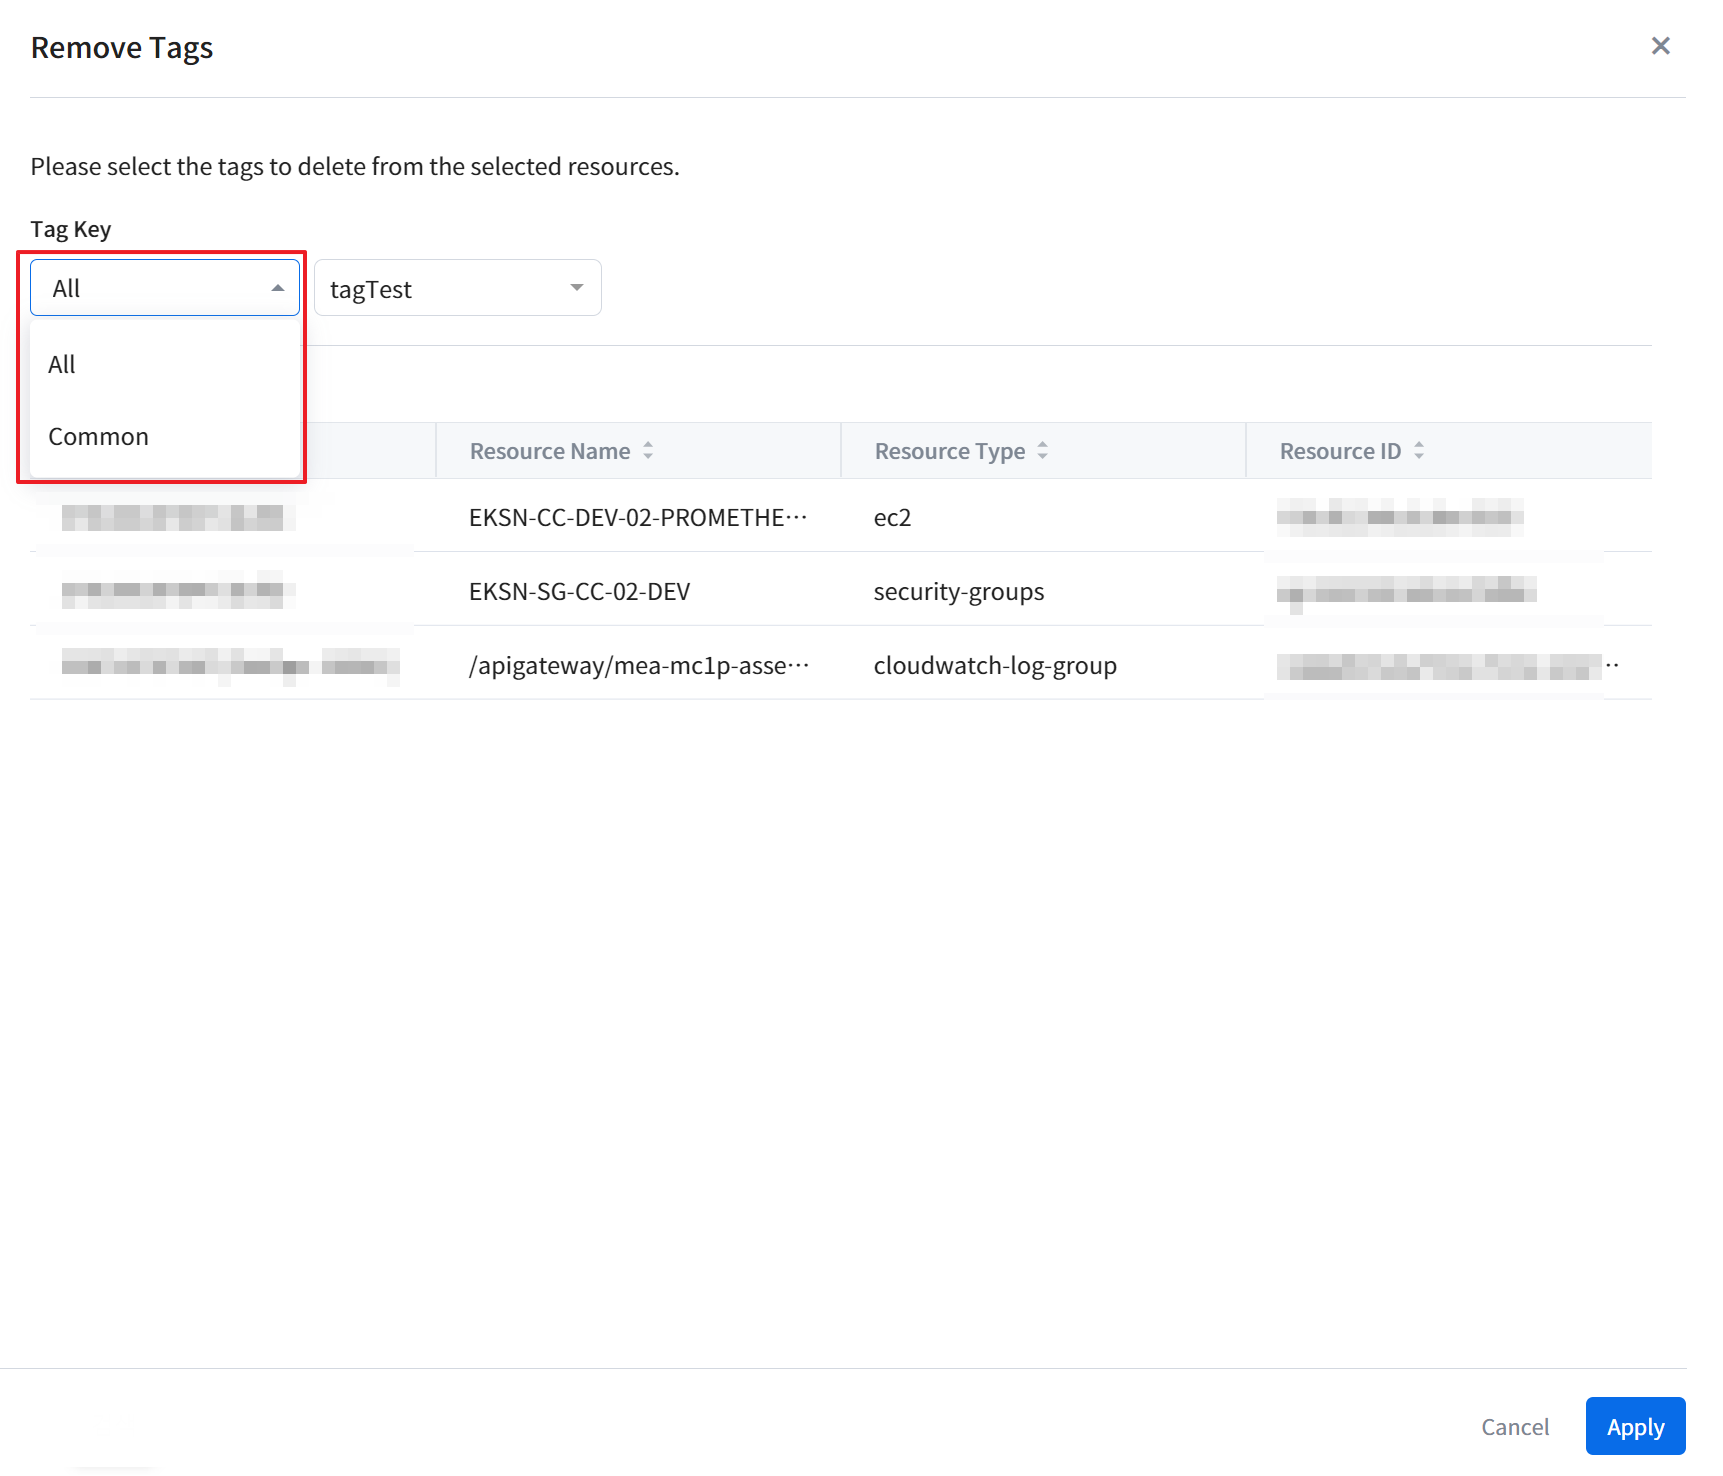
📌 Attention: Requirements for GCP tags
Unlike AWS, GCP resources have requirements for tag keys and values. Therefore, if you wish to add new tag keys and values to GCP resources, they must meet the following requirements.
• Each resource can have multiple tags, up to a maximum of 64.
• Keys have a minimum length of 1 character and a maximum length of 42 characters, and cannot be empty. Values can be empty, and have a maximum length of 42 characters.
• Keys and values can contain only lowercase alphabets, international characters (Korean, Chinese, Japanese, German, French, Spanish and Portuguese characters using UTF-8 enconding), numeric characters, underscores and hyphens.
• Keys must start with a lowercase alphabet or international character.
Remove Tags
① Select resources to delete tags from the list and click the [Remove Tags button].
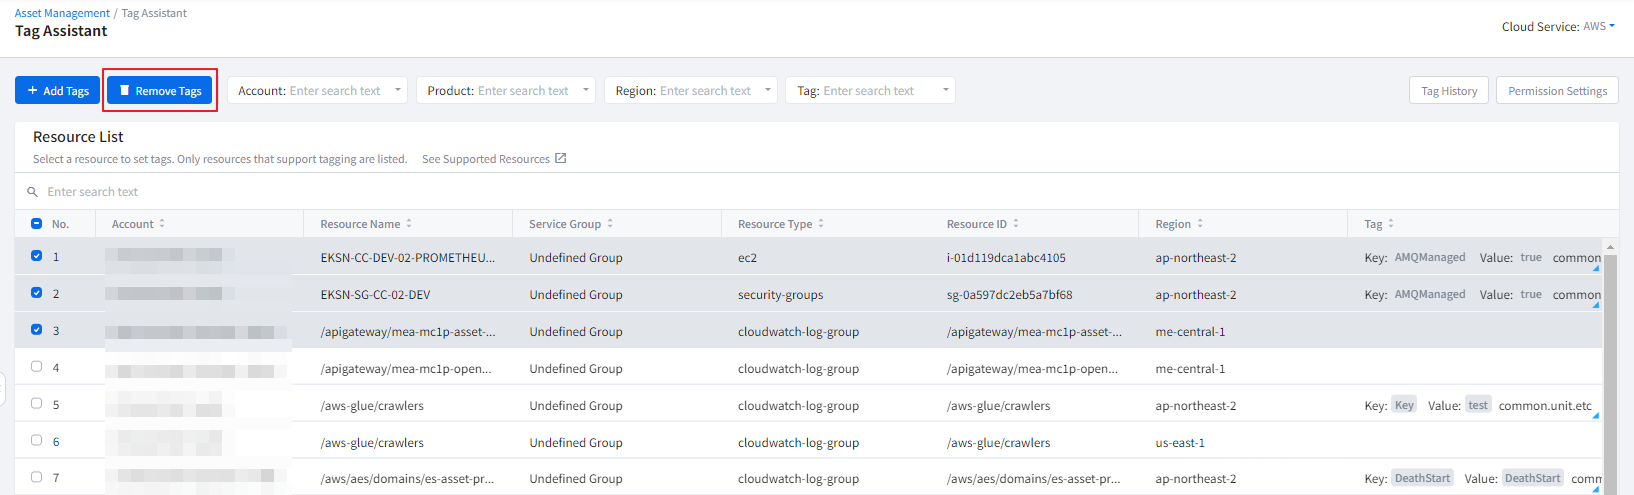
② When the Remove Tags pop-up appears, click the [Apply] button after selecting All or Common as a condition to delete tags.
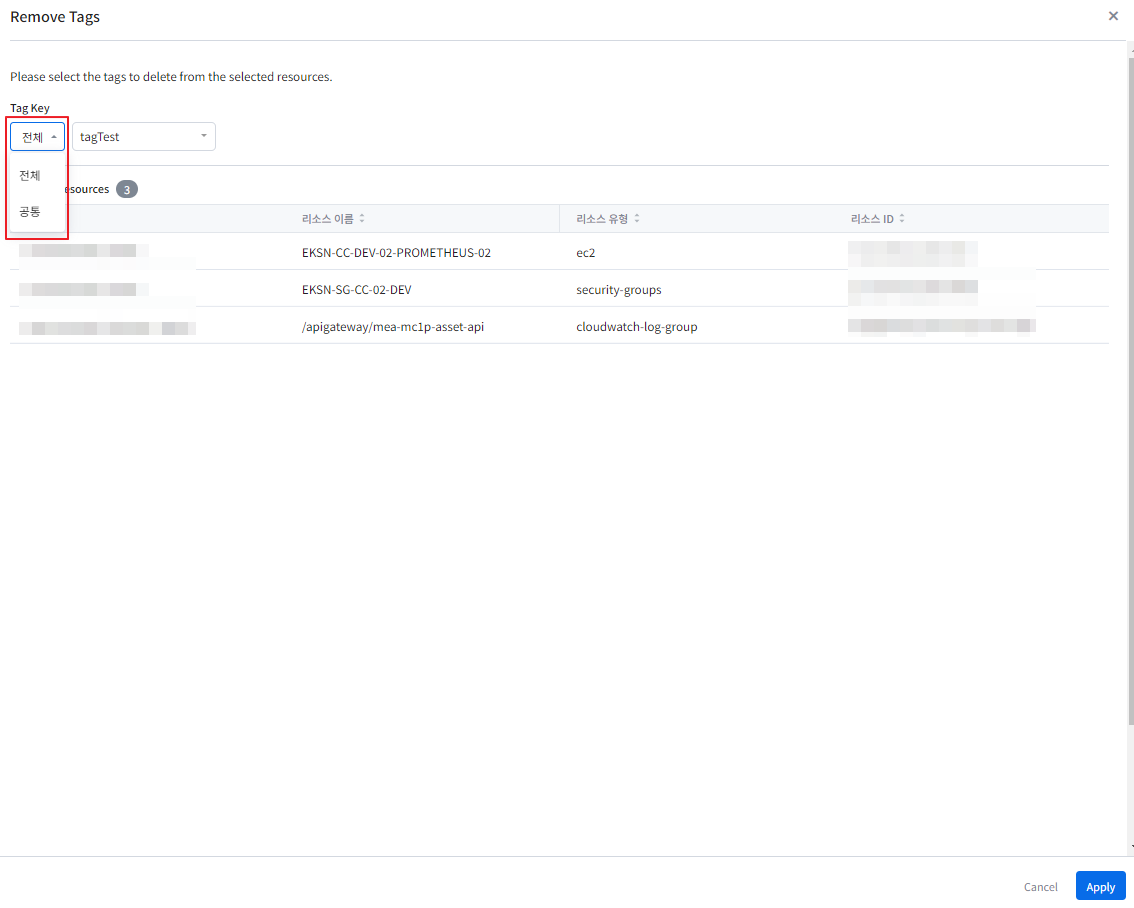
Tag History
Tag Assistant allows you to track when, where, what, and who added or deleted tags, and tagging resources was a success or failure. Click Tag History on the right corner to track all the logs, and the logs can be downloaded as Excel format as well.
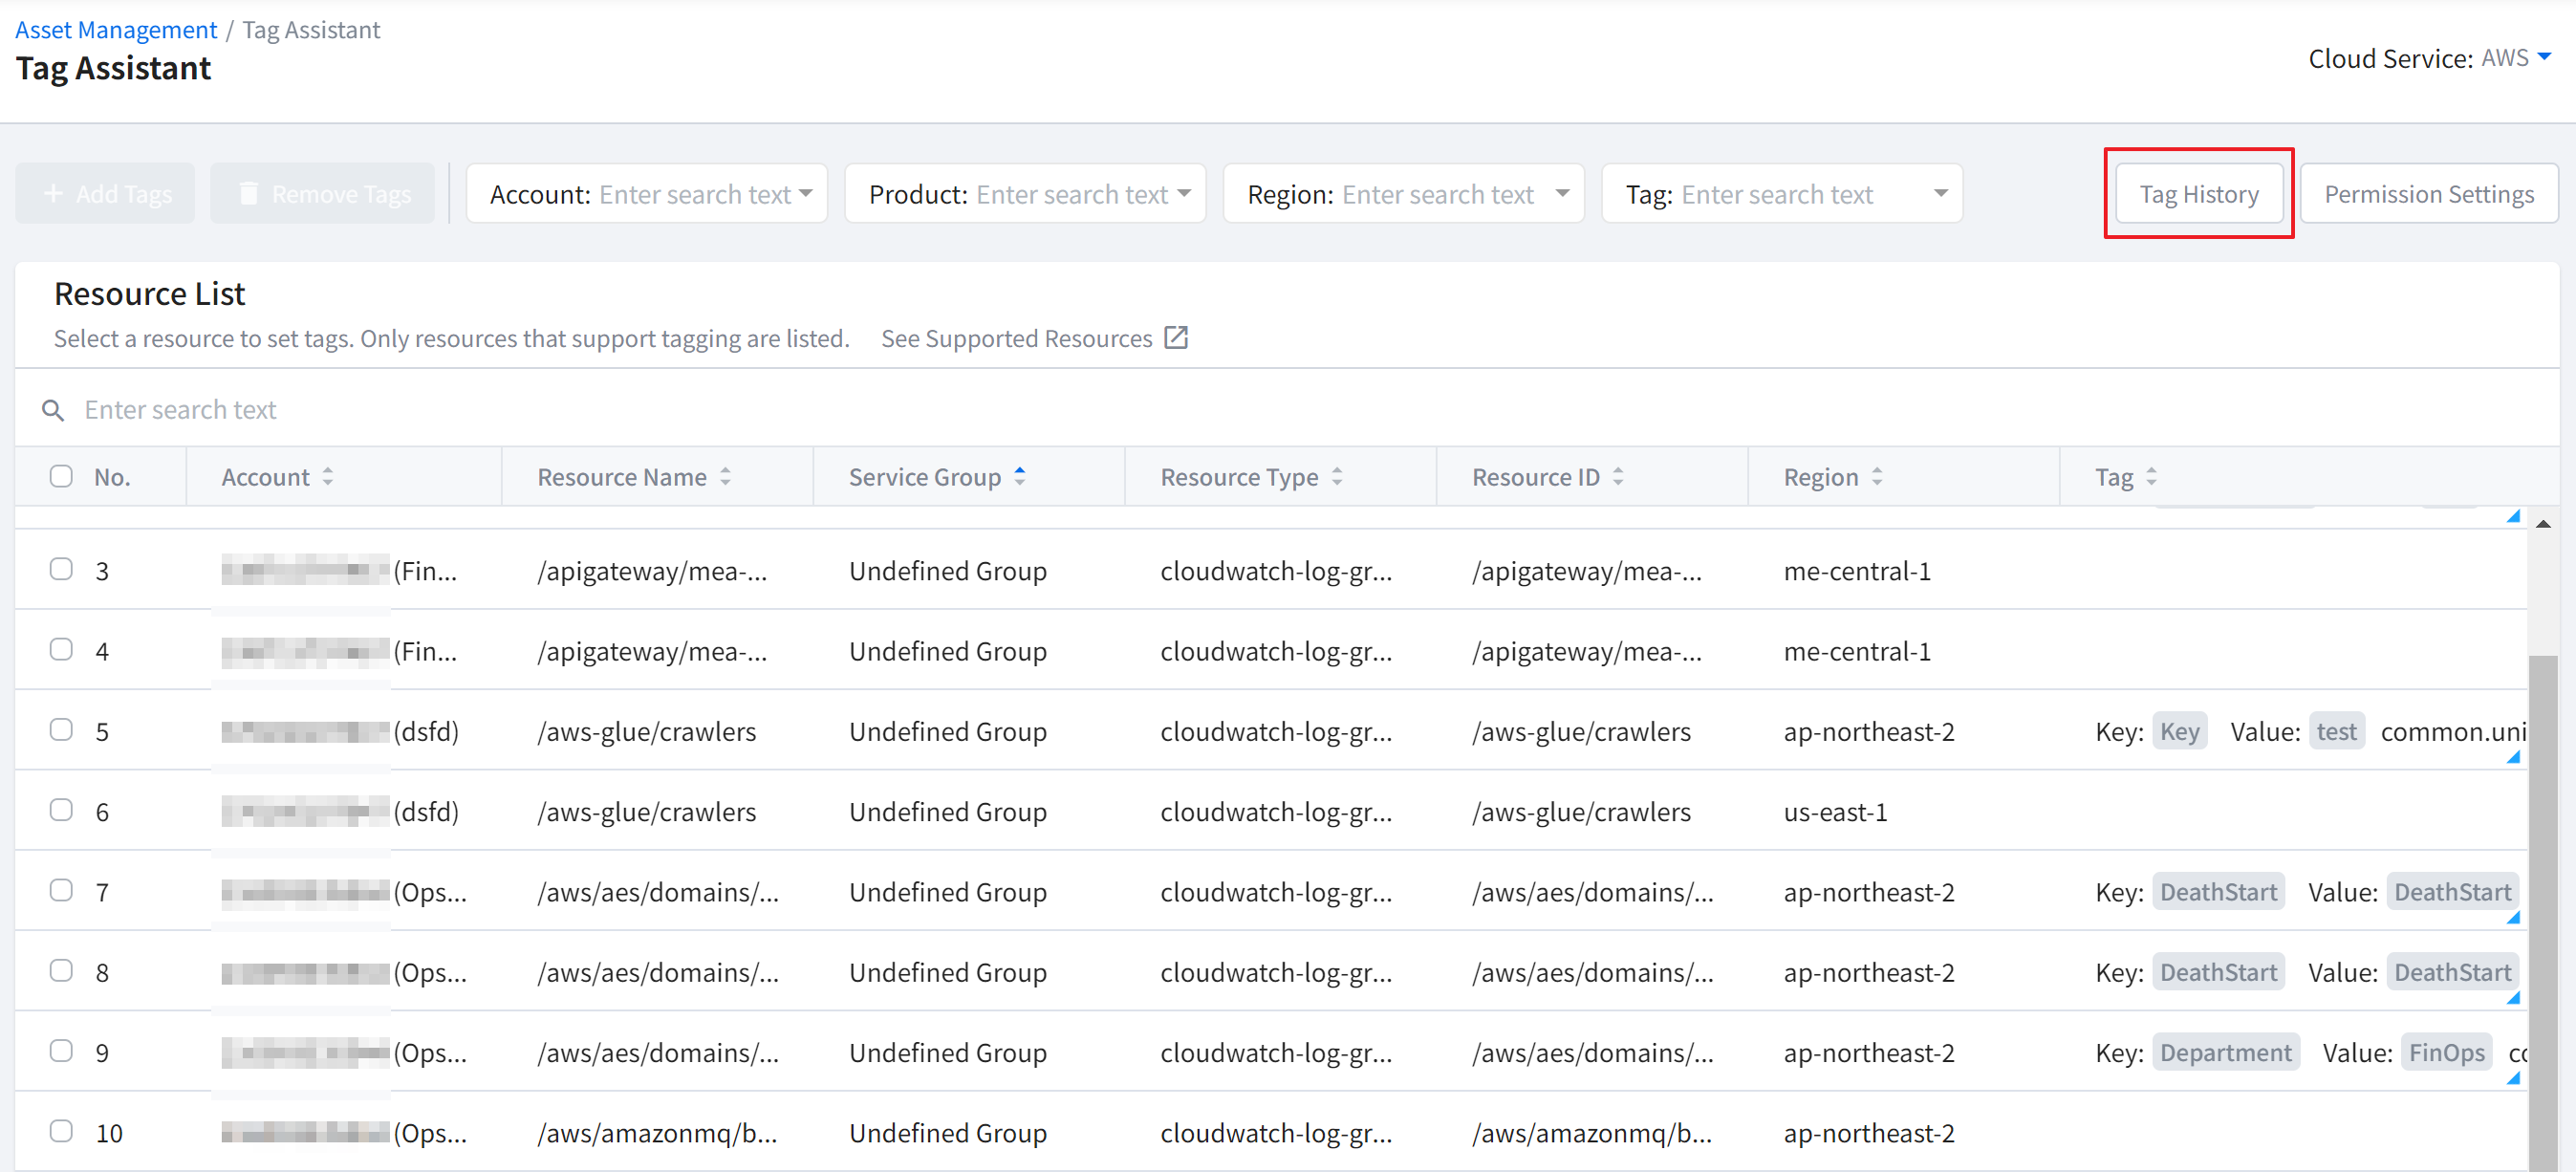
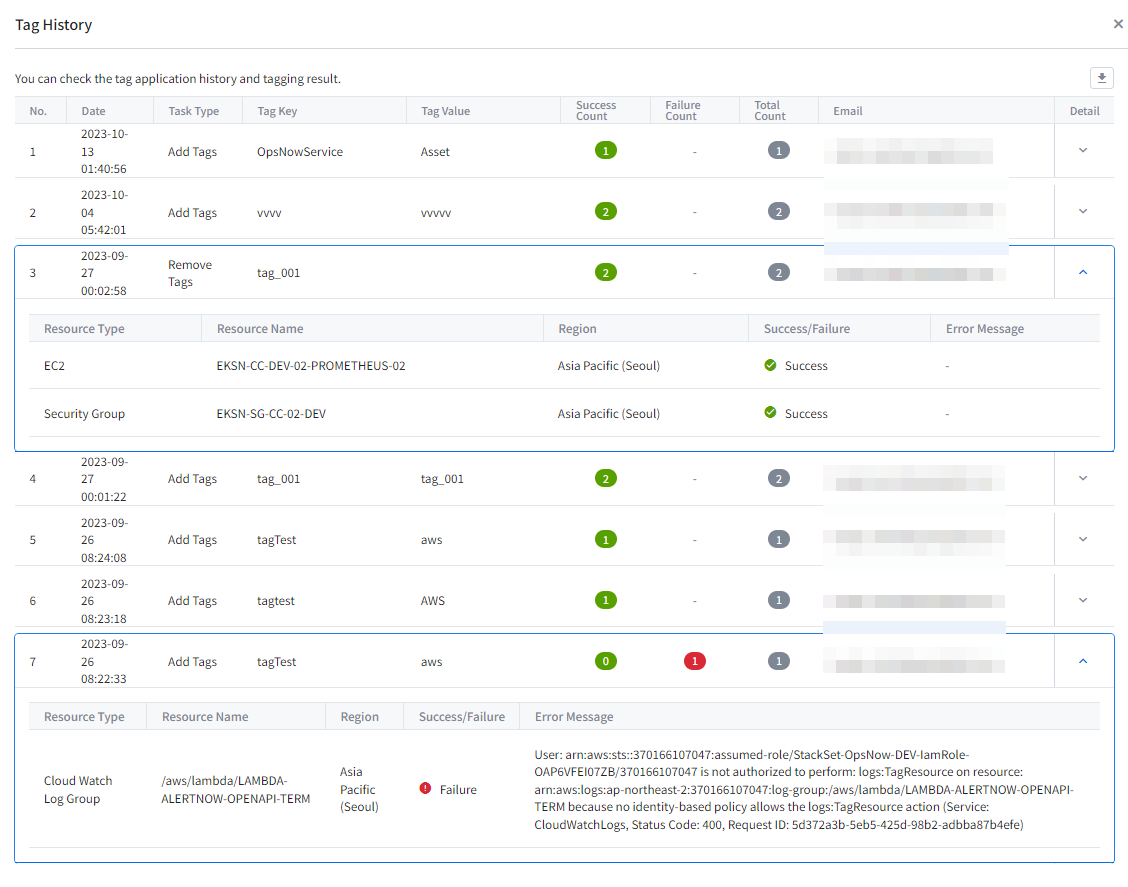
Tag Assistant Supported Resources
You can find information about resources that support tag functionality in the table below.
AWS
| Resource | Tag |
|---|---|
| AMI | O |
| API Gateway API Key | O |
| API Gateway Client Certificate | O |
| API Gateway Domain Name | O |
| API Gateway Rest API | O |
| API Gateway Usage Plan | O |
| API Gateway VPC Link | O |
| Auto Scaling Group | O |
| Auto Scaling Instance | X |
| Client VPN Endpoint | O |
| Client VPN Association | X |
| Cloud Front | O |
| Cloud Search | X |
| Cloud Watch Log Group | O |
| CodeDeploy Application | O |
| CodeDeploy Deployment Group | O |
| Direct Connect | O |
| DMS Replication Instance | O |
| DynamoDB | O |
| EBS | O |
| EC2 | O |
| ECS Cluster | O |
| ECS Task | O |
| EFS | O |
| EIP | O |
| EKS Cluster | O |
| Elastic Cache | O |
| Elasticsearch Service | O |
| EMR Cluster | O |
| Glacier | O |
| Glue Crawler | O |
| Glue Job | O |
| IAM | X |
| Internet Gateway | O |
| IVS Channel | O |
| IVS Chat Room | O |
| MSK(Kafka) | O |
| Kinesis Data Analytic | O |
| Kinesis Data Stream | O |
| Kinesis Data Firehose | X |
| Kinesis Video Stream | O |
| KMS | O |
| Lambda | O |
| Launch Configuration | X |
| Launch Template | O |
| ELB | O |
| Media Convert | O |
| Media Live Channel | O |
| Media Live Input | O |
| Media Store | O |
| Amazon MQ | O |
| Managed Workflows for Apache Airflow | O |
| NAT Gateway | O |
| Network ACL | O |
| ENI | O |
| RDS | O |
| RDS Cluster | O |
| RDS RI | O |
| RDS Snapshot | O |
| Redshift | O |
| EC2 RI | O |
| Route Table | O |
| Route53 | O |
| S3 | O |
| SageMaker App | O |
| SageMaker EndPoint | O |
| SageMaker NoteBook Instance | O |
| SageMaker Processing Job | O |
| SageMaker Training Job | O |
| SageMaker Transform Job | O |
| Savings Plans | O |
| Security Group | O |
| Snapshot | O |
| SQS | O |
| Subnet | O |
| Transfer For SFTP | O |
| Transit Gateway | O |
| Transit Gateway Attachment | X |
| VPC Endpoint | O |
| VPC Flow Log | O |
| VPC | O |
| VPN Connection | O |
| WAF Rule Group | O |
| WAF Web ACL | O |
| Workspace Bundle | X |
| Workspace Directory | X |
| Workspace Image | X |
| Workspace IP Group | X |
| Workspace | O |
Azure
| Resource | Tag |
|---|---|
| Batch Account | O |
| Redis | O |
| CDN | O |
| Disk | O |
| Image | O |
| Snapshot | O |
| VM | O |
| Virtual Machine Scale Sets | O |
| Data Factory | O |
| MariaDB Server | O |
| MySQL Flexible Server | O |
| MySQL Server | O |
| MySQL Database | X |
| PostgreSQL Flexible Server | O |
| PostgreSQL Server | O |
| Cosmos DB | O |
| Namespace | O |
| Application Insight | O |
| Alert | O |
| Application Gateway | O |
| DDOS Protection Plan | O |
| Load Balancer | O |
| Local Network Gateway | O |
| Network Interface | O |
| Network Security Group | O |
| Network Watcher | O |
| Public IP Address | O |
| Route Table | O |
| Traffic Manager | O |
| Virtual Network Gateway | O |
| Virtual Network | O |
| Virtual Network Subnet | X |
| Log Analytics workspace | O |
| Vault | O |
| Search Service | O |
| Managed Instance | O |
| MSSQL Server | O |
| MSSQL Servers Database | O |
| MSSQL Elastic Pool | O |
| Virtual Cluster | X |
| Storage Account | O |
| Storage Accounts Blob | X |
GCP
| Resource | Tag |
|---|---|
| Bigquery Dataset | O |
| Bigquery Table | O |
| Bigtable Cluster | X |
| Bigtable Instance | X |
| IP Address | O |
| AutoScaler | X |
| Cloud Function | X |
| Disk | O |
| Firewall | X |
| Health Check | X |
| Image | O |
| VM Instance | O |
| Instance Groups | X |
| Instance Group Manager | X |
| Instance Template | X |
| VPC Network | X |
| Route | X |
| Snapshot | O |
| Subnet | X |
| VPN Gateway | O |
| VPN Tunnel | O |
| Dataflow Job | X |
| Dataproc Cluster | O |
| Kubernetes Cluster | O |
| Redis | O |
| Pub/Sub Snapshot | X |
| Pub/Sub Subscription | O |
| Pub/Sub Topic | O |
| SQL Instance | X |
| Storage | O |
Ncloud
| Resource | Tag |
|---|---|
| Auto Scaling Group | O |
| Block Storage | O |
| Block Storage (Instance Default) | X |
| Block Storage Snapshot | O |
| DB Service | O |
| Load Balancer | O |
| MySQL Server | O |
| NAT Gateway | O |
| Network Interface | O |
| Object Storage | O |
| Public IP | O |
| Redis | O |
| Redis Server | O |
| Route Table | O |
| Server Instance | O |
| Subnet | O |
| VPC | O |