资产管理
通过一目了然的云资源间的关系图可以轻松了解资产的状态,并自动分析是否有效地使用资源。资产管理提供八个菜单,以便轻松了解资产状态。
快速入门指南
本指南描述使用资产管理服务时所需的基本内容。在服务门户中注册使用中的云账号并配置所需的设置后,便可以启动资产管理服务。如果您需要注册和设置云账户,请参阅服务门户快速入门指南。
📑 仪表盘
您不仅可以查看使用中的云服务的资源汇总信息,还可以查看各云服务下的资源信息。收集并分析汇总的资源以按周提供使用趋势。
有关使用中的各云服务的资源信息、服务器、数据库&存储、网络的使用和性能,请参阅仪表盘。📑 服务组
该功能可以根据需要,对使用中的云服务的汇总资源自由分类。用户可基于条件创建View,按View创建类别和服务组,轻松区分并查看云服务的资源使用情况及费用信息。
有关使服务组的更多信息,请参阅服务组。📑 使用量
您可以查看各云服务的资源使用情况和使用历史。当前页面提供使用中的各资源的状态、区域、类型等信息,历史页面提供各资源过去的状态信息。
有关资源使用情况及使用历史的更多信息,请参阅使用量。
仪表盘
在仪表盘中可以查看每个云服务的资源数量以及服务器、数据库&存储、网络使用情况及性能信息的图表。
资产管理 > 仪表盘
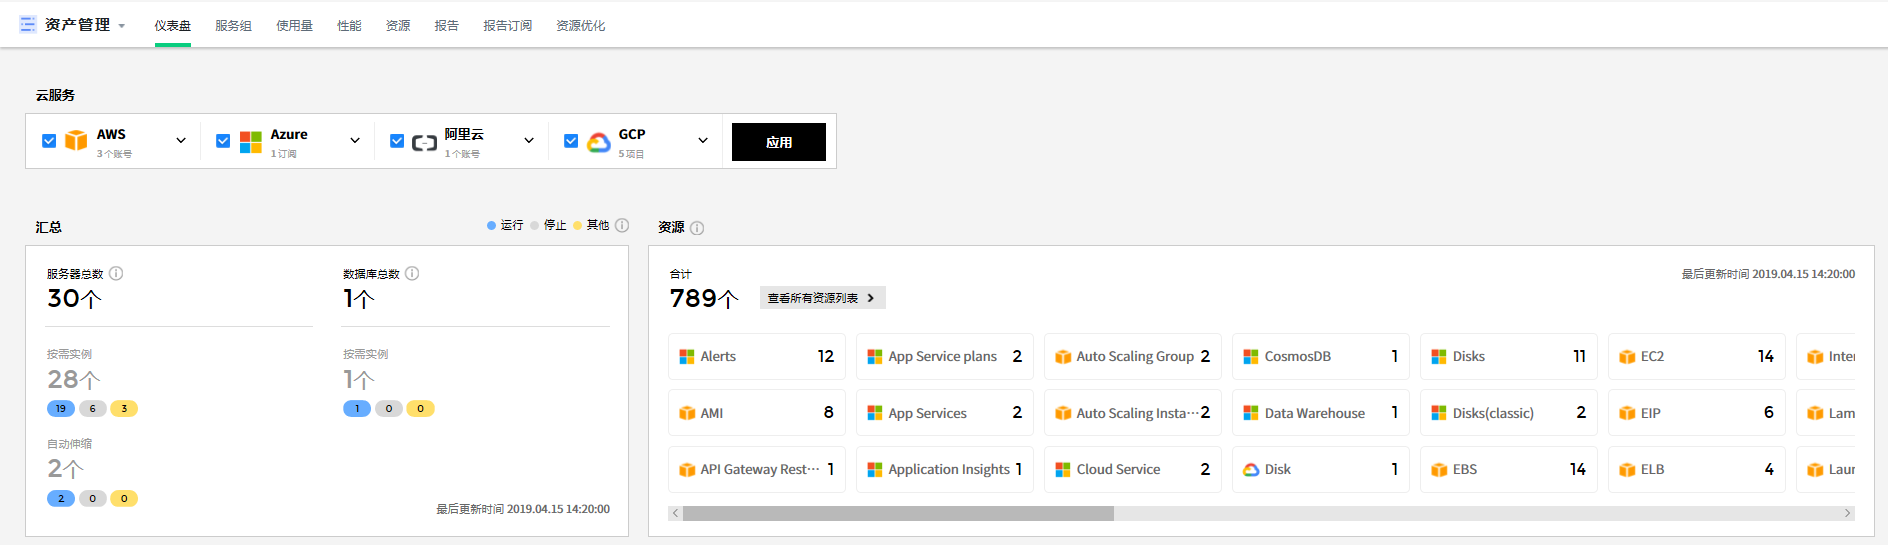


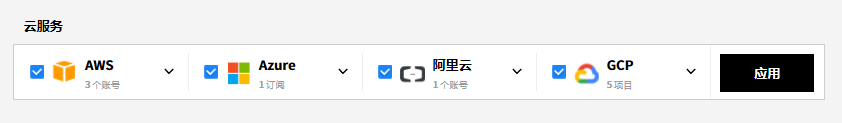
云服务
将显示正在使用的云服务以及每个服务的资源数量。选择云服务后,点击【应用】按钮以显示该服务的资源状态。
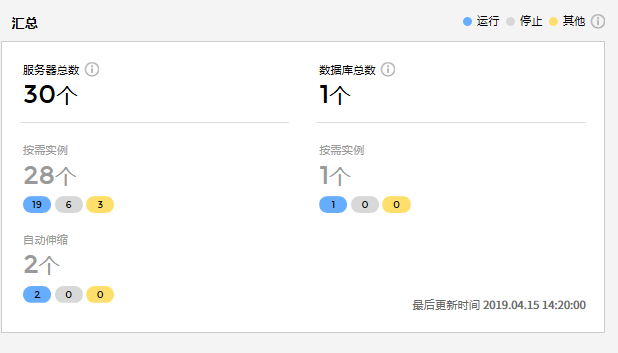
汇总
显示所选云服务的服务器及数据库数量。显示按需实例和自动伸缩项目的总数以及按状态显示的数量。(运行,停止,其他)
资源
显示在云服务中使用的所有资源列表以及每个资源的当前使用数量。会定期更新资源信息。要查询提供的所有资源,您需要在云服务提供商中添加权限。

如何在AWS上变更账户策略
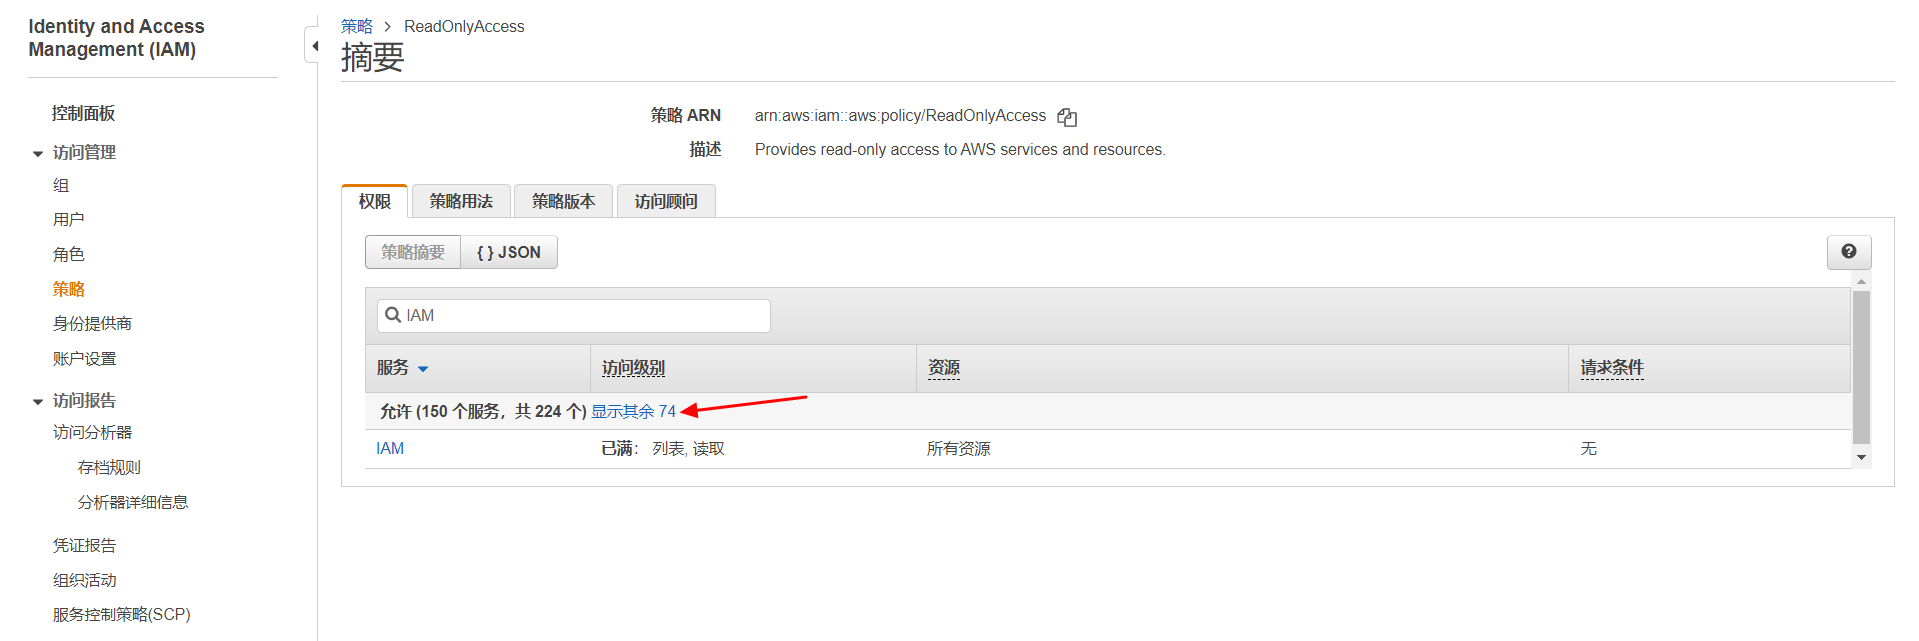
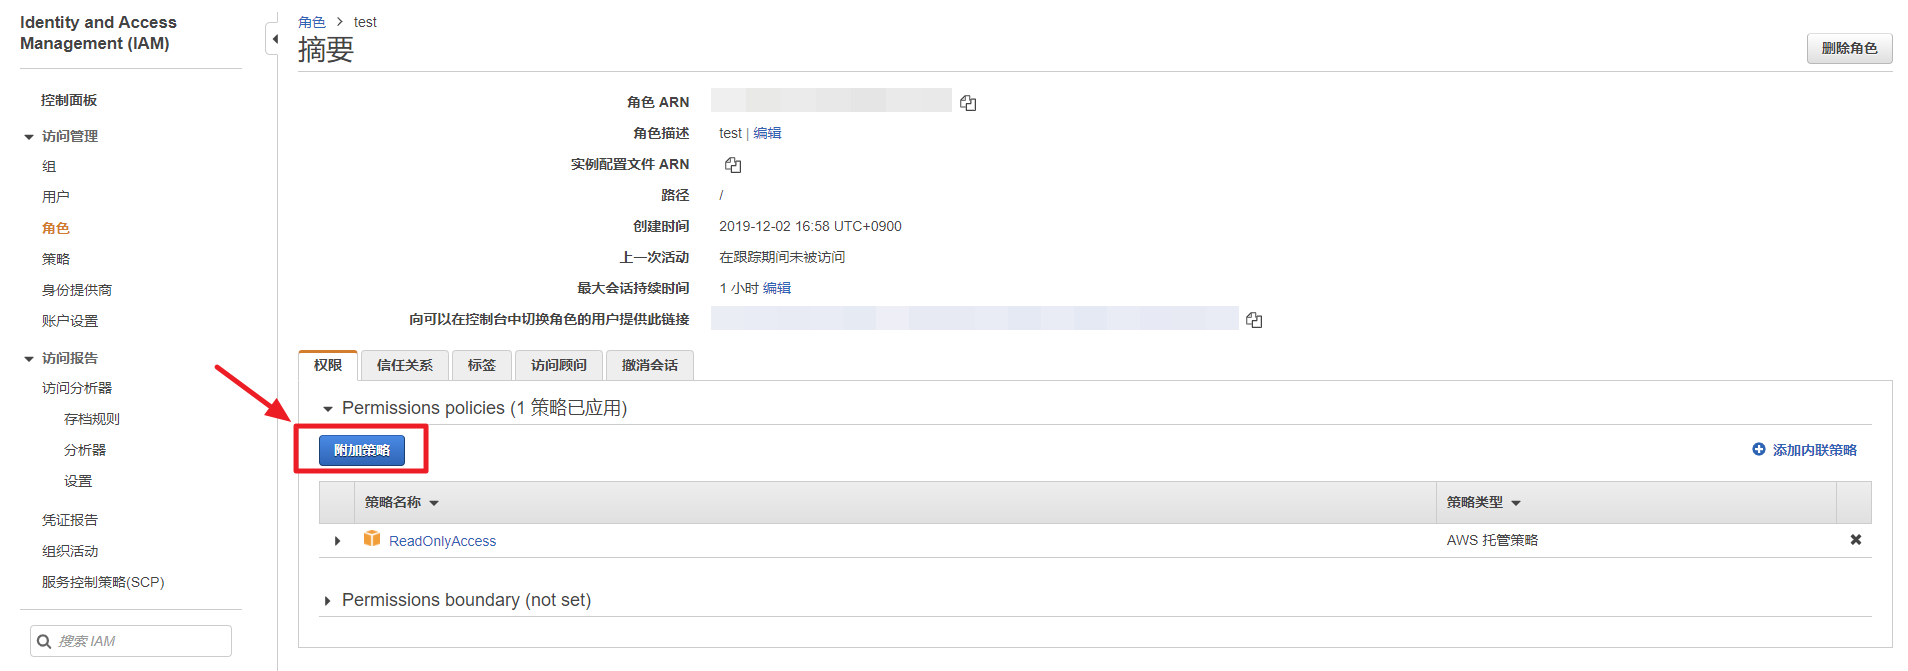
登录到AWS控制台,然后移动至IAM控制台。选择页面左侧的策略以查找与云账户关联的策略。其中大多数是ReadOnlyAccess。
![]()
点击该策略以查看为该策略设置的权限。点击“显示其余OO”以查看是否存在由于没有权限而无法收集的资源。
![]()
当存在由于没有权限而无法收集的资源时,则无法更改策略权限,因为ReadOnlyAccess是一个AWS托管策略。因此您需要创建一个新策略并向该资源添加权限。


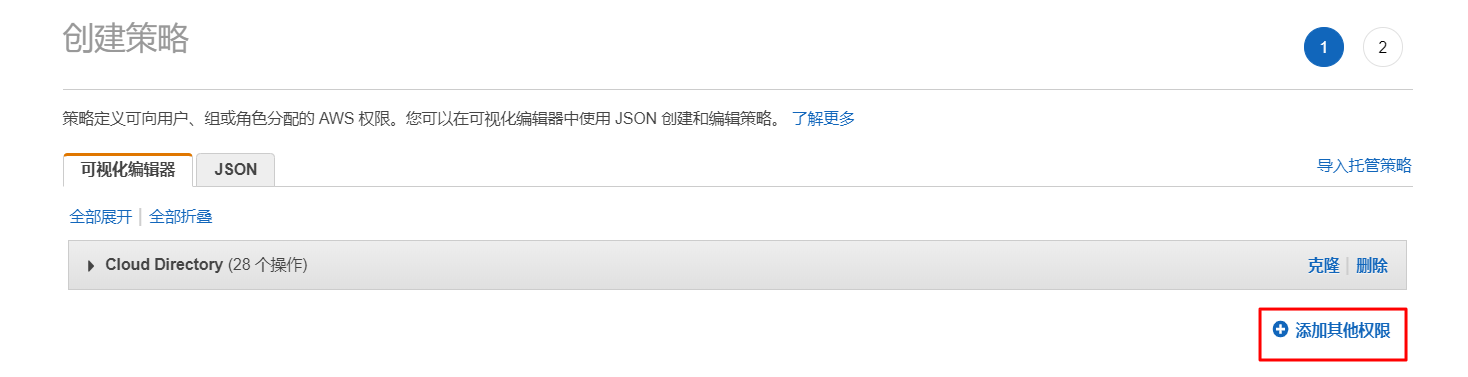
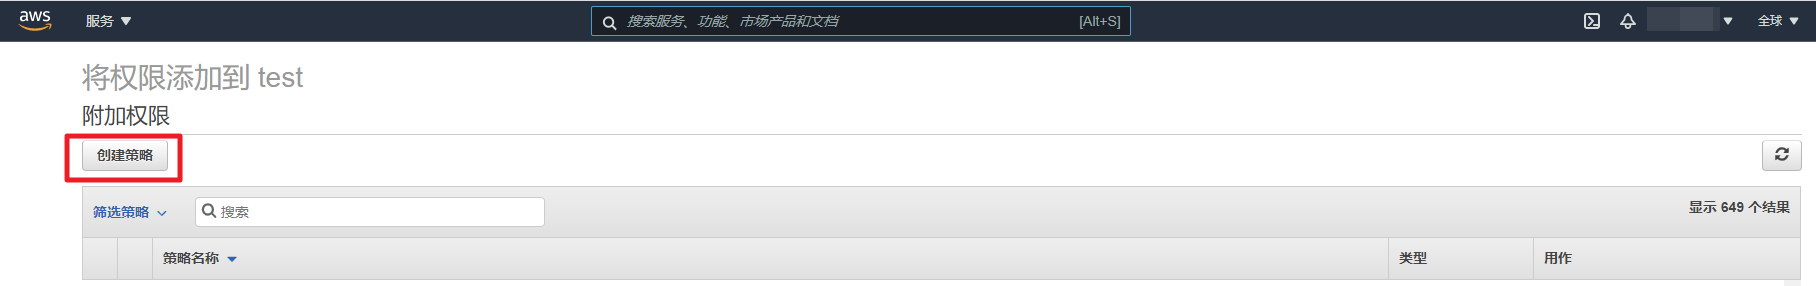
① 点击【创建策略】按钮以创建新的策略。

② 点击【导入托管策略】。

③ 导入ReadOnlyAccess策略。

④ 点击【添加其他权限】以选择要添加权限的服务。
⑤ 检查策略并创建。

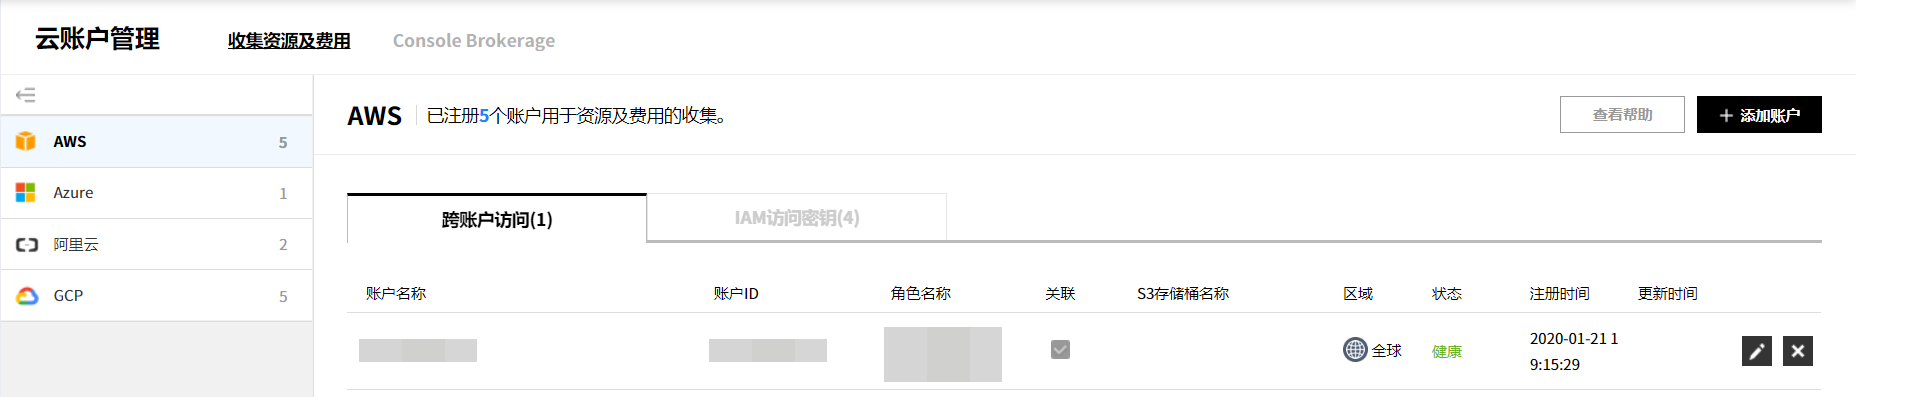
⑥ 在服务门户的云账户管理中重置注册账户的角色。详细信息请参阅注册各云服务账户。
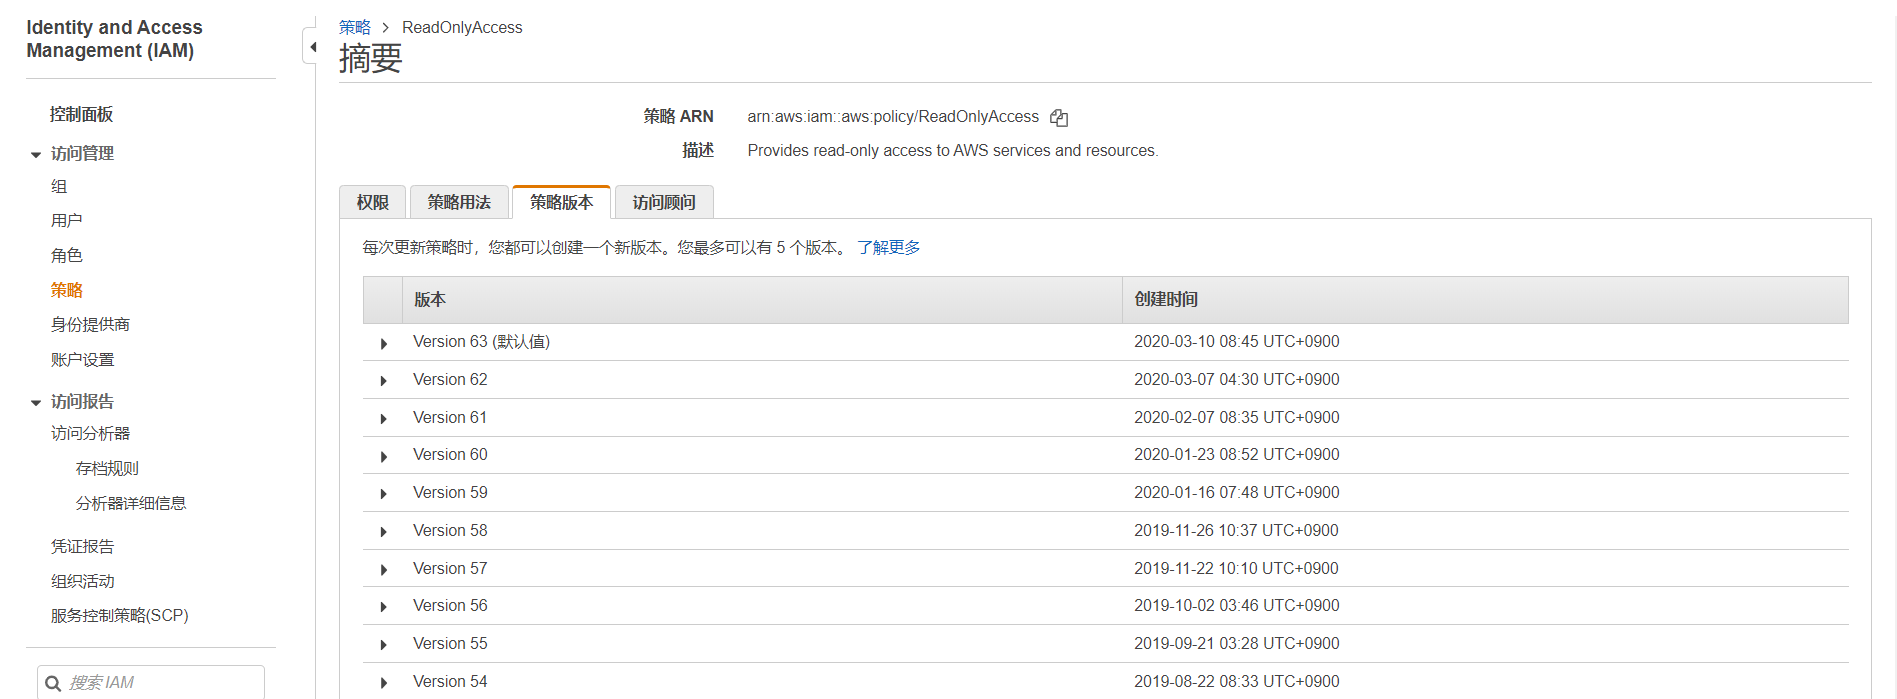
在策略摘要的策略版本选项卡中确认是否已将最新版本设置为默认版本。点击版本名称以查看是否存在由于没有权限而无法收集的资源。
![]()
当存在由于没有权限而无法收集的资源时,则无法更改策略权限,因为ReadOnlyAccess是一个AWS托管策略。因此您需要创建一个新策略并向该资源添加权限。
① 点击【创建策略】按钮以创建新的策略。
② 点击【导入托管策略】。
③ 导入ReadOnlyAccess策略。
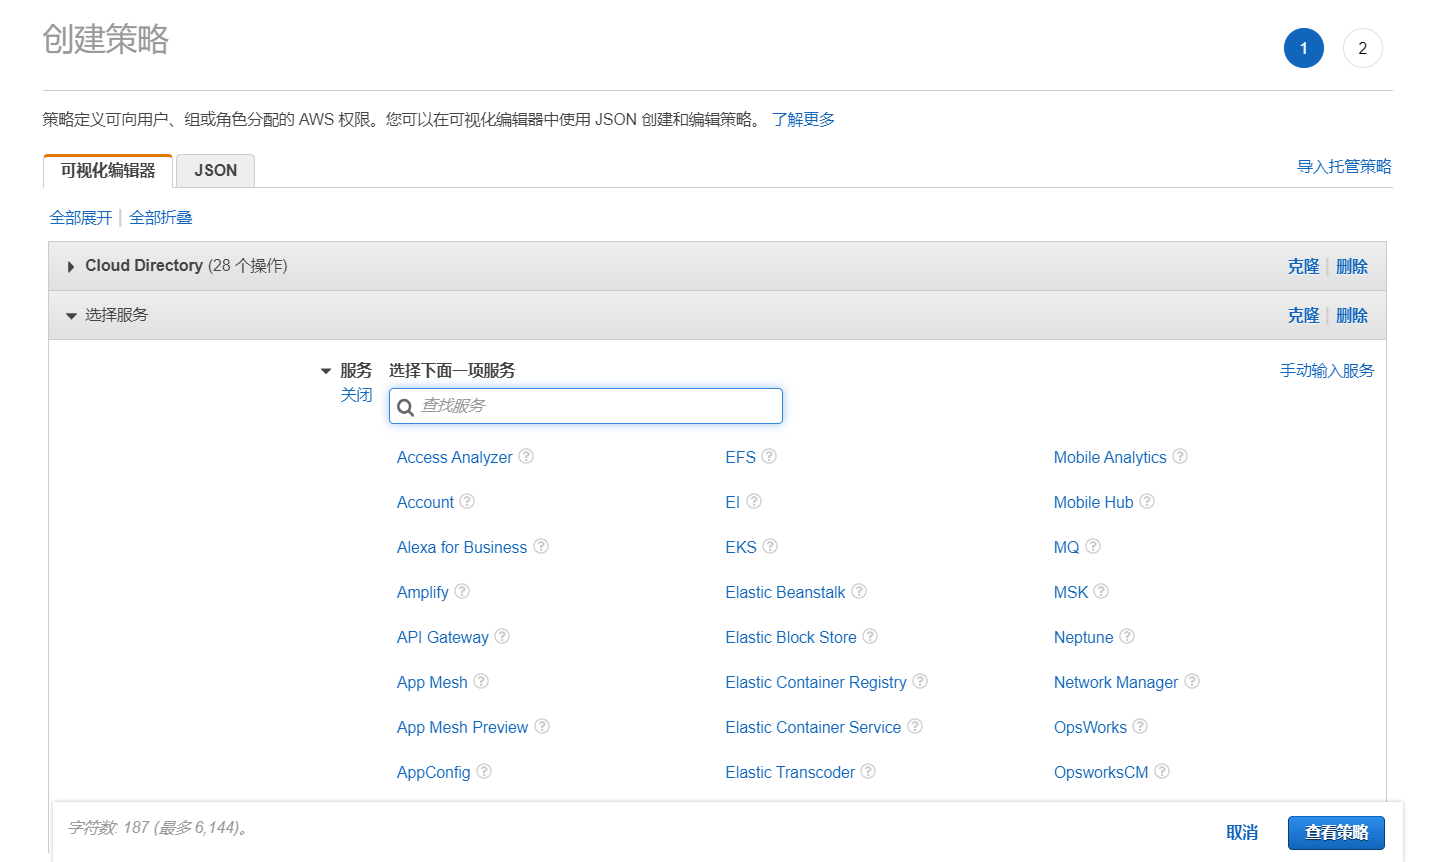
④ 点击【添加其他权限】以选择要添加权限的服务。
⑤ 检查策略并创建。
如何变更IAM权限
登录到AWS控制台,然后移动至IAM控制台。选择页面左侧的策略以查找与云账户关联的策略。其中大多数是ReadOnlyAccess。
![]()
点击该策略。在策略中设置的服务中点击IAM以查看具有IAM权限的资源。
![]()
点击[显示其余OO]以查看是否存在由于您没有权限而无法收集的资源。当存在由于没有权限而无法收集的资源时,则无法更改策略权限,因为ReadOnlyAccess是一个AWS托管策略。因此您需要创建一个新策略并向该资源添加权限。
① 点击【创建策略】按钮以创建新的策略。
② 点击【导入托管策略】。
③ 导入ReadOnlyAccess策略。
④ 点击【添加其他权限】以选择要添加权限的服务。
⑤ 检查策略并创建。
⑥ 在服务门户的云账户管理中重置注册账户的角色。详细信息请参阅注册各云服务账户。
获取AWS S3资源时发生费用
如果获取AWS的S3,则将根据AWS的费用策略向您收取费用。在AWS上使用API/SDK申请S3存储桶和对象时,根据申请数收取费用。费用根据S3的类型和数量可能会有所不同。更多信息请参阅Amazon S3定价页面。如果您还有其他疑问,请通过客户支持团队与我们联系。
服务器
按状态显示每个云服务的服务器数量,以及可以用图表查看使用量和性能信息。
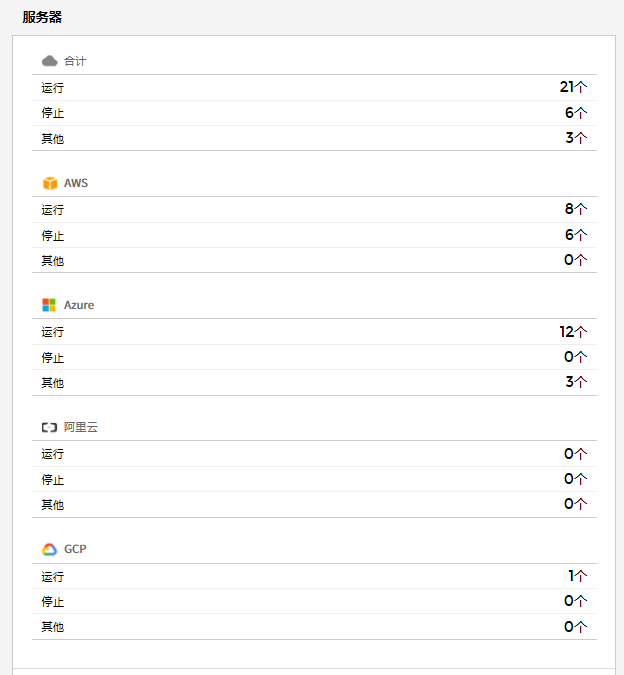
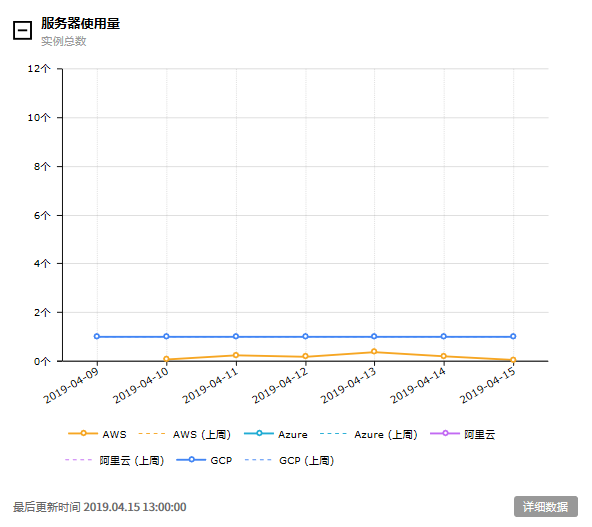
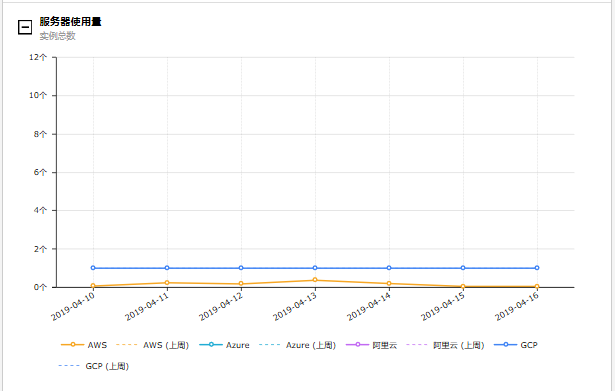
服务器/使用量-实例总数:用图表提供最近7天及上周的服务器使用量。
![]()
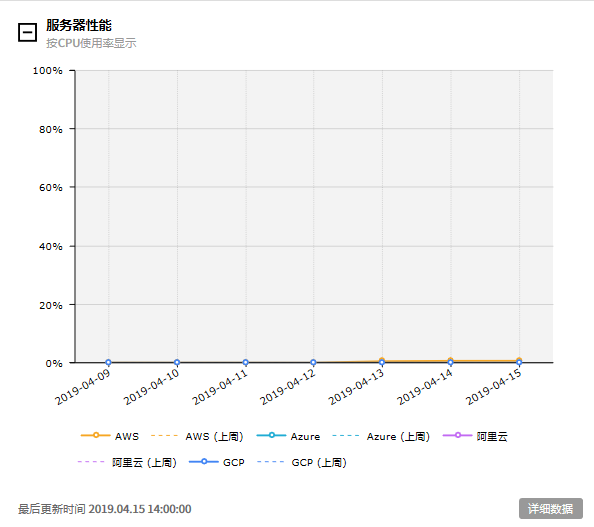
服务器/性能-按CPU使用率显示:用图表提供最近7天及上周的平均CPU使用率。
![]()
服务器/性能-按CPU使用率显示:用图表提供超出或低于设置的阈值时的CPU使用率。
![]()
服务器/性能-按内存使用率显示:用图表提供超出或低于设置的阈值时的内存利用率。(最近7天/上周)
服务器/性能-按磁盘使用率显示:用图表提供超出或低于设置的阈值时的磁盘利用率。
数据库和存储
可以通过图标查看正在使用的数据库、存储、磁盘使用情况和性能信息。
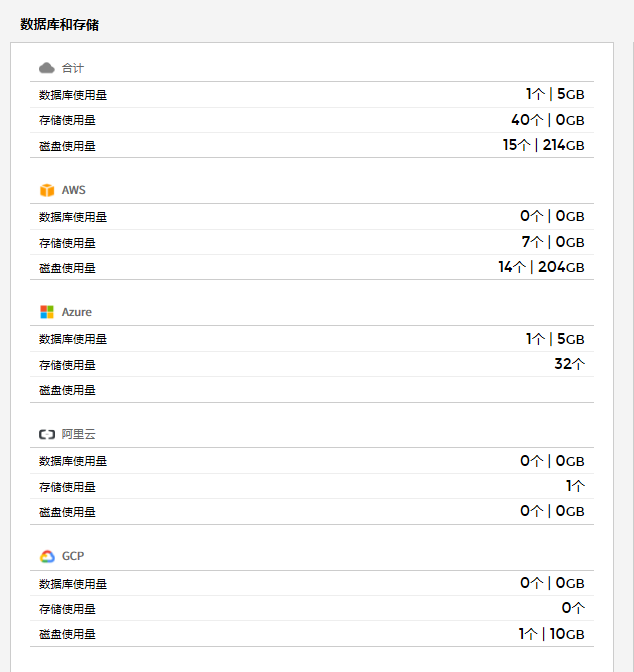
- 数据库/使用量 - 实例总数:用图表提供最近7天及上周的数据库使用量。
- 存储/使用量 - 实例总数:用图表提供最近7天及上周的存储使用量。
- 磁盘/使用量- 实例总数:用图表提供最近7天及上周的磁盘使用量。
- 数据库/性能 – 按CPU使用率显示:用图表提供超出或低于设置的阈值时的CPU使用率。(最近7天/上周)
- 数据库/性能 - 平均读/写IOPS:用图表提供超出或低于设置的阈值时的平均读/写IOPS使用率。(最近7天/上周)
网络
可以通过图表查看正在使用的网络使用量信息。
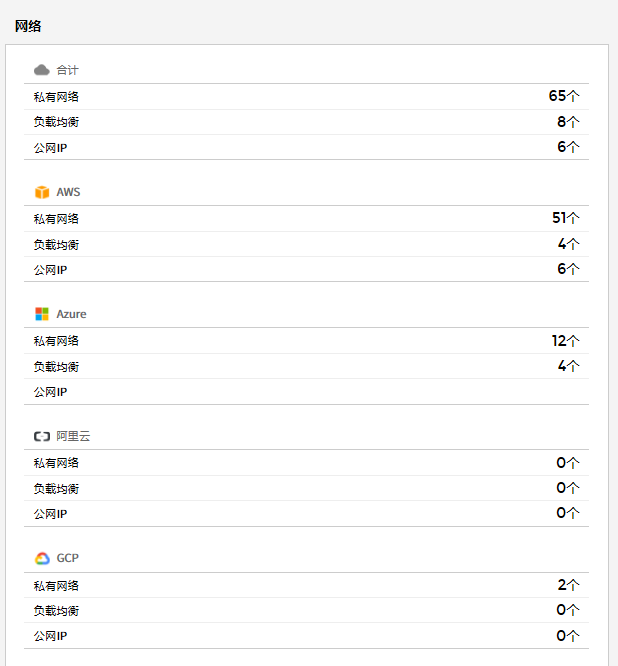
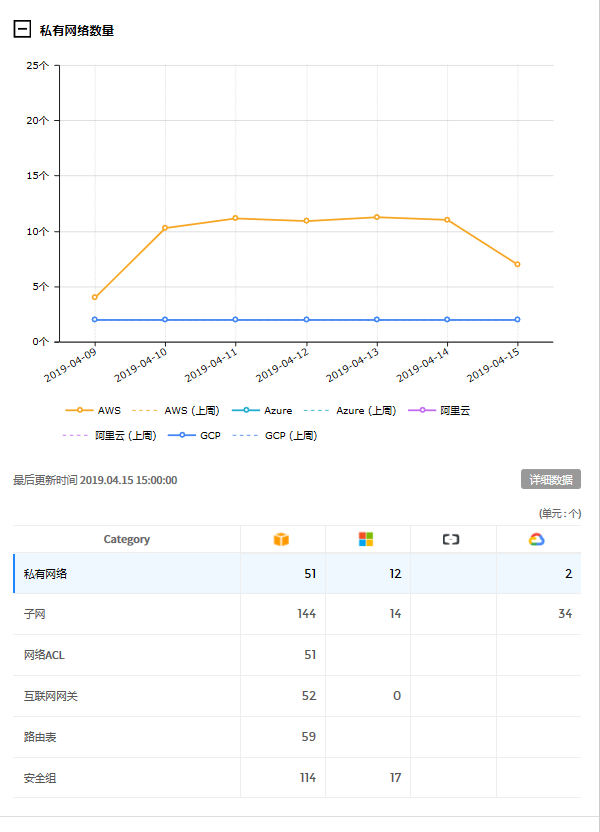
私有网络/使用量:用图表提供最近7天及上周的私有网络使用量。在图表的底部显示每个云服务的资源列表和数量,可以选择表中的每个资源来查看图表。
![]()
公网IP /使用量:用图表提供最近7天及上周的公网IP使用量。在图表的底部显示每个云服务的资源列表和数量,可以选择表中的每个资源来查看图表。
服务组
资产管理 > 服务组
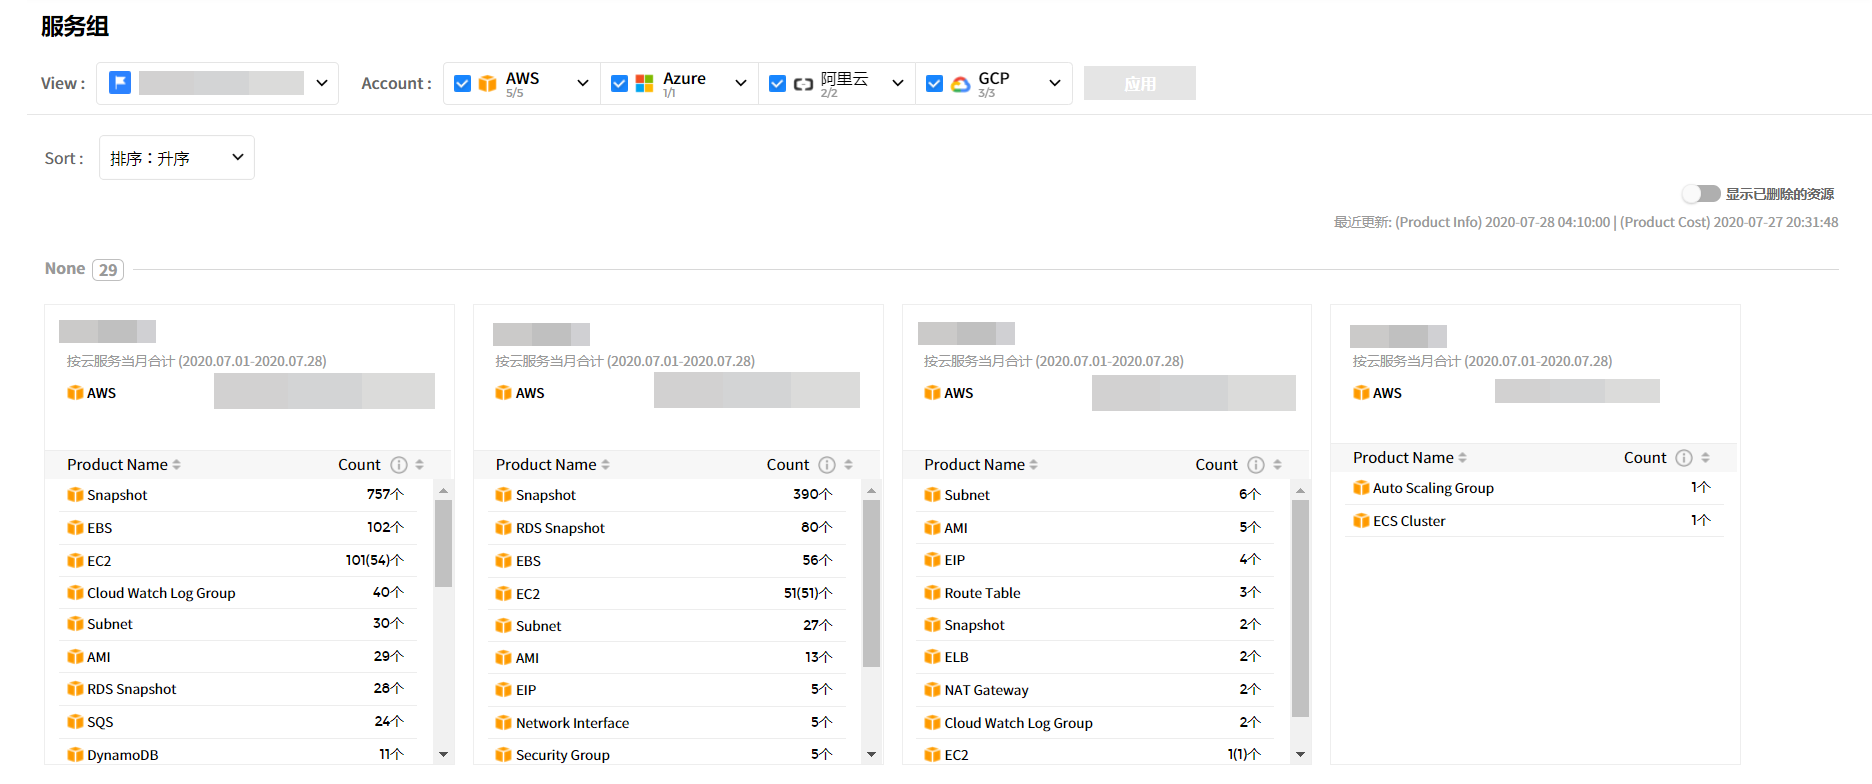
可以根据用户的需要自由区分整个云环境的资源,根据分类标准创建View,然后按View创建类别和服务组以区分资源。服务组的构成如下所示
| 项目 | 说明 |
|---|---|
| View | 根据资源分类标准创建,选择创建的view并点击【应用】按钮。 您可以查看该View的类别和每个服务组的资源状态以及当月合计。(默认View为默认值) |
| 云服务 | 显示正在使用的云服务以及每个服务的资源数。 选择云服务后,点击【应用】按钮以显示该服务的资源状态。 |
| 显示已删除的资源 | 如果将显示已删除的资源切换按钮变更为On,则会在各服务组中显示已删除的资源。 |
| 服务组卡片 | 显示在服务组中正在使用的资源数量和种类以及产生的费用。
|
如果服务组中没有资源,则必须从服务门户的服务组菜单中添加。有关添加资源的更多信息,请参阅服务门户使用手册 > 服务组 > 添加资源。
使用量
资产管理 > 使用量
可以查看每个云服务资源使用情况和使用历史记录。
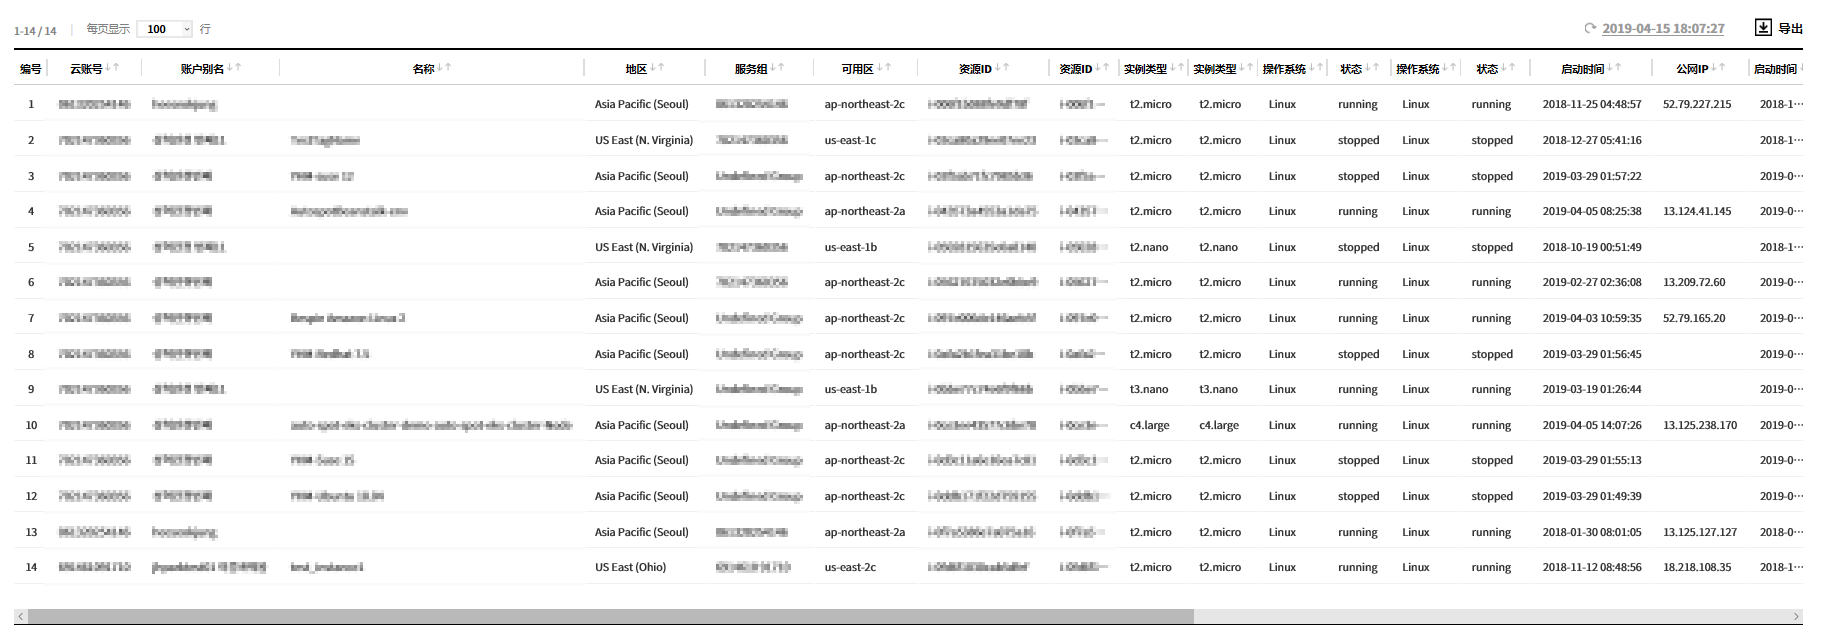
当前
可以查看每个云服务资源使用情况。

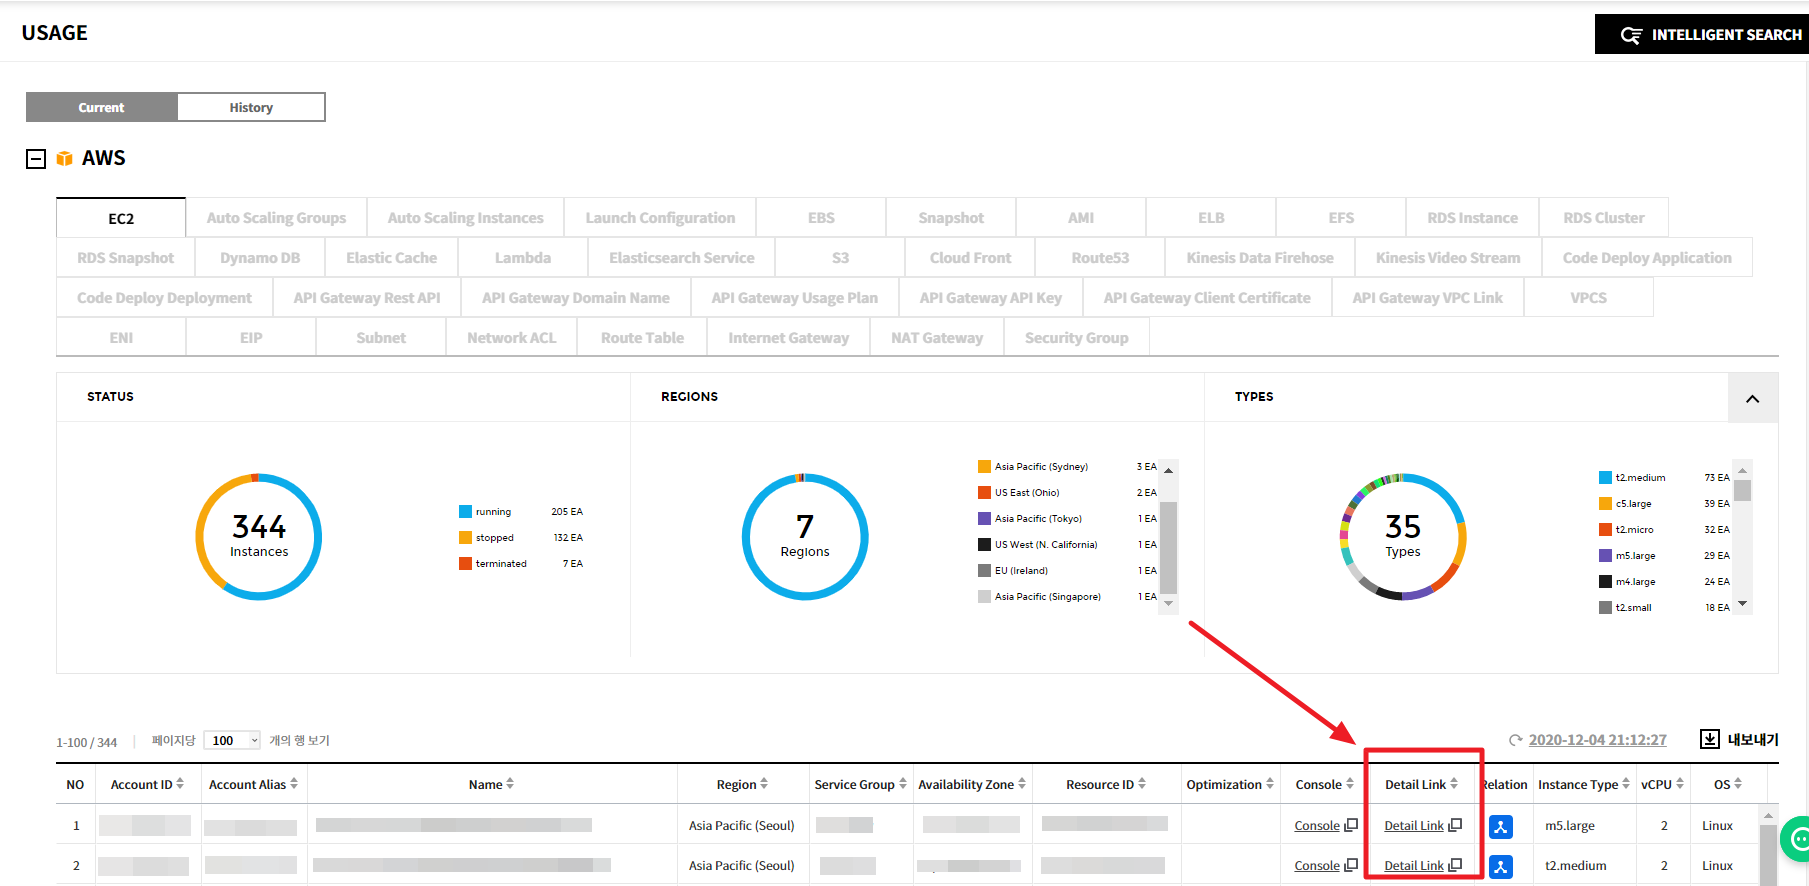
提供资源的状态、区域、各类型数量的饼分图。下表显示正在使用的资源列表,点击列表中的资源以查看有关该资源的详细信息。可以查看AWS、Azure、Ncloud、Alibaba Cloud, GCP和服务的特定资源的关系图。
Amazon Web Services
可以查看下列有关Amazon Web Services资源的使用情况。
AMI, EBS, EC2, EIP, Internet Gateway, Lambda, Network ACL, RDS, Route Table, S3, Security Group, Snapshot, Subnet, VPCS, ELB, Dynamo DB, Elastic Cache, CloudFront, Kinesis Data Stream, ENI, NAT Gateway
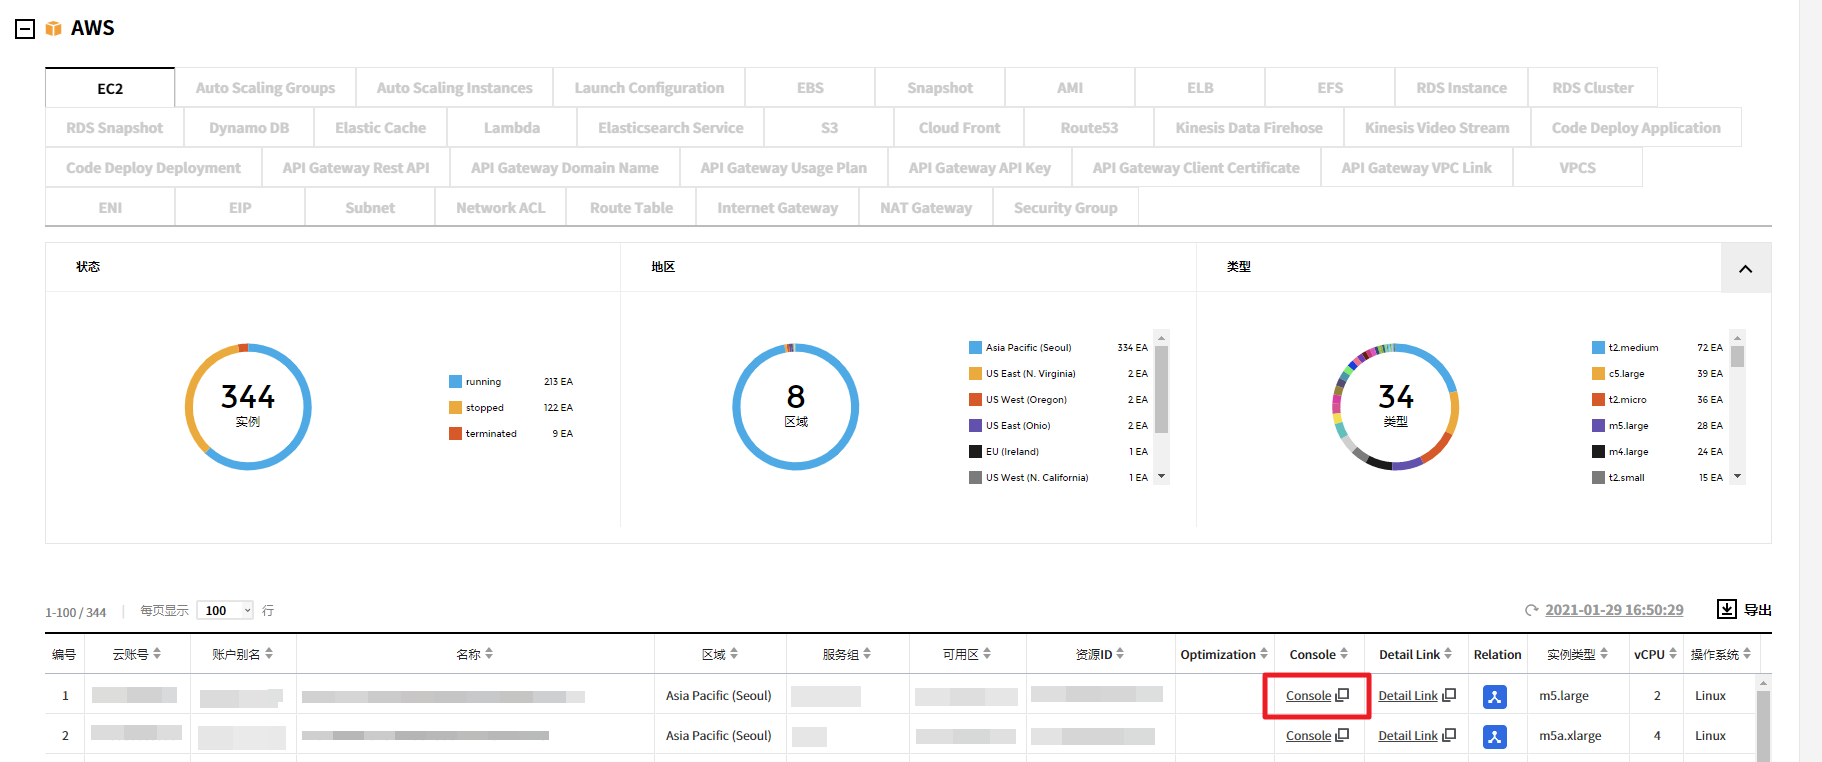
前往AWS控制台
提供前往控制台的功能,可以直接在AWS控制台中查看所需资源的信息。您可以在以下两种方式中选择一种方式前往AWS控制台。
点击资源列表控制台列中的【控制台链接】前往AWS控制台。
![]()
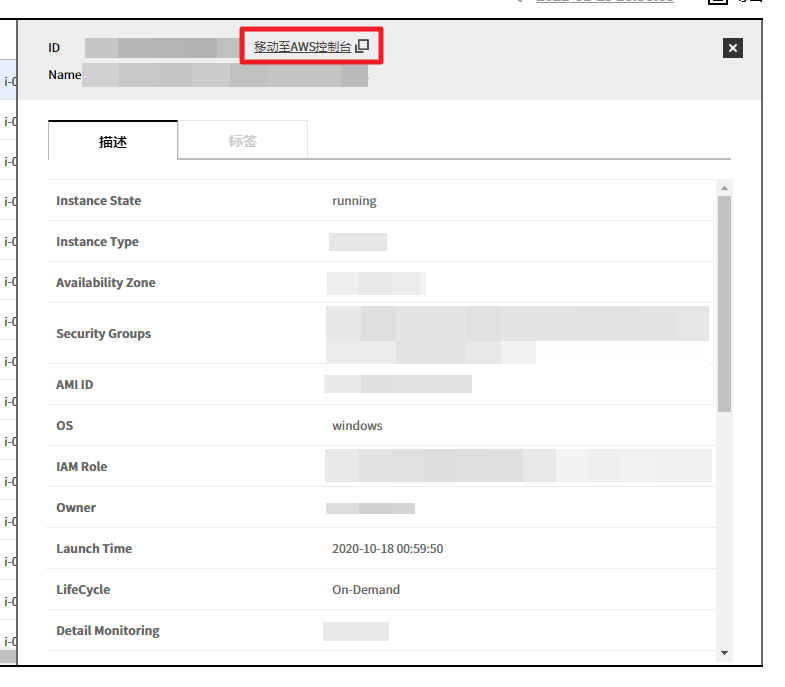
在资源列表中点击资源,将显示如下所示的详细页面。点击详细信息页面上端的前往AWS控制台前往。
![]()
如果您选择前往AWS控制台,则会出现如下所示的弹出信息。点击查看详细信息以查看AWS上的资源信息,点击查看监控信息以查看资源的性能信息。如果未登录AWS控制台则前往AWS登录页面。
![]()

- 如果您已在服务门户中的控制台Brokerage中录入了账户,则无需登录便可直接前往AWS控制台。有关控制台Brokerage录入账户的更多信息,请参阅服务门户控制台Brokerage。
Microsoft Azure
可以查看下列有关Microsoft Azure资源的使用情况。
CDN, Cloud Service, Database, Virtual Network Gateway, Network Security Group, Storage, Virtual Network Subnet, Traffic Manager, Virtual Network, Virtual Machine
Alibaba Cloud
可以查看下列有关Alibaba Cloud资源的使用情况。
Elastic Compute Service, Cloud Disk, Launch Template, Server Load Balancer, Scaling Group, Scaling Instance, Scaling Configuration, Snapshot, Snapshot Chain, Image, ApsaraDB for RDS, ApsaraDB for MongoDB, ApsaraDB for Redis, ApsaraDB for Memcache, HybridDB for MySQL, HybridDB for PostgreSQL, POLARDB Cluster, POLARDB Instance, Object Storage Service, Alibaba Cloud CDN, Elastic IP Address, Security Group, Virtual Private Cloud, NAT Gateway, VPN Gateway, Network Interface
Google Cloud Platform
可以查看下列有关Google Cloud Platform资源的使用情况。
VM Instance, Compute Disk, Big Table, Big Query, SQL Instance, Storage Bucket, VPC, Subnet
移动至GCP控制台
当前菜单中提供移动至控制台的功能,您可以在GCP控制台直接查看所选资源的信息。您可以通过以下两种方式前往GCP控制台。
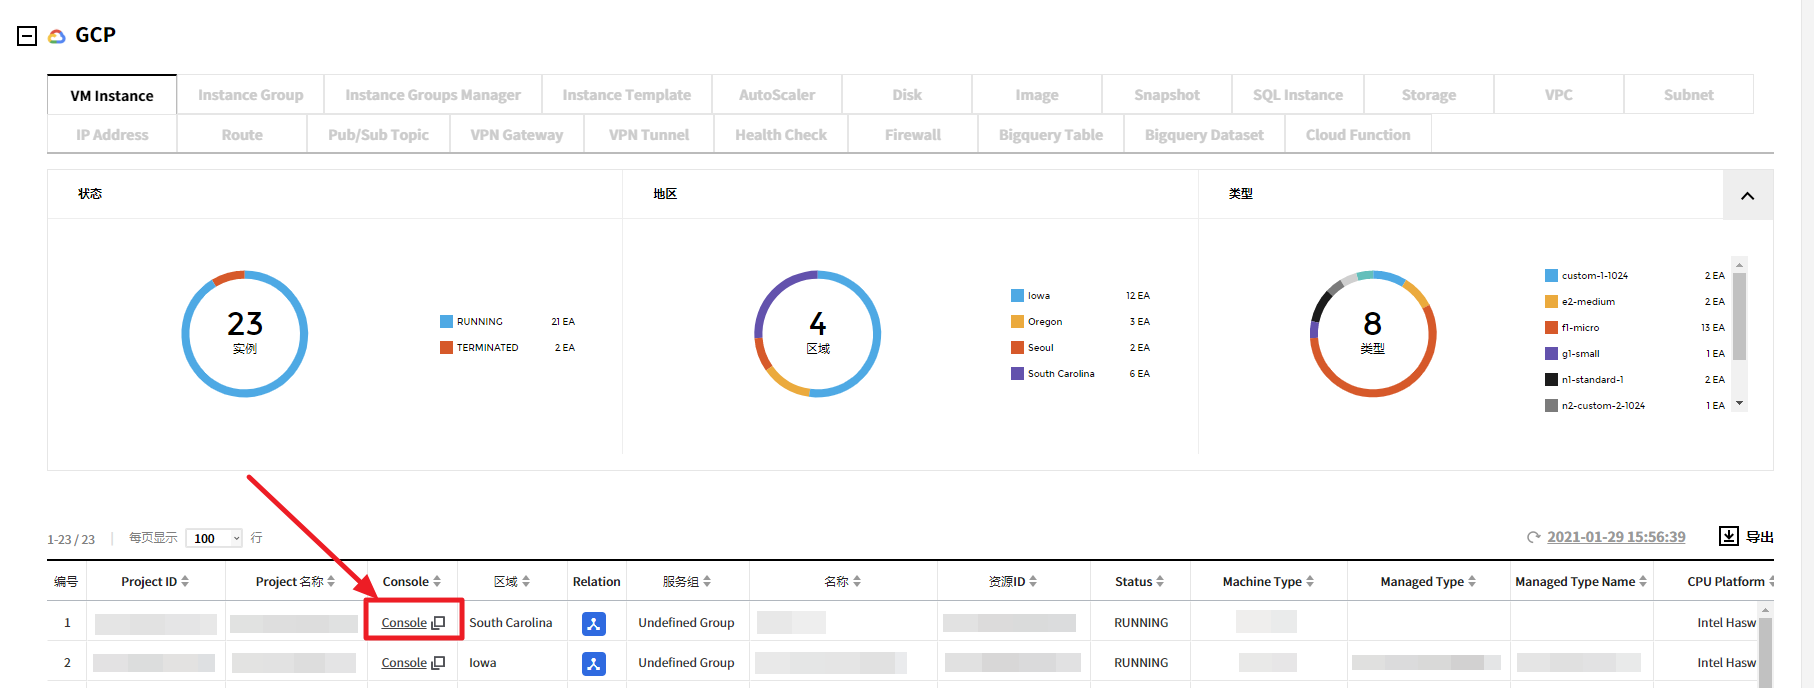
点击资源列表Console列的Console链接前往GCP控制台。
![]()
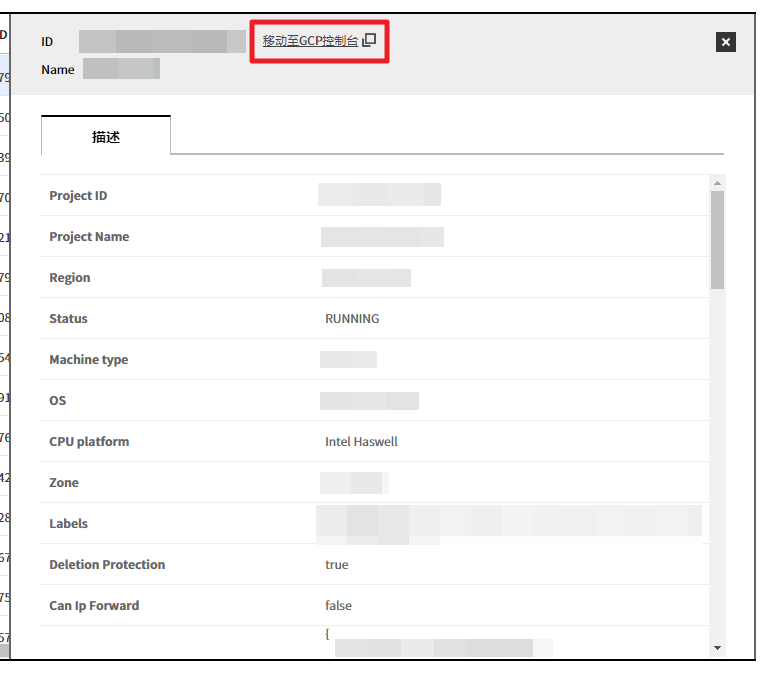
点击资源列表中的资源会出现如下详情页面。点击详情页面上端的移动至GCP控制台前往。
![]()
选择两种方法中的任意一种即会出现如下弹窗,然后可移动到GCP控制台。
![]()
移动到GCP控制台后,如果页面没有数据,请在页面右上方的账户信息中确认是否选择了正确的账户登录。如果登录的不是正确的账户,需要用有权限的其它账户重新登录才能显示数据。
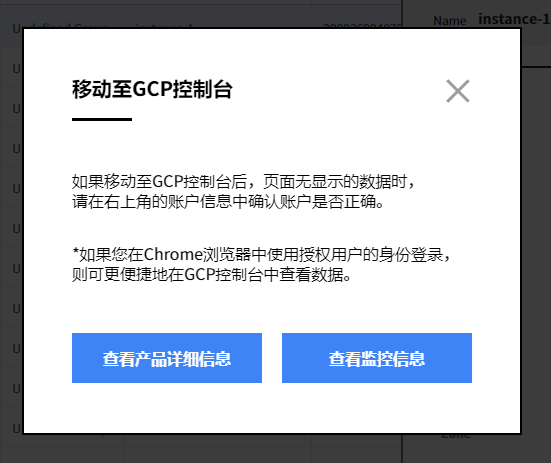
- 在谷歌浏览器中登录有权限的账户时,可以在GCP控制台直接查看数据,更加便利。
历史
可以查看每个云服务资源的使用历史。
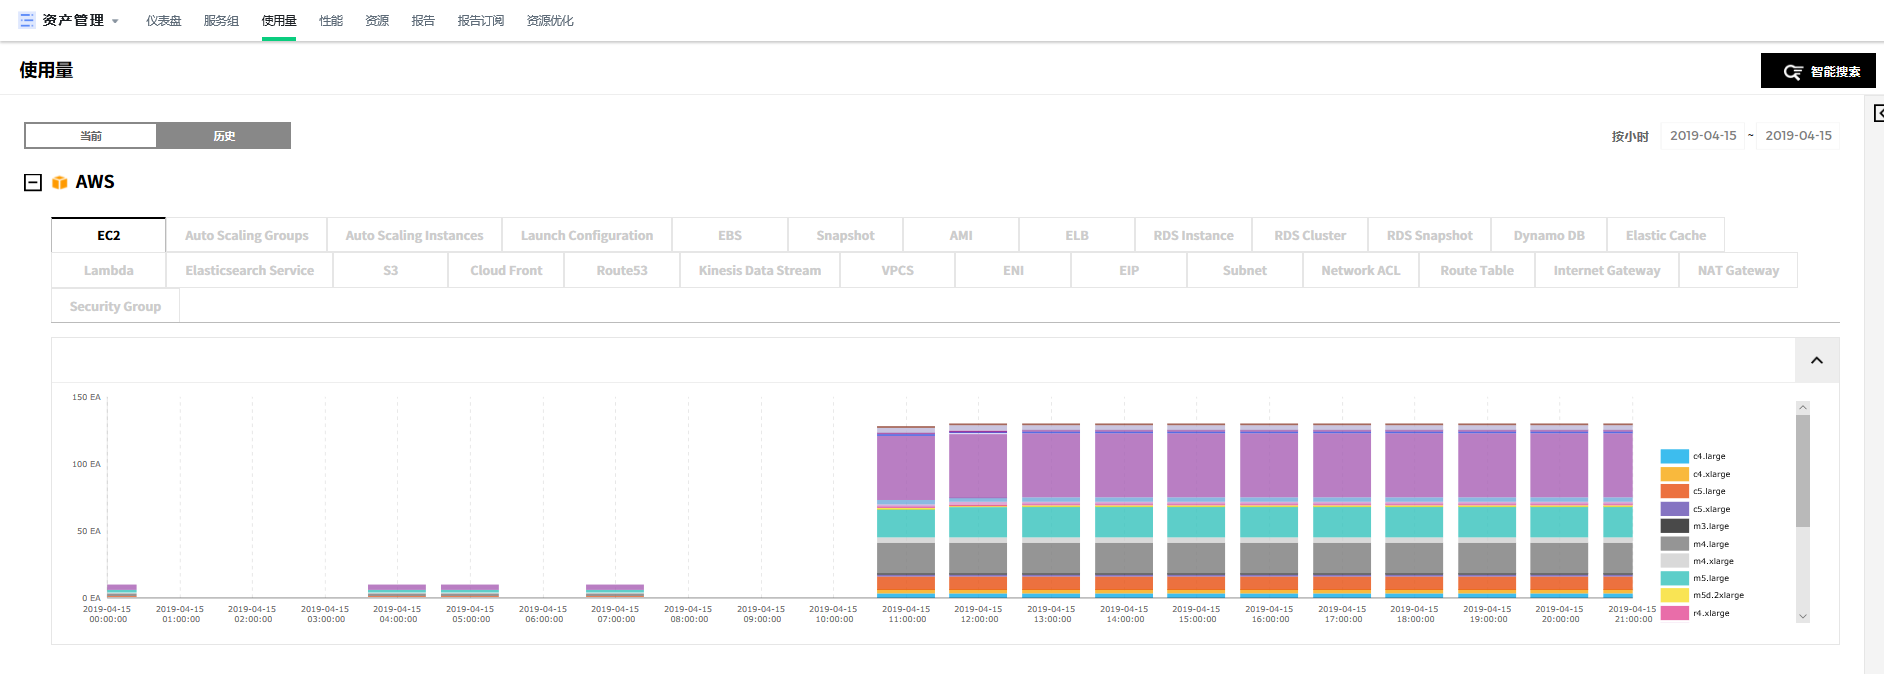
将显示按日期显示的资源历史记录的图形表示,下表显示正在使用的资源列表。
Amazon Web Services
可以查看下列有关Amazon Web Services资源的使用历史。
AMI, EBS, EC2, EIP, Internet Gateway, Lambda, Network ACL, RDS, Route Table, S3, Security Group, Snapshot, Subnet, VPCS, ELB, Dynamo DB, Elastic Cache, CloudFront, Kinesis Data Stream, ENI, NAT Gateway
Microsoft Azure
可以查看下列有关Microsoft Azure资源的使用历史。
Database, Storage, Virtual Machine
Alibaba Cloud
可以查看下列有关Alibaba Cloud资源的使用历史。
Elastic Compute Service, Cloud Disk, Launch Template, Server Load Balancer, Scaling Group, Scaling Instance, Scaling Configuration, Snapshot, Snapshot Chain, Image, ApsaraDB for RDS, ApsaraDB for MongoDB, ApsaraDB for Redis, ApsaraDB for Memcache, HybridDB for MySQL, HybridDB for PostgreSQL, POLARDB Cluster, POLARDB Instance, Object Storage Service, Alibaba Cloud CDN, Elastic IP Address, Security Group, Virtual Private Cloud, NAT Gateway, VPN Gateway, Network Interface
Google Cloud Platform
可以查看下列有关Google Cloud Platform资源的使用历史。
VM Instance, Compute Disk, Big Table, Big Query, SQL Instance, Storage Bucket, VPC, Subnet
Resource Details
Resource Details helps you to view the detailed information of the resources such as service group, tag, cost, performance data, and activities in a single dashboard.
You can go to Resource Details directly from the Usage or Right Sizing menu of Asset Management. Or click Detail Link of the resource ID you want to view from the Asset Management console.
General
Detailed Information
You can view resource details, service group, and tag list on the detail information tab. This table contains account, life cycle, OS, status, instance type, and region of the selected resource. In the body section, you can find detailed information about AWS method calls as well.
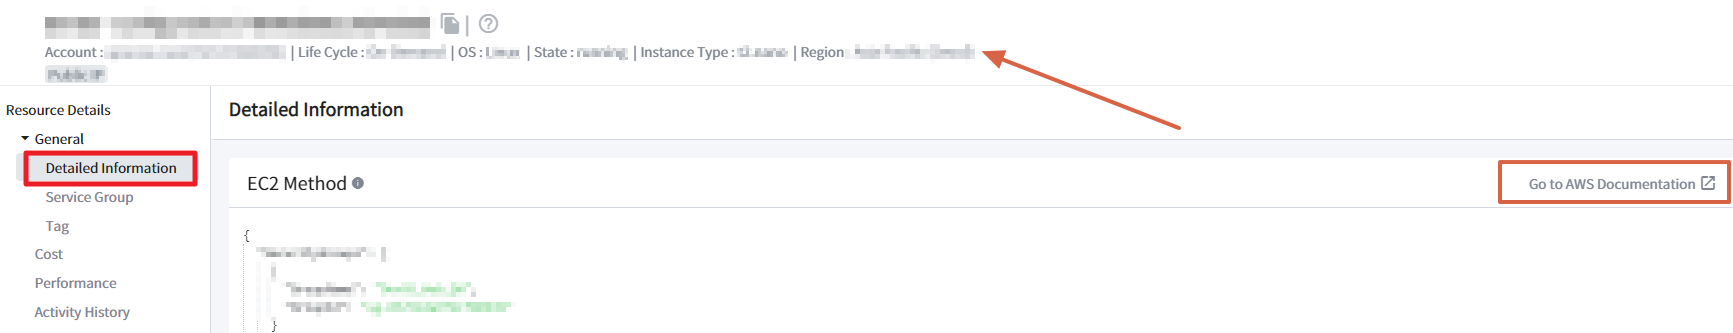
Click Go to AWS Documentation to find out more about the method.
Service Group
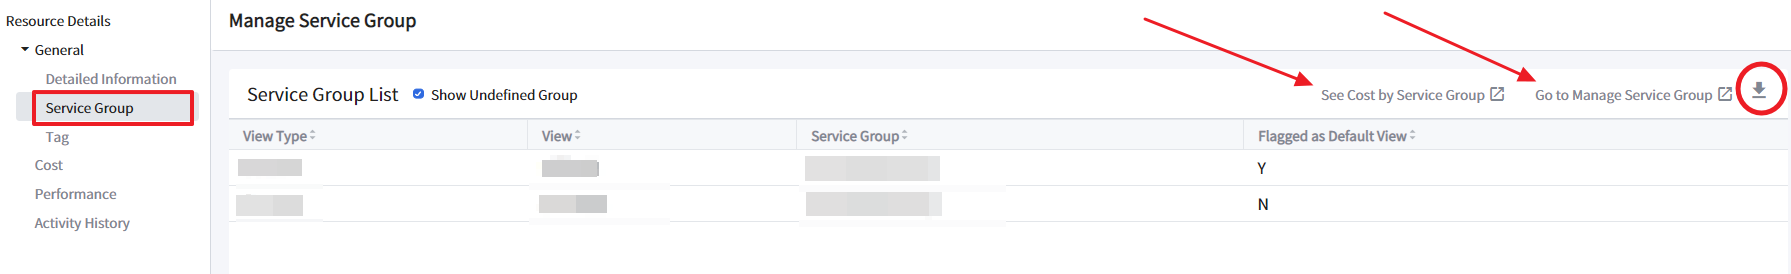
If you have already created a service group in Service Portal, you can view the service group of the resource. You can check the View Type, View name, Service Group name and whether the View is selected as a Default View (Y) or not (N). View Type is displayed in either Automated View or Custom View.
You can also view groups that are not grouped in the service group by checking Show Undefined Group.
If you want to see the cost by service groups, click See Cost by Service Group on the upper-right corner of the table. It will lead you straight to Asset Management service > Service Group menu. You can see the number and cost of the resources by service groups under the selected View and Account.
If you want to create or manage service groups, click Go to Manage Service Group. You can create or manage service groups from the Service Portal service > Manage Service Group menu. You can also download the Service Group List in the CSV file by clicking the download button, indicated in a red circle.
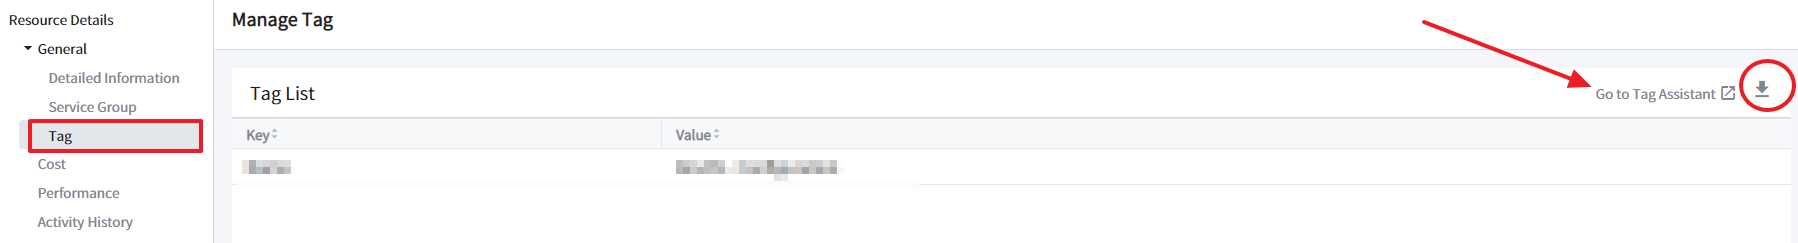
Tag
Here you can view the tag key and tag value of the selected resource. You can go straight to the Tag Assistant menu in the Service Portal by clicking Go to Tag Assistant to set tags for your resources. You can also download the list in the CSV file by clicking the download button next to the link.
Cost
Cost Trend
- Cost Trend shows trends in costs over time. To view the cost trends, specify the data range and select the view option, and select a resource name or resource ID of the resource for grouping conditions. For example, if you select Name for grouping conditions to view daily cost trends in December and the daily chart is selected, you will find the chart below. Items used for grouping conditions are Name, Resource ID, Usage Type, Record Type, Operation Name, Product, Sub Product, and Region.
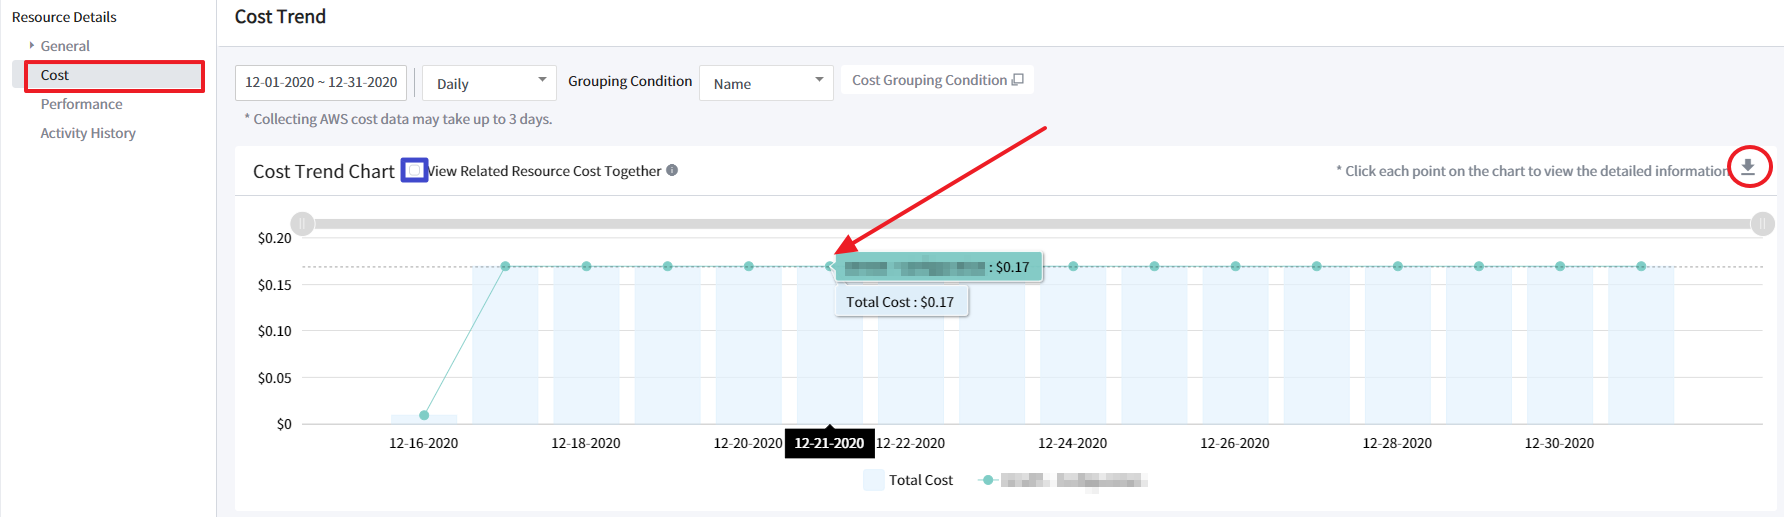
📜 Note: It may take up to three days to collect costs from AWS.
- Select the checkbox of View Related Resource Cost Together to view costs of related resources that are associated with the current resource. For example, you can check the costs of Snapshot or EBS that are operating with EC2. When you hover your mouse to data points on the trend chart, a tooltip appears displaying detailed information about the field. You can also download the CSV file to view the whole data.
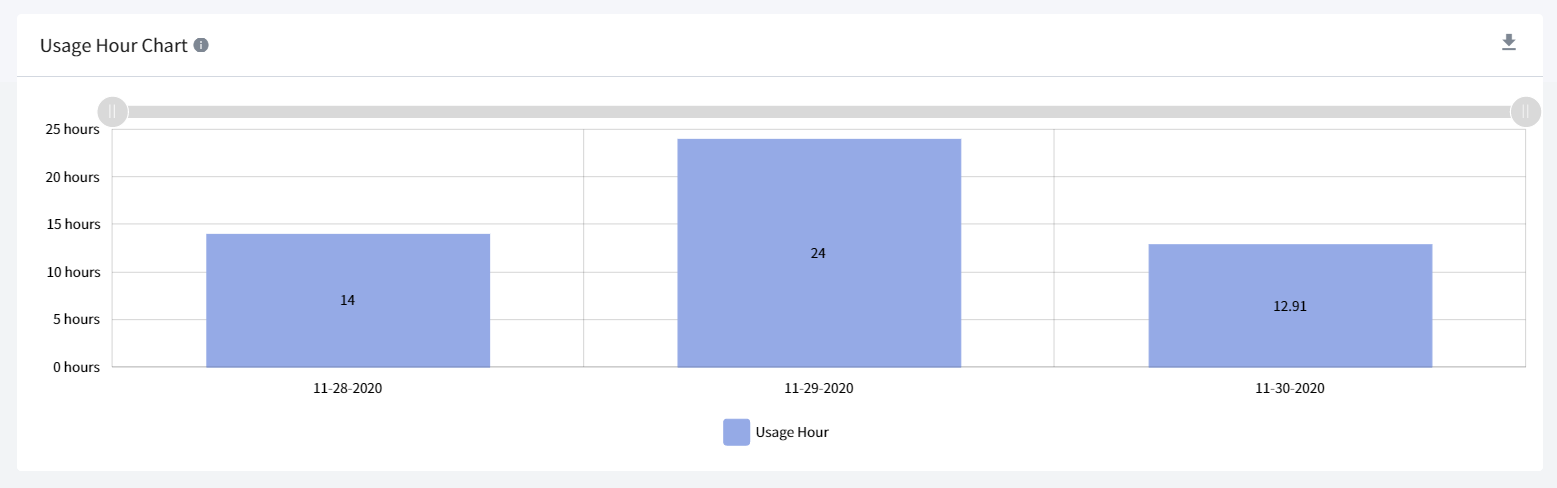
Usage Hour Chart
Usage hour chart shows the total number of hours the instance was running during the day.
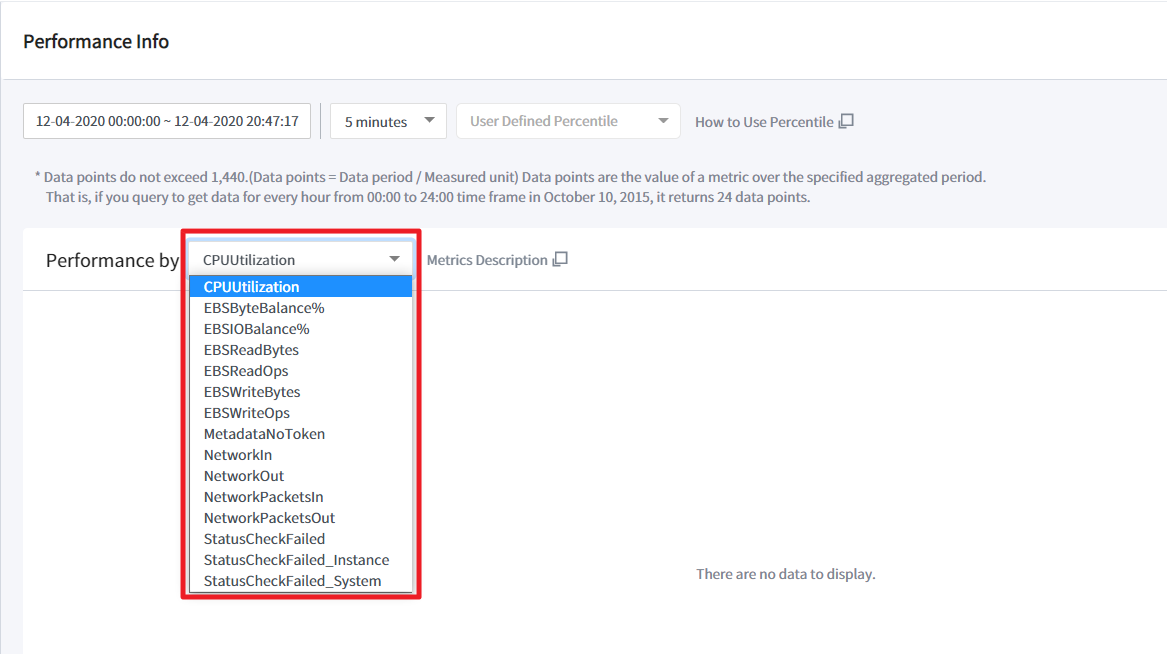
Performance
You can view data points as a percentile over a specified period for filtering resource performance by metrics. Percentiles are statistical measures that can show you how data points compare to a total distribution over time. If outliers can skew how the distribution displays in your chart, making it difficult to notice patterns or average values, visualize data by excluding outliers from the data range and displaying the 5th-95th percentiles. You may drag the gray bar on the chart to zoom in and out to adjust the period once again.
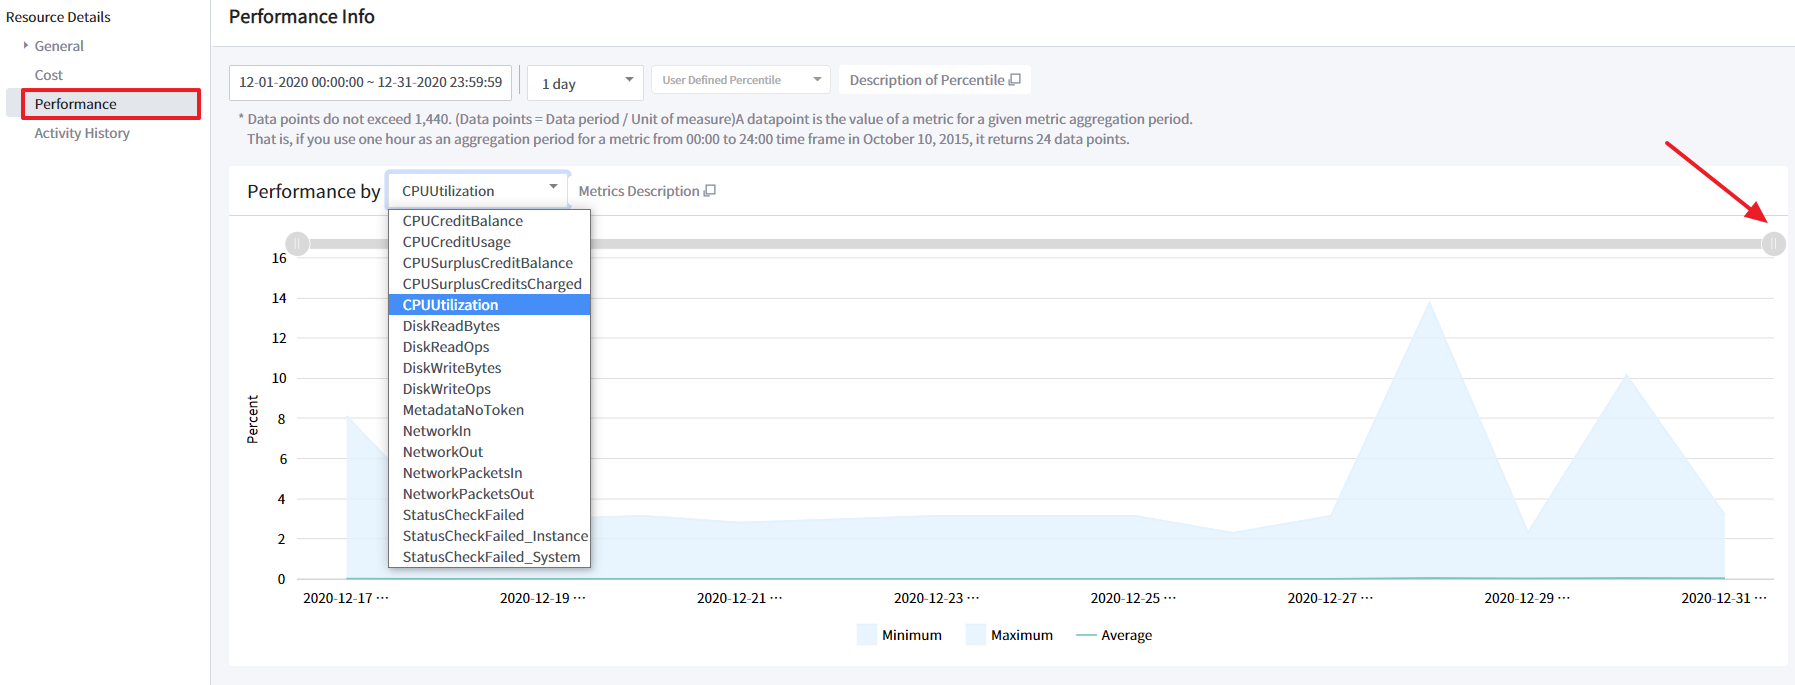
The maximum number of data points returned from a single call is 1,440, so if you request more than 1,440, it will return an error message. To reduce the number of data points, you need to narrow the specified time range or increase the specified period.
📜 Note: Metrics like CPUUtilization and NetworkIn used for performance are imported from AWS.
Activity History
Look up and view the past activities of the resource. On this page, you can filter, search and view Management Events or CloudTrail Insights events that are captured by CloudTrail. It may take up to 15 minutes to view after the event occurrence. Select period and event names that you wish to view. You can only look up events that occurred in the resources within the last 90 days using the CloudTrail. Events older than 90 days will not be archived in CloudTrail.
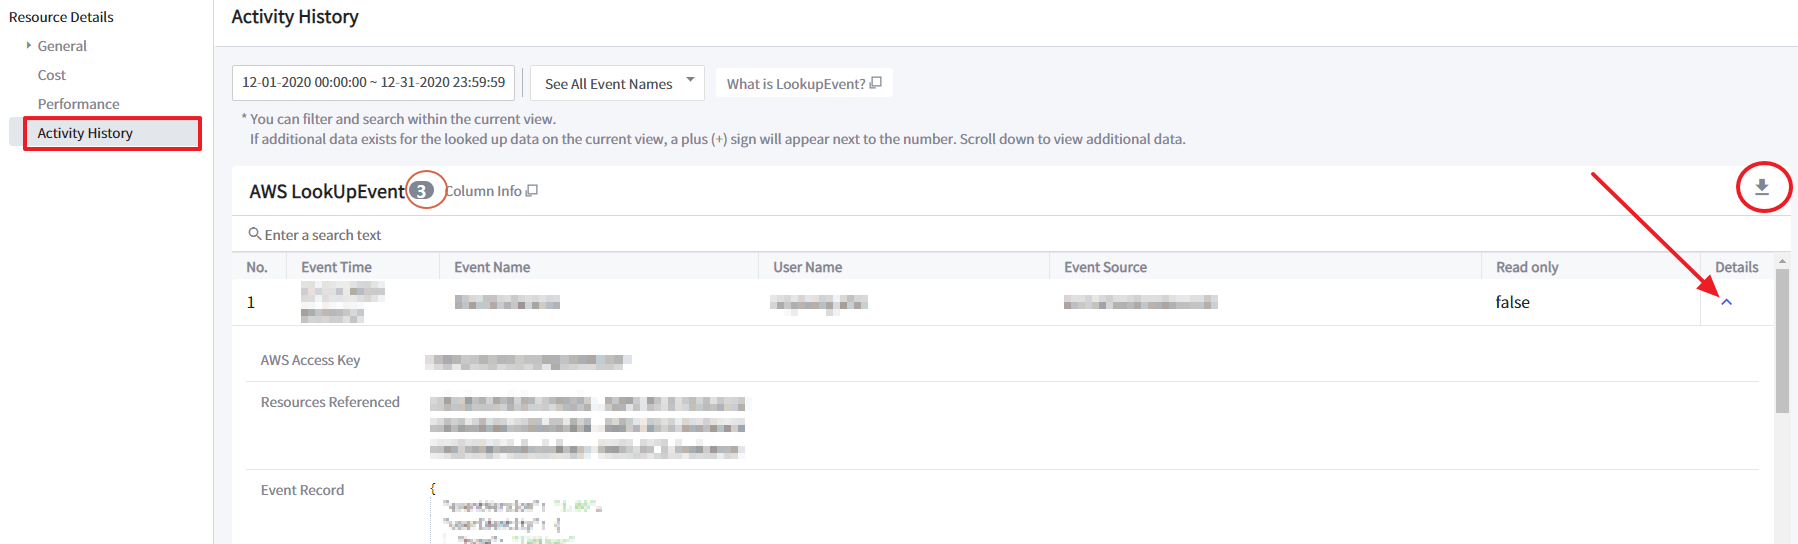
You can only filter and search within the current view. If additional data exists for the looked up data on the current view, a plus (+) sign will appear next to the number, shown right side of AWS LookUpEvent. Scroll down to view additional data. You can also download the CSV file of the activity history.
| Item | Description |
|---|---|
| Event Time | The local time that the event occurred. |
| Event Name | The name of the event occurred in the resources. This is typically the API name that is associated with the event, such as CreateTrail. |
| User Name | The name of the user who triggered the event or the User ID referenced in the event. For example, this can be an IAM user, an IAM role name, or a service role. |
| Event Source | The AWS API endpoint where the event originated, such as ec2.amazonaws.com |
| Resources Referenced | Resources referenced describes the name or ID of resources that are referenced by the event. For example, the resource name might be auto-scaling-test-group for an Auto Scaling group, or i-123456789012 for an Amazon EC2 instance. Resources referenced can be resources that were read or changed by an event. |
| Event Record | The Event record, sometimes called the event payload, is the full JSON text of an event. The record contains fields that help you determine the requested action as well as when and where the request was made. |
| AWS Access Key | The AWS access key ID that was used to sign the request. If the request was made with temporary security credentials, this is the access key ID of the temporary credentials. |
| Read Only | The read type of the event. Events are categorized as read events or write events. |
性能
资源管理 > 性能
可以查看正在使用的资源的性能状态和历史。
当前
可以查看正在使用的资源的性能状态。
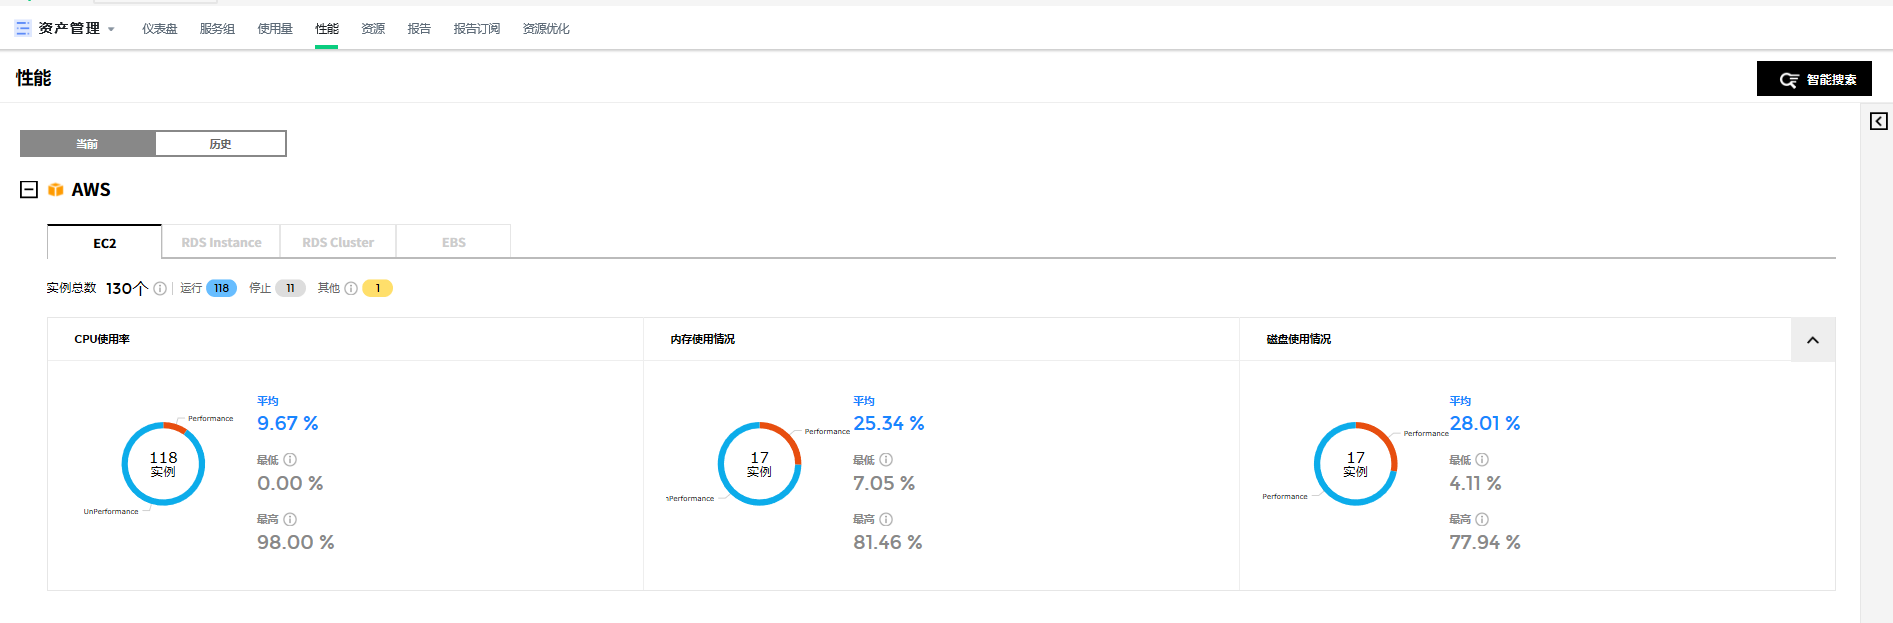
Amazon Web Services
可以查看下列有关Amazon Web Services资源的性能状态。
| 资源 | 显示项目 | 备注 |
|---|---|---|
| EC2 | 资源详情 | |
| CPU 利用率(%) | 最低,最高,平均 | |
| 内存利用率 (%) | 最低,最高,平均 | |
| 磁盘空间利用率 (%) | 最低,最高,平均 | |
| EBS | 资源详情 | |
| 卷队列长度 (个) | 最低,最高,平均 | |
| 读取IOPS (个) | 最低,最高,平均 | |
| 卷写入字节 (兆) | 最低,最高,平均 | |
| 写入IOPS (个) | 最低,最高,平均 | |
| RDS | 资源详情 | |
| CPU 利用率 (%) | 最低,最高,平均 | |
| 可用内存 (兆) | 最低,最高,平均 | |
| 免费存储空间(兆) | 最低,最高,平均 | |
| 读取 IOPS (个) | 最低,最高,平均 | |
| 写入 IOPS (个) | 最低,最高,平均 |
Microsoft Azure
可以查看下列有关Microsoft Azure资源的性能状态。
| 资源 | 显示项目 | 备注 |
|---|---|---|
| Virtual Machine | 资源详情 | |
| CPU 利用率 (%) | 最低,最高,平均 | |
| 内存利用率 (%) | 最低,最高,平均 | |
| 磁盘空间利用率 (%) | 最低,最高,平均 | |
| SQL Database | 资源详情 | |
| CPU 利用率 (%) | 最低,最高,平均 | |
| 物理数据读取百分比 (%) | 最低,最高,平均 | |
| 连接成功(个) | 最低,最高,平均 | |
| 连接失败(个) | 最低,最高,平均 | |
| DTU 消费 (%) | 最低,最高,平均 | |
| 死锁(个) | 最低,最高,平均 |
Alibaba Cloud
可以查看下列有关Alibaba Cloud资源的性能状态。
| 资源 | 显示项目 | 备注 |
|---|---|---|
| ECS | 资源详情 | |
| CPU 利用率 (%) | 最低,最高,平均 | |
| 内存利用率 (%) | 最低,最高,平均 | |
| 磁盘空间利用率 (%) | 最低,最高,平均 | |
| RDS | 资源详情 | |
| CPU 利用率 (%) | 最低,最高,平均 | |
| 内存利用率 (%) | 最低,最高,平均 | |
| 磁盘空间利用率 (%) | 最低,最高,平均 | |
| IOPS (%) | 最低,最高,平均 |
移动至GCP控制台
当前菜单中提供移动至控制台的功能,您可以在GCP控制台直接查看所选资源的信息。您可以通过以下两种方式前往GCP控制台。
点击资源列表Console列的Console链接前往GCP控制台。
![]()
点击资源列表中的资源会出现如下详情页面。点击详情页面上端的移动至GCP控制台前往。
![]()
选择两种方法中的任意一种即会出现如下弹窗,然后可移动到GCP控制台。
![]()
移动到GCP控制台后,如果页面没有数据,请在页面右上方的账户信息中确认是否选择了正确的账户登录。如果登录的不是正确的账户,需要用有权限的其它账户重新登录才能显示数据。
- 在谷歌浏览器中登录有权限的账户时,可以在GCP控制台直接查看数据,更加便利。
Google Cloud Platform
可以查看下列有关Google Cloud Platform资源的性能状态。
| 资源 | 显示项目 | 备注 |
|---|---|---|
| VM Instance | 资源详情 | |
| CPU 利用率 (%) | 最低,最高,平均 | |
| 内存利用率 (%) | 最低,最高,平均 | |
| 磁盘空间利用率 (%) | 最低,最高,平均 | |
| Compute Disk | 资源详情 | |
| Read IOPS | 最低,最高,平均 | |
| Write IOPS | 最低,最高,平均 | |
| SQL Instance | 资源详情 | |
| CPU 利用率 (%) | 最低,最高,平均 | |
| 内存利用率 (%) | 最低,最高,平均 | |
| 磁盘空间利用率 (%) | 最低,最高,平均 |
历史
资产管理 > 性能 > 历史
可以查看所选期间的资源性能历史。

Amazon Web Services
可以查看下列有关Amazon Web Services资源的性能历史。
| 资源 | 显示项目 | 备注 |
|---|---|---|
| EC2 | 资源详情 | |
| CPU 利用率 (%) | 最低,最高,平均 | |
| 内存利用率 (%) | 最低,最高,平均 | |
| 磁盘空间利用率 (%) | 最低,最高,平均 | |
| EBS | 资源详情 | |
| VolumeQueue Length (个) | 最低,最高,平均 | |
| VolumeRead IOPS (个) | 最低,最高,平均 | |
| VolumeWrite Bytes (兆) | 最低,最高,平均 | |
| VolumeWrite IOPS (个) | 最低,最高,平均 | |
| RDS | 资源详情 | |
| CPU 利用率 (%) | 最低,最高,平均 | |
| Freeable Memory (兆) | 最低,最高,平均 | |
| Free Storage Space (兆) | 最低,最高,平均 | |
| Read IOPS (个) | 最低,最高,平均 | |
| Write IOPS (个) | 最低,最高,平均 |
Microsoft Azure
可以查看下列有关Microsoft Azure资源的性能历史。
| 资源 | 显示项目 | 备注 |
|---|---|---|
| Virtual Machine | 资源详情 | |
| CPU 利用率 (%) | 最低,最高,平均 | |
| 内存利用率 (%) | 最低,最高,平均 | |
| 磁盘空间利用率 (%) | 最低,最高,平均 | |
| SQL Database | 资源详情 | |
| CPU 利用率 (%) | 最低,最高,平均 | |
| 物理数据读取百分比 (%) | 最低,最高,平均 | |
| 连接成功(个) | 最低,最高,平均 | |
| 连接失败(个) | 最低,最高,平均 | |
| DTU 消费 (%) | 最低,最高,平均 | |
| 死锁(个) | 最低,最高,平均 |
Alibaba Cloud
可以查看下列有关Alibaba Cloud资源的性能历史。
| 资源 | 显示项目 | 备注 |
|---|---|---|
| ECS | 资源详情 | |
| CPU 利用率 (%) | 最低,最高,平均 | |
| 内存利用率 (%) | 最低,最高,平均 | |
| 磁盘空间利用率 (%) | 最低,最高,平均 | |
| RDS | 资源详情 | |
| CPU 利用率 (%) | 最低,最高,平均 | |
| 内存利用率 (%) | 最低,最高,平均 | |
| 磁盘空间利用率 (%) | 最低,最高,平均 | |
| IOPS (%) | 最低,最高,平均 |
Google Cloud Platform
可以查看下列有关Google Cloud Platform资源的性能历史。
| 资源 | 显示项目 | 备注 |
|---|---|---|
| VM Instance | 资源详情 | |
| CPU 利用率 (%) | 最低,最高,平均 | |
| 内存利用率 (%) | 最低,最高,平均 | |
| 磁盘空间利用率 (%) | 最低,最高,平均 | |
| Compute Disk | 资源详情 | |
| Read IOPS | 最低,最高,平均 | |
| Write IOPS | 最低,最高,平均 | |
| SQL Instance | 资源详情 | |
| CPU 利用率 (%) | 最低,最高,平均 | |
| 内存利用率 (%) | 最低,最高,平均 | |
| 磁盘空间利用率 (%) | 最低,最高,平均 |
智能搜索
根据您使用的资源的关系提供智能搜索功能。 显示所选日期范围内使用的所有资源的列表,您可以将它们用作搜索条件。“使用和性能”菜单中提供了“智能搜索”功能。

期间:在当前中,可以查看当前日期资源的使用情况的历史; 在历史中,可以选择要查看资源使用历史的期间。
根据所选的期间,可选择的搜索条件可能会被变更,在此期间内使用的资源会自动包含在搜索条件中。期间可以按小时/天/周/月设置。搜索条件:显示云服务、账户、区域、服务组、产品、标签为搜索条件。选择搜索条件时,只能选择与该条件相关的搜索条件。例如,当选择AWS作为云服务时,无法选择其他云服务的资源。设置期间和搜索条件后,点击【应用】按钮,显示所选期间和搜索条件的结果。

资源优化
通过资源优化,可以一目了然地了解当前正在运行的资源是否处于使用状态,同时通过性能对比可以了解到该资源是否被有效利用。基于此,您可以通过释放存在浪费资源来优化资源环境。在资源管理中点击资源优化菜单。
- 资源优化包括如下内容
| 项 | 说明 |
|---|---|
| 概要 | 显示有关Unused Resource和 Right Sizing的概要信息。 |
| Unused Resource | 已创建但未使用或由于无使用量而被视为不使用的资源推荐为Unused Resource,以便节省费用。 |
| Right Sizing | 通过对资源的性能分析,根据用户设置的将建议的对象分为Downsizing, Upsizing, Modernize, Idle。 |
| 设置 | 可以输入,修改和删除资源优化所需的配置信息。 |
| 首次访问时将创建基本条件,并且用户可以通过基于创建的基本条件,每天接收有关Unused Resource和Right Sizing的分析建议。 |
概要
概要页面内容构成如下所示。
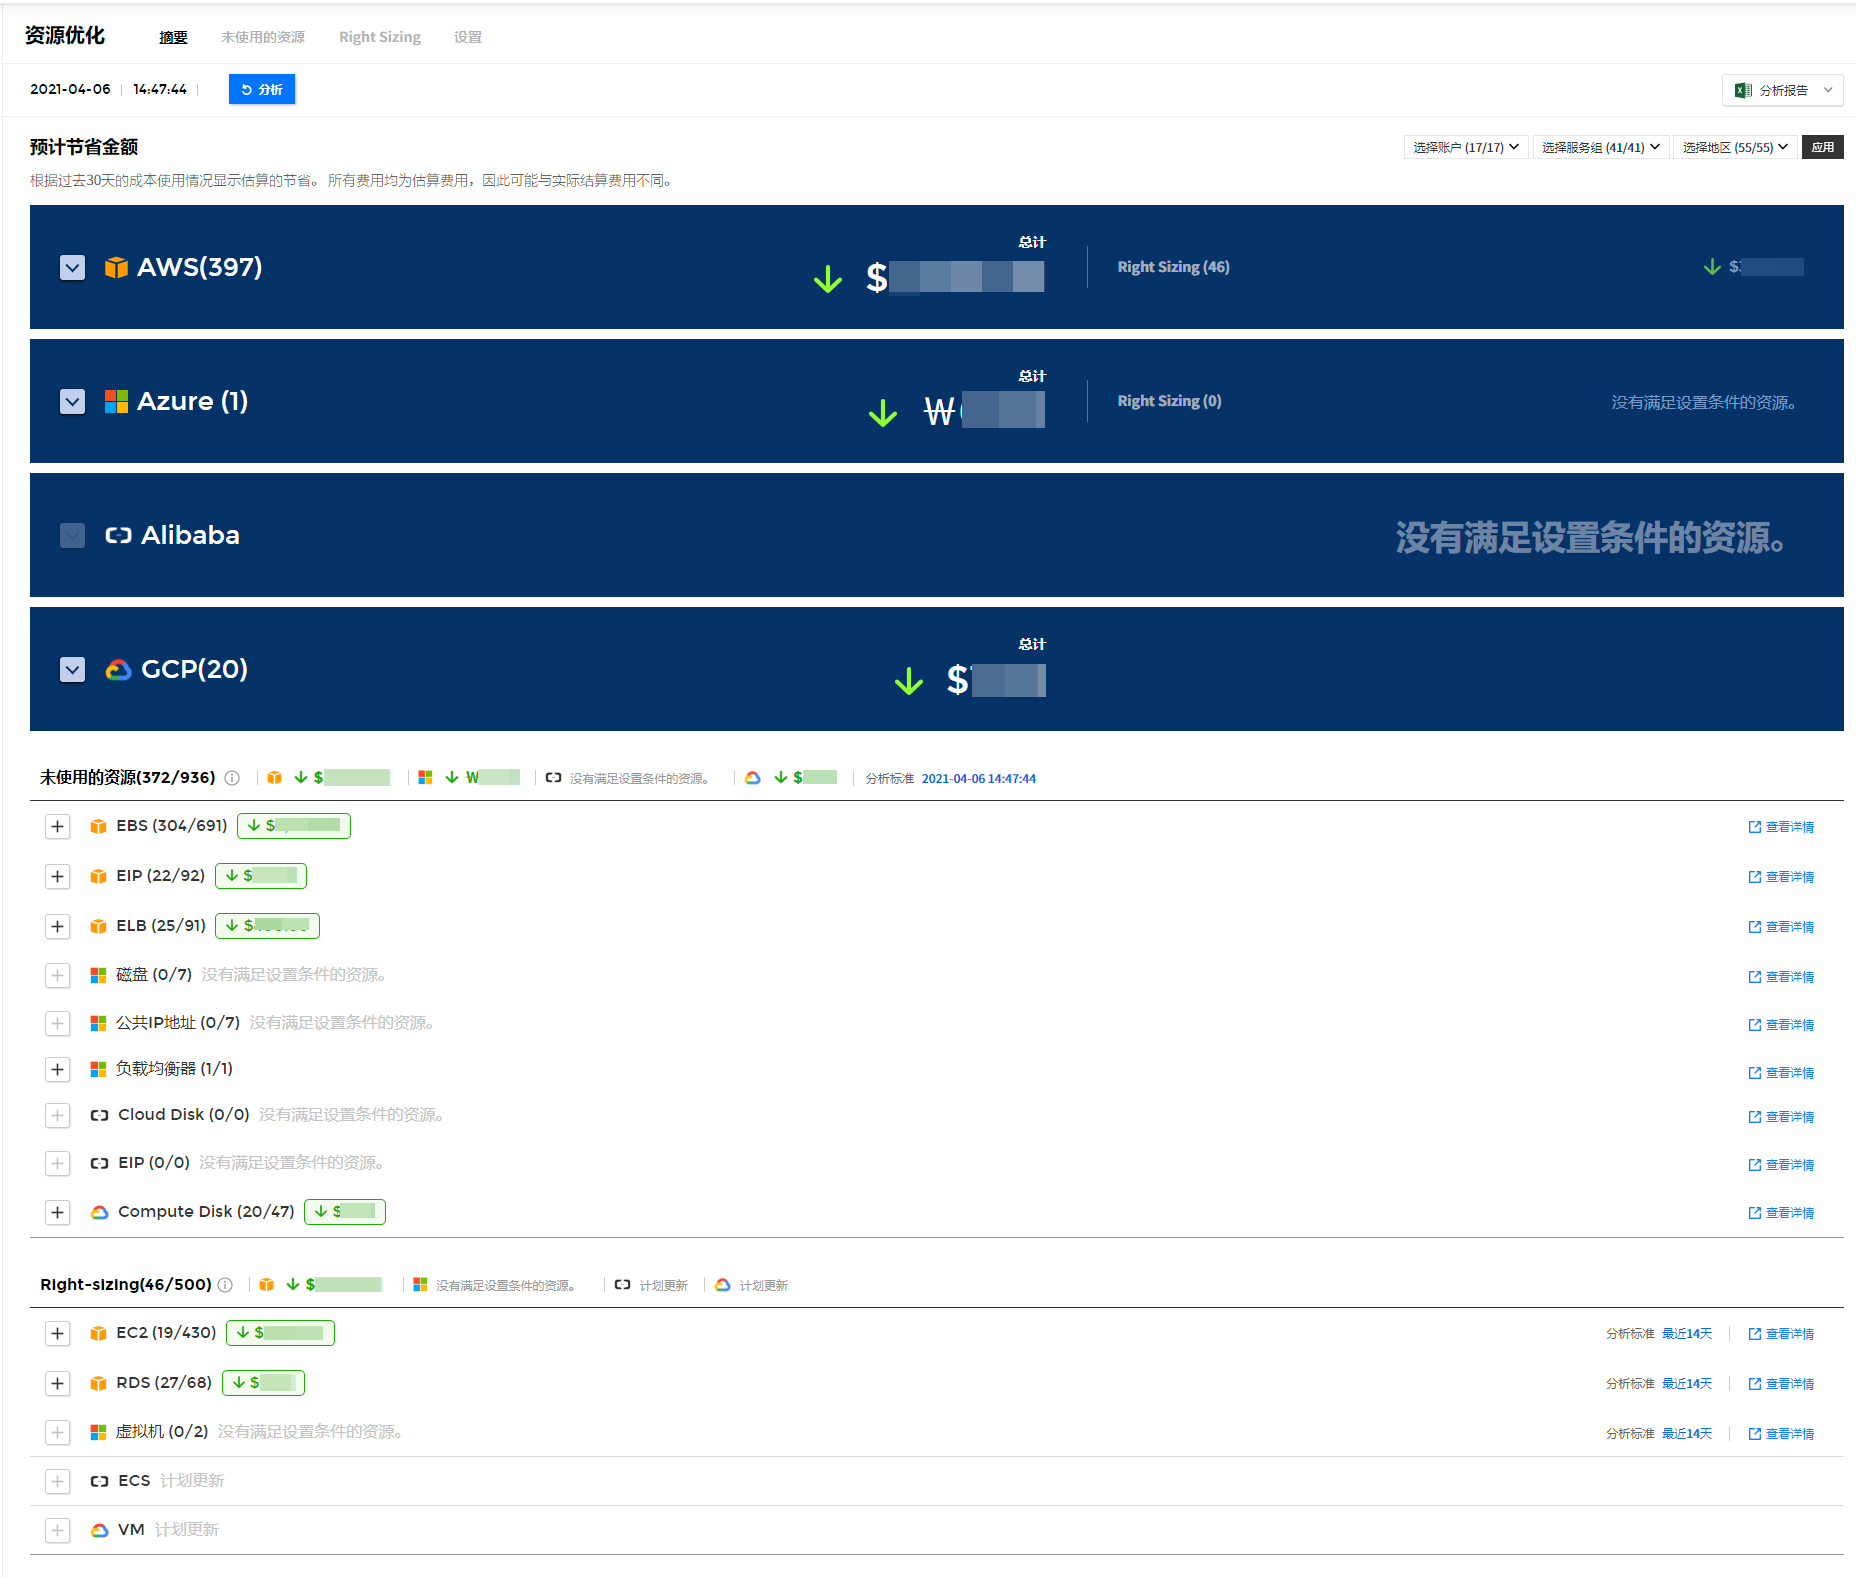
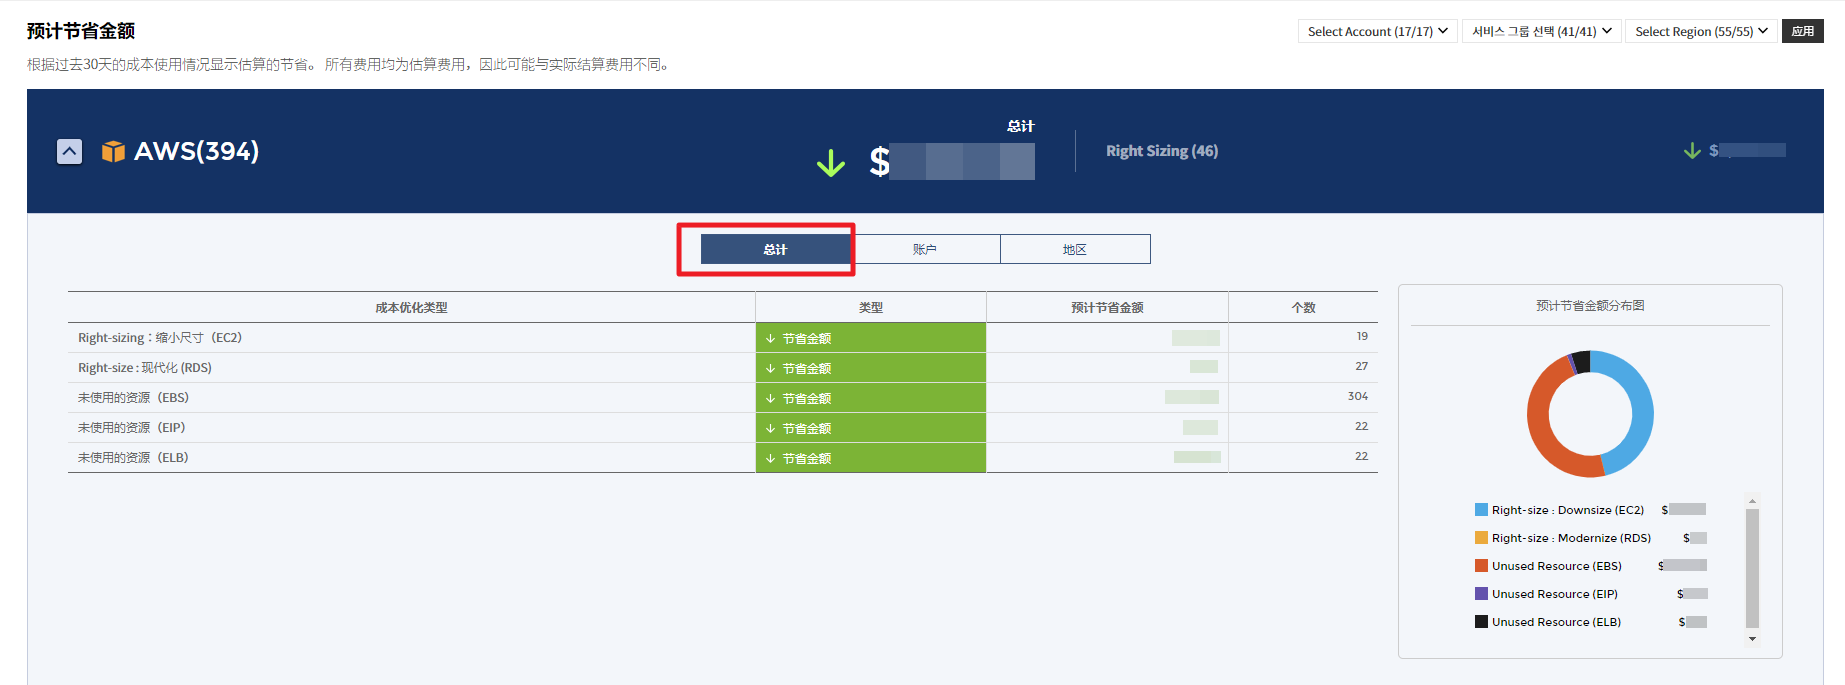
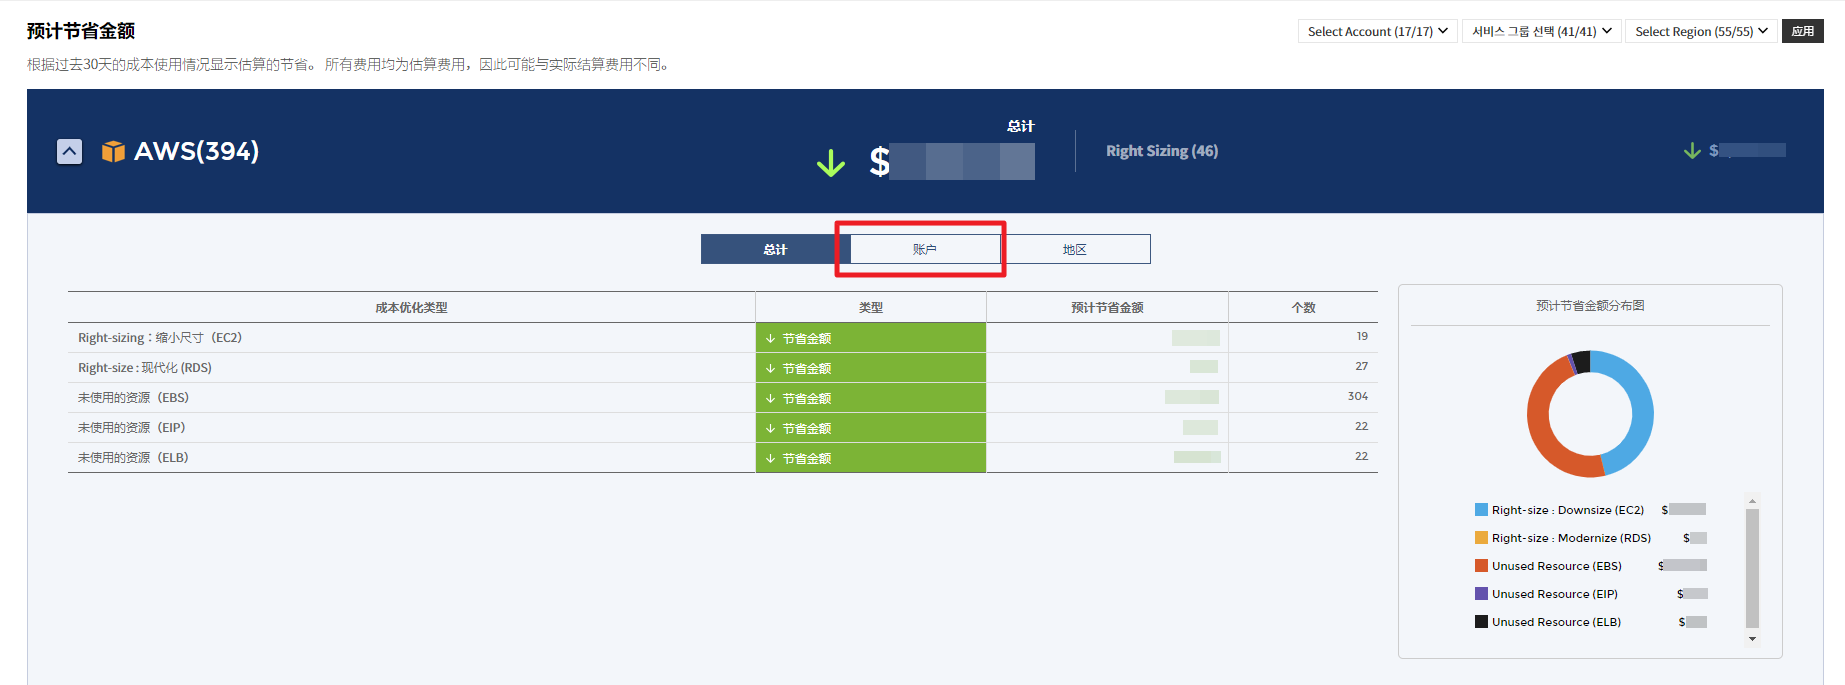
Total
对Unused Resource 和 Right Sizing, 可以通过表格及图形的方式查看按资源优化类型的预计节省金额及预计增加金额。
Account
对Unused Resource 和 Right Sizing,可以通过表格及图形的方式查看按云账户的预计节省金额及预计增加金额。
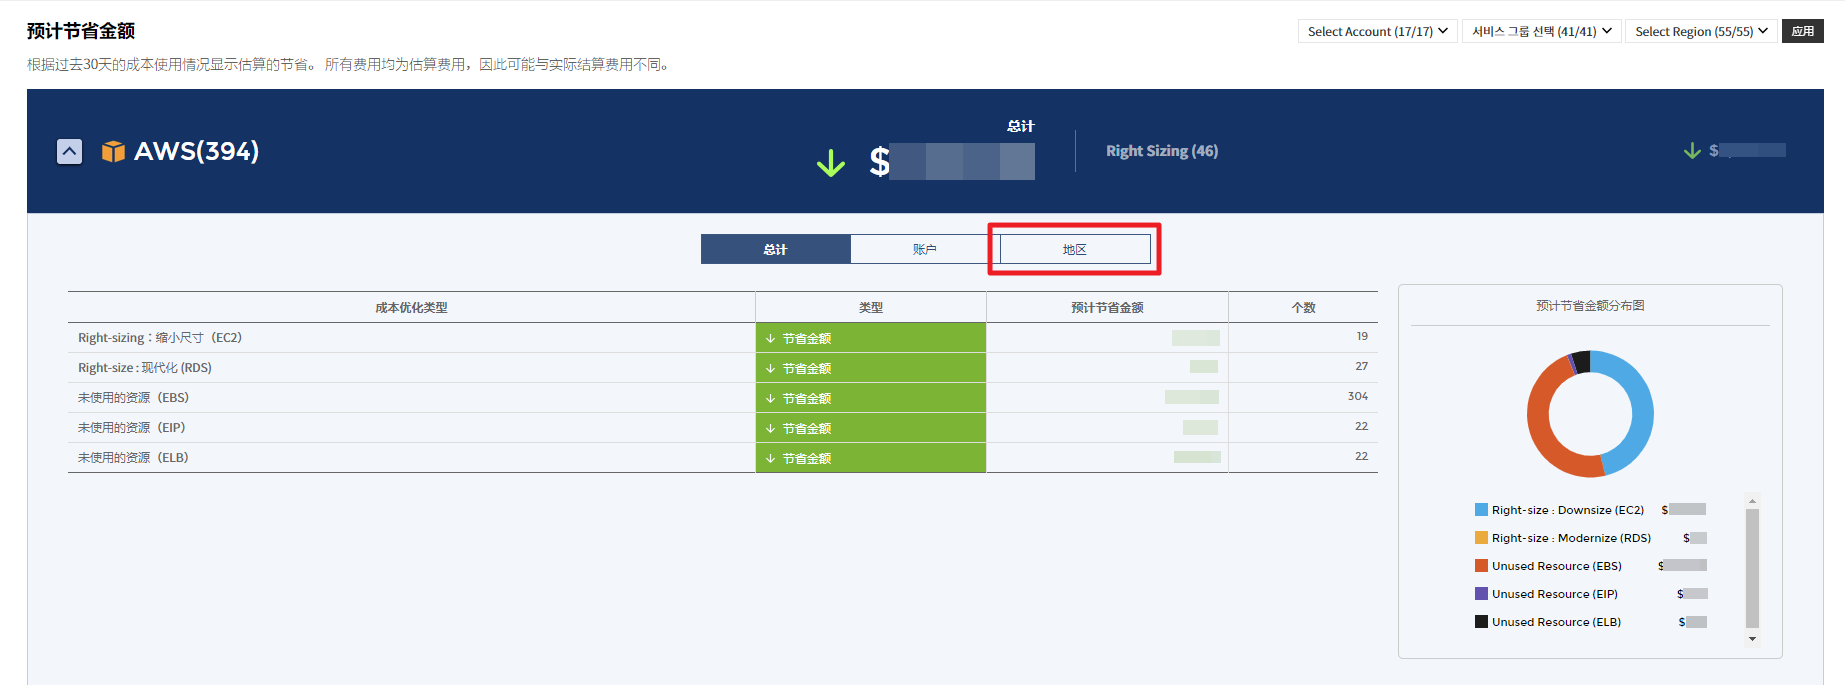
Region
对Unused Resource 和 Right Sizing,可以通过表格及图形的方式查看按区域的预计节省金额及预计增加金额。
Unused Resource
提供按云服务的Unused Resource的列表。可以查看预估金额(预计节省金额+预计增加金额)及费用增减的比率。通过列表中的“原因”确认推荐资源被归为Unused Resource的原因。
Right Sizing
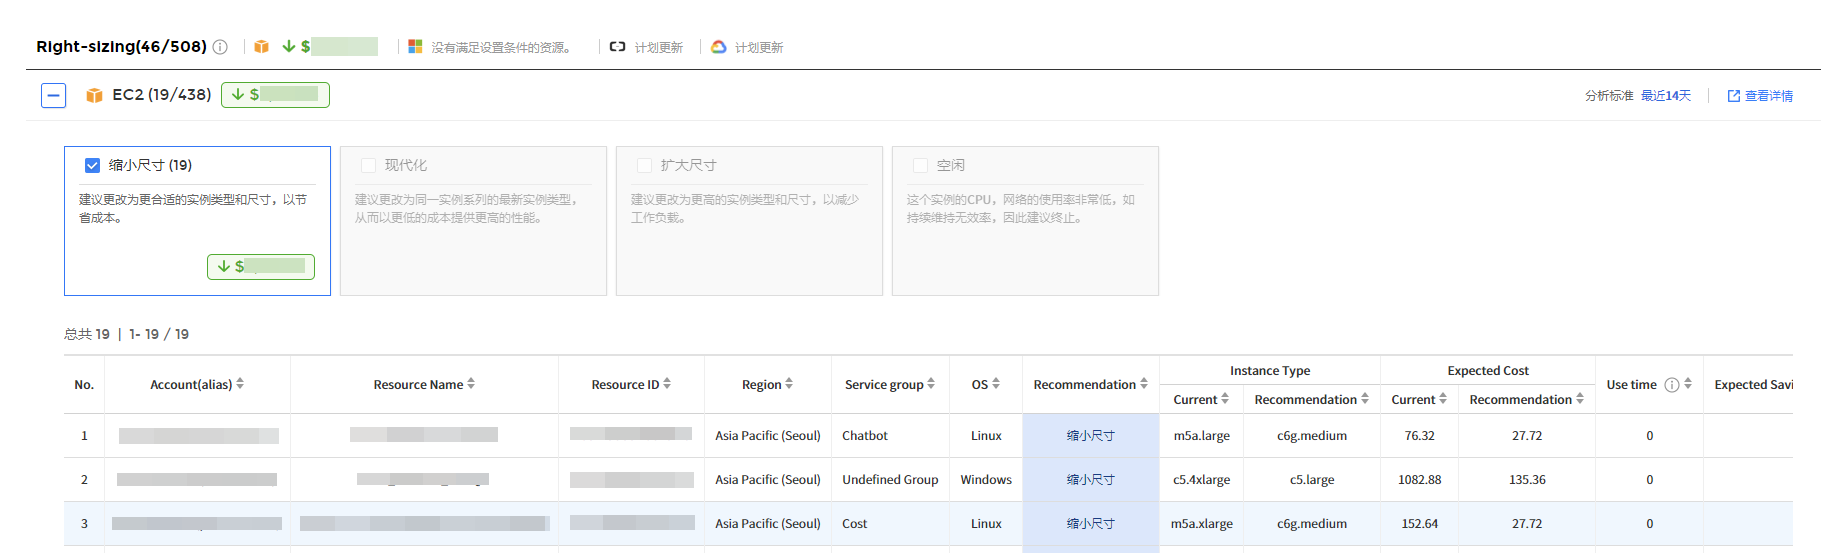
① 提供按云服务的Right Sizing的列表。可以查看预估金额(预计节省金额+预计增加金额)及费用增减的比率。
② 可以通过选择所需的推荐类型来查看可优化内容。(选中顶部的各个类型的复选框)
③ 在“推荐”项中,可以查看Right Sizing推荐类型(Downsize, Upsize, Modernize, Idle Resource),在“实例类型”项的推荐中,可以查看基于“现有类型”所推荐的实例类型。推荐类型为Idle Resource时,则在“推荐”项中显示为“Terminate”
Right Sizing 推荐类型
| 推荐类型 | 说明 | 示例 |
|---|---|---|
| Upsize | 推荐使用更高性能的实例。 | t2.medium -> t2.large |
| Downsize | 推荐使用性能较低但价格更为便宜的实例。 | t2.medium -> t2.micro |
| Modernize | 推荐使用同一类型中最新类型的实例。 | r3.large -> r4.large |
| Idle Resource | 判断为使用频率低,因此推荐终止实例。 | 标示为Terminate |
④ 在“预期成本”项中“当前”是过去30天的预估的使用金额,“建议”是按照在“实例类型”项中的建议适用或终止后的30天的预估的使用金额。(Downsize时费用将会节省,Upsize时费用将增加,Idle时费用将显示为0)
⑤ 预期节省成本(30天)是在“预期成本”项的“当前”和“推荐”的差额,可以查看30天内预计节省或增加的成本。
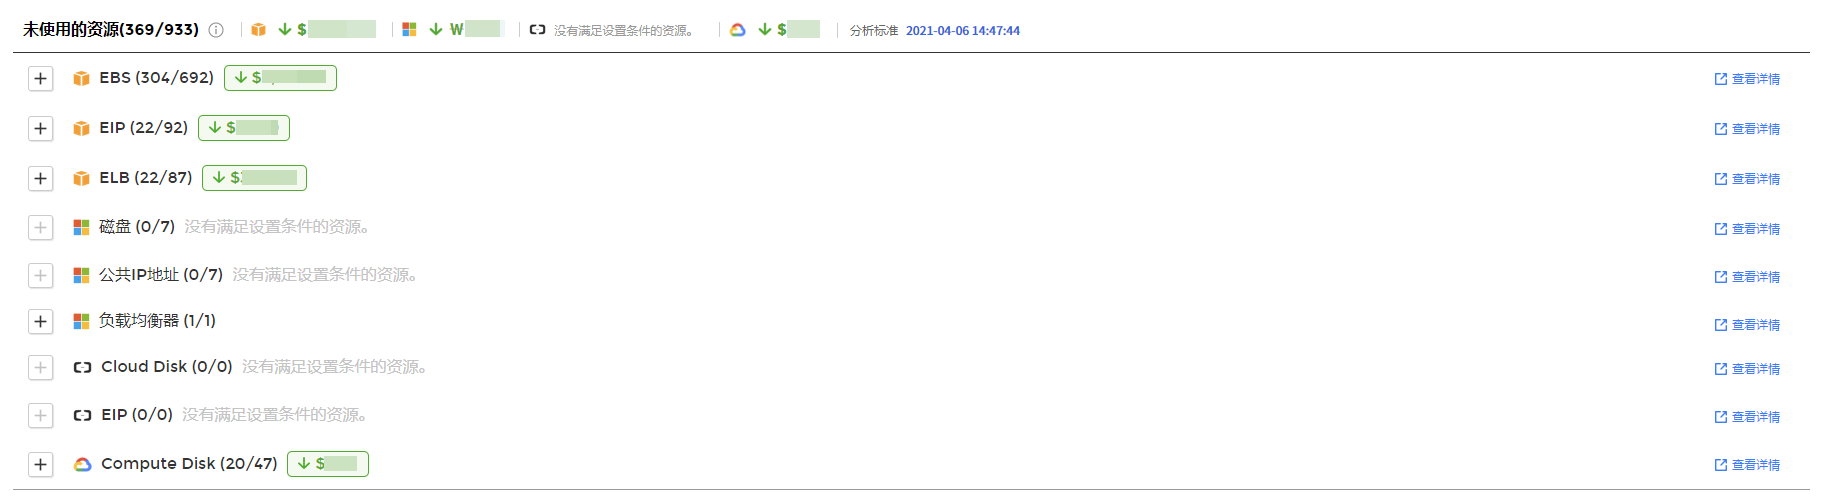
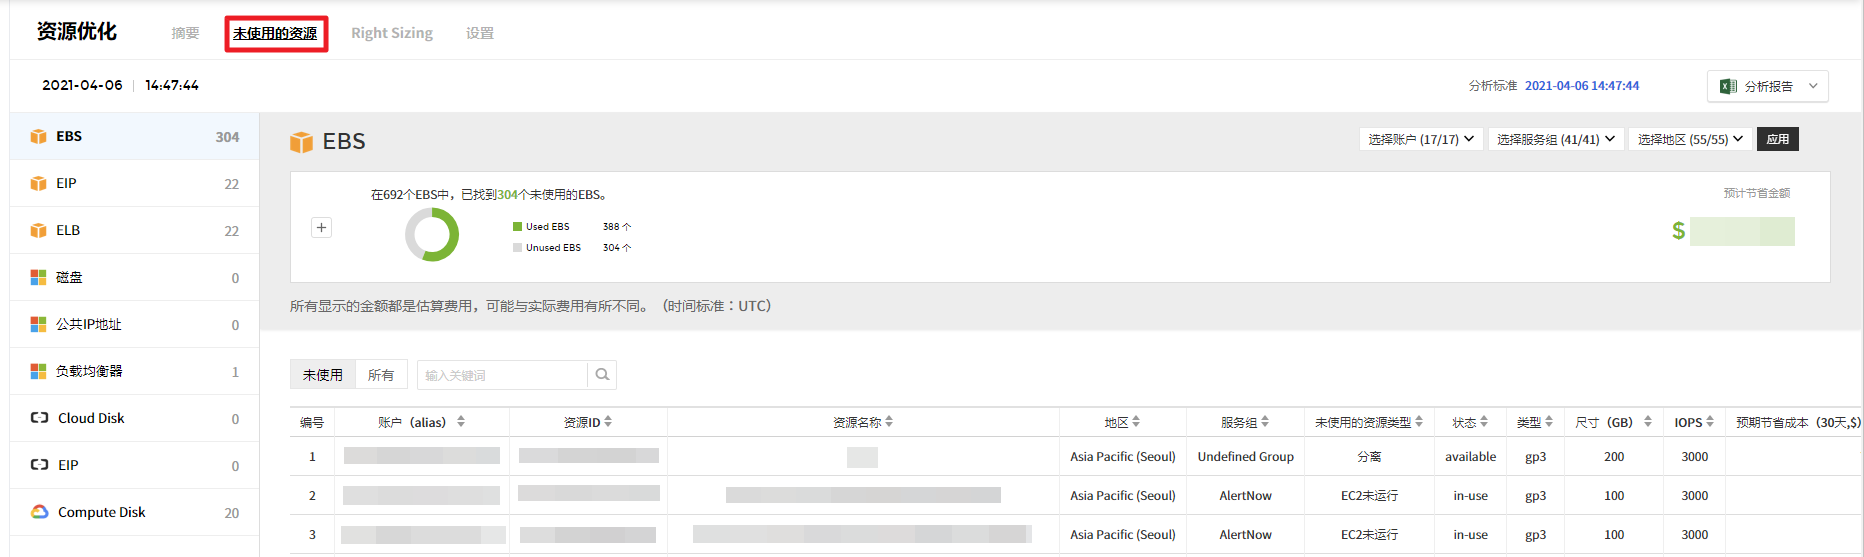
Unused Resource
提供推荐的Unused Resource的详细页面。
推荐列表(EBS,EIP,ELB)显示在Unused Resource页面左侧。
推荐资源列表中选中资源,则在右侧弹出并可查看选中资源的详细页面。
分析报告
按账户,区域,服务组的Unused Resource 图表及资源列表,可以以报告形式进行下载。
详细页面
① 按账户,服务组,区域提供Unused Resource的饼图。
- 预计节省金额
所选资源的预计节省金额。
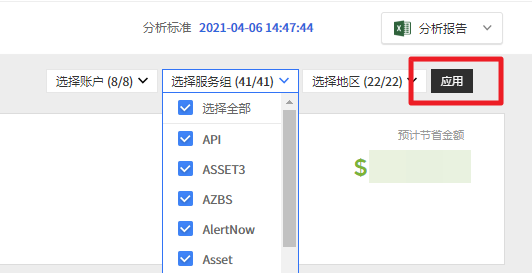
② 通过选择筛选栏的下拉框,用户可以自定义的选择账户,服务组,区域,并查看所选条件下的优化资源。选择后,点击右侧的[应用]按钮,则仅提供所选项的饼图。.
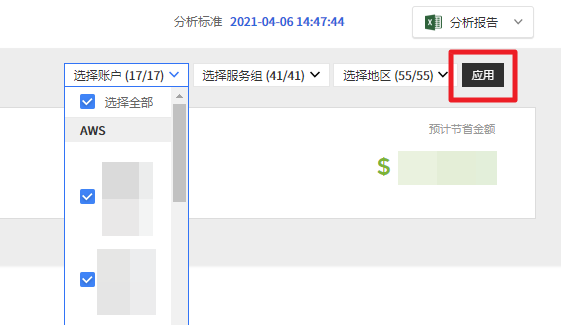
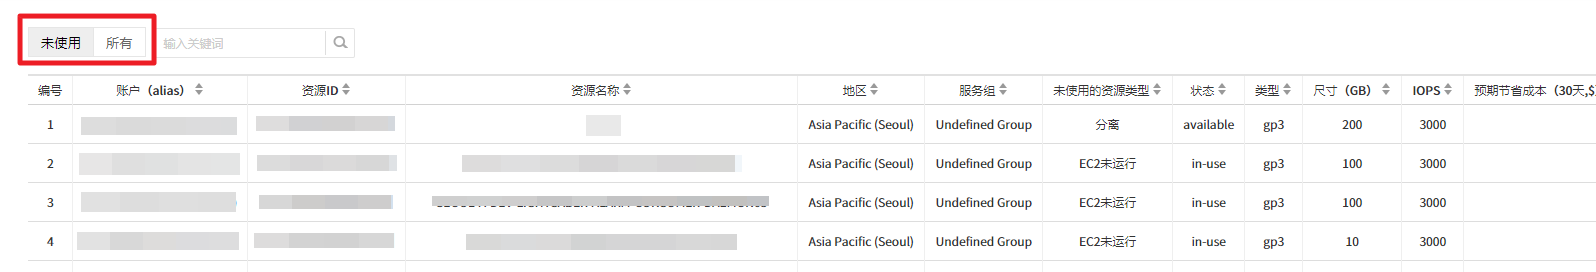
③ 提供推荐为Unused Resource的资源列表和所有资源列表(全部)。
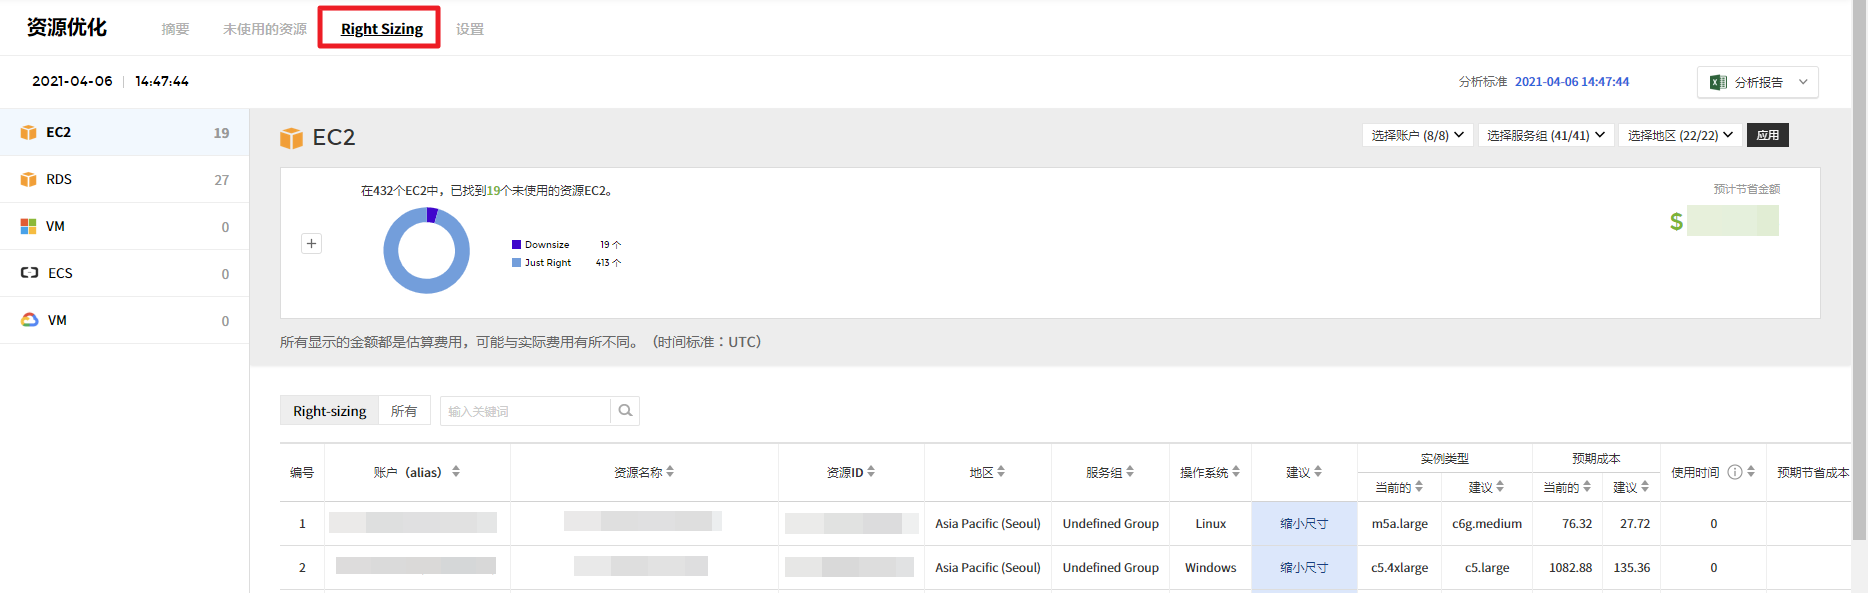
Right Sizing
提供推荐的Right Sizing Resource的详细页面。
推荐资源列表(EC2)显示在Right Sizing页面左侧。
推荐资源列表中选中资源,则在右侧弹出并可查看选中资源的详细页面。
分析报告
按账户,区域,服务组的Right Sizing 资源图表及资源列表,可以以报告形式进行下载。
详细页面
① 按账户,服务组,区域提供Right Sizing资源的饼图。
- 预计节省金额
所选资源的可节省或可增加的预估金额,同时也可以查看增减比率。
② 通过选择筛选栏的下拉框,用户可以自定义的选择账户,服务组,区域,并查看所选条件下的优化资源。选择后,点击右侧的【应用】按钮,则仅提供所选条件的推荐结果。
③ 提供推荐为Right Sizing资源的资源列表(Right Sizing)和所有资源列表(全部)。同时提供资源关系图,点击列表右端的图标便可查看所选资源的关系图。

设置
可以输入,修改和删除资源优化所需的配置信息。
首次访问时将创建基本条件,并且用户可以通过基于创建的基本条件,每天接收有关Unused Resource和Right Sizing的分析建议。
除了默认条件外,用户还可以创建新的条件。创建方法见如下。
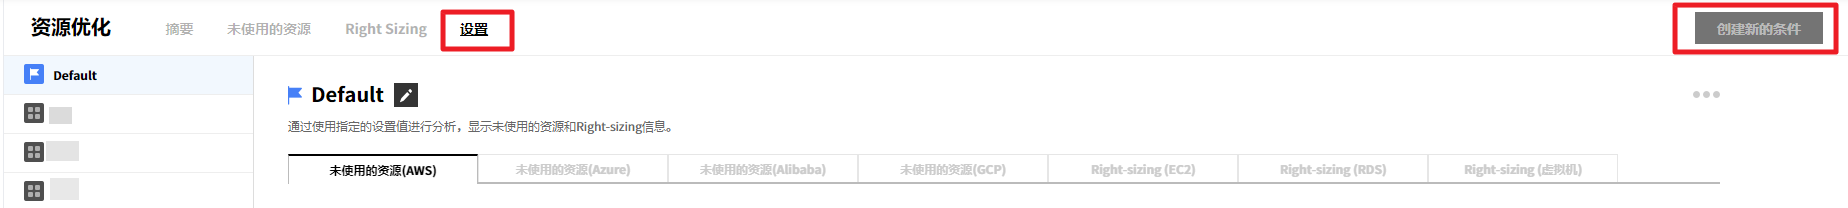
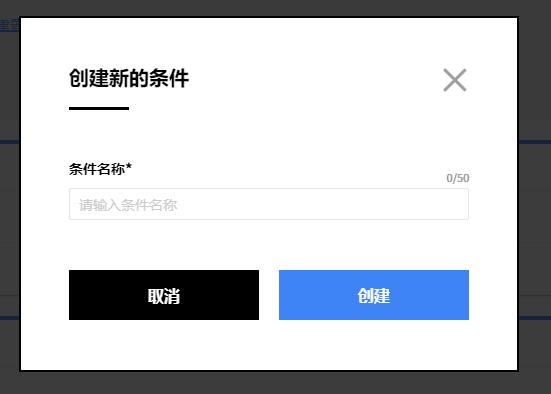
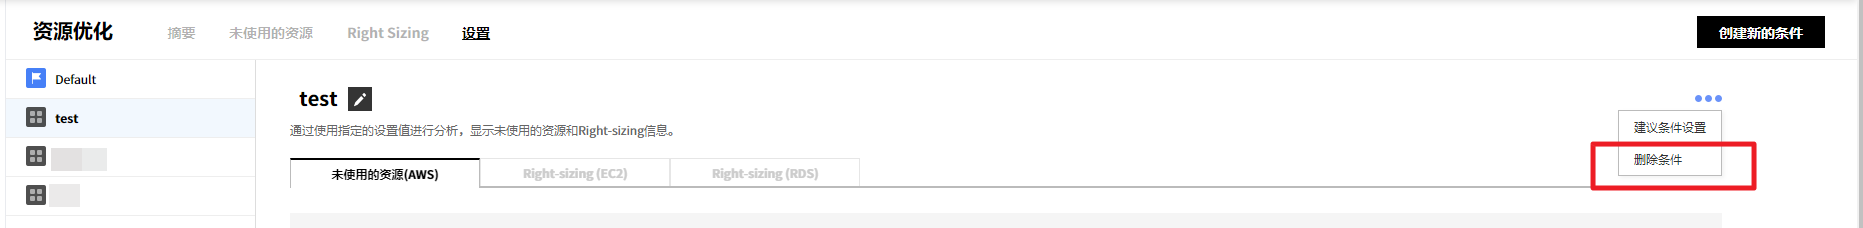
① 点击最右侧的【创建新的条件】。
② 输入条件名称后点击【创建】按钮创建条件。
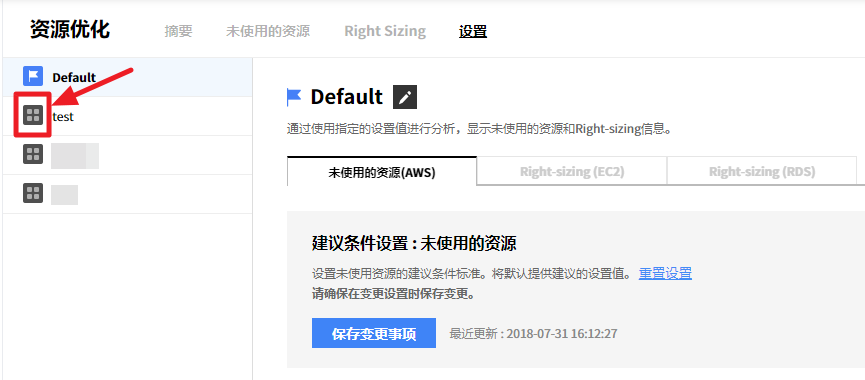
③ 创建的条件将显示在左侧,最多可以创建5个条件。创建5个条件之后,该按钮将会失效。
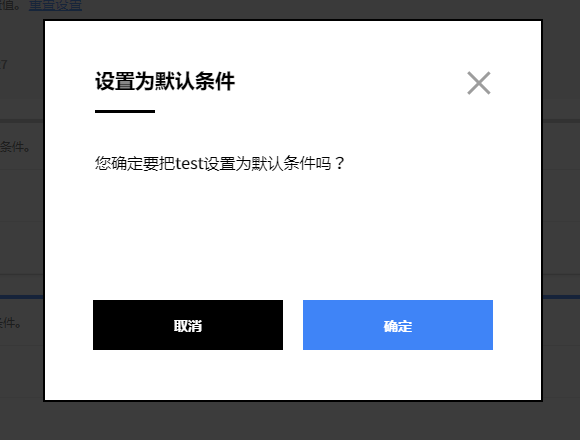
④ 点击条件名称旁边的图标,则可以设置该条件为默认条件。(也可以通过点击右侧的![]() 图标后,选择‘设置为默认条件’进行变更)
图标后,选择‘设置为默认条件’进行变更)
⑤ 点击后将弹出以下窗口,再点击[确定]按钮,则所选条件将会设置成默认条件。
⑥ 点击删除条件按钮,则将会删除已创建的条件。
Unused Resource
通过推荐条件设置来设置Unused Resource分析的条件内容。
按云服务的Unused Resource的推荐条件
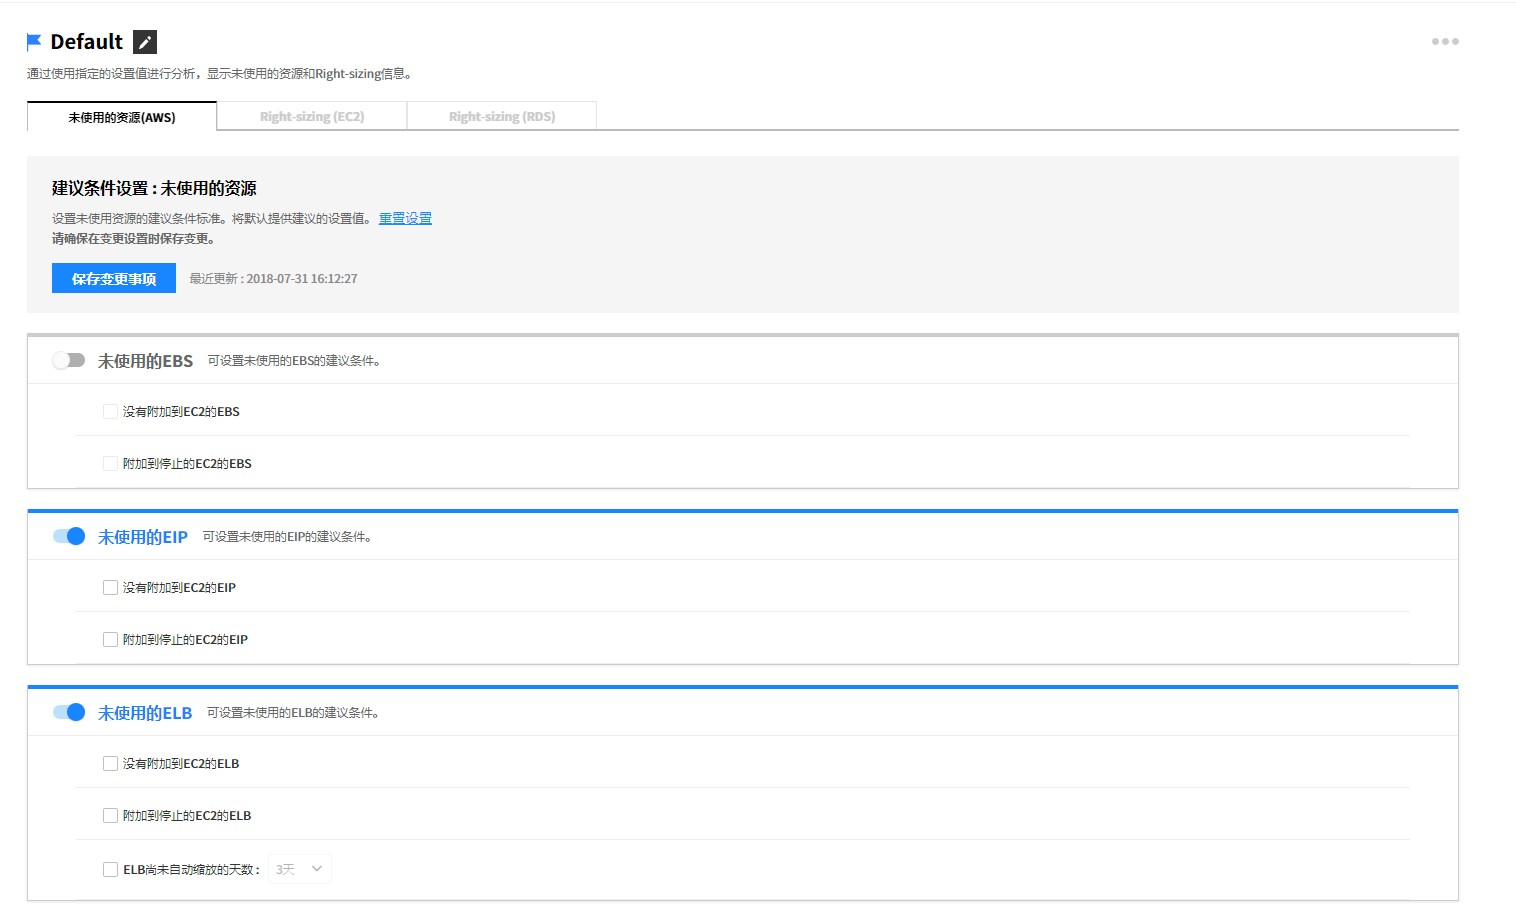
① 滑动该资源的开关来决定是否要推荐。
② 如果开关为蓝色,则将激活各资源推荐的详细项。详细项中的内容,用户可以自定义勾选所需的选项来设置推荐条件。
③ 在AWS选项卡中Unused ELB是还可以设置未调整ELB的周期。(设置期间为1天~30天)
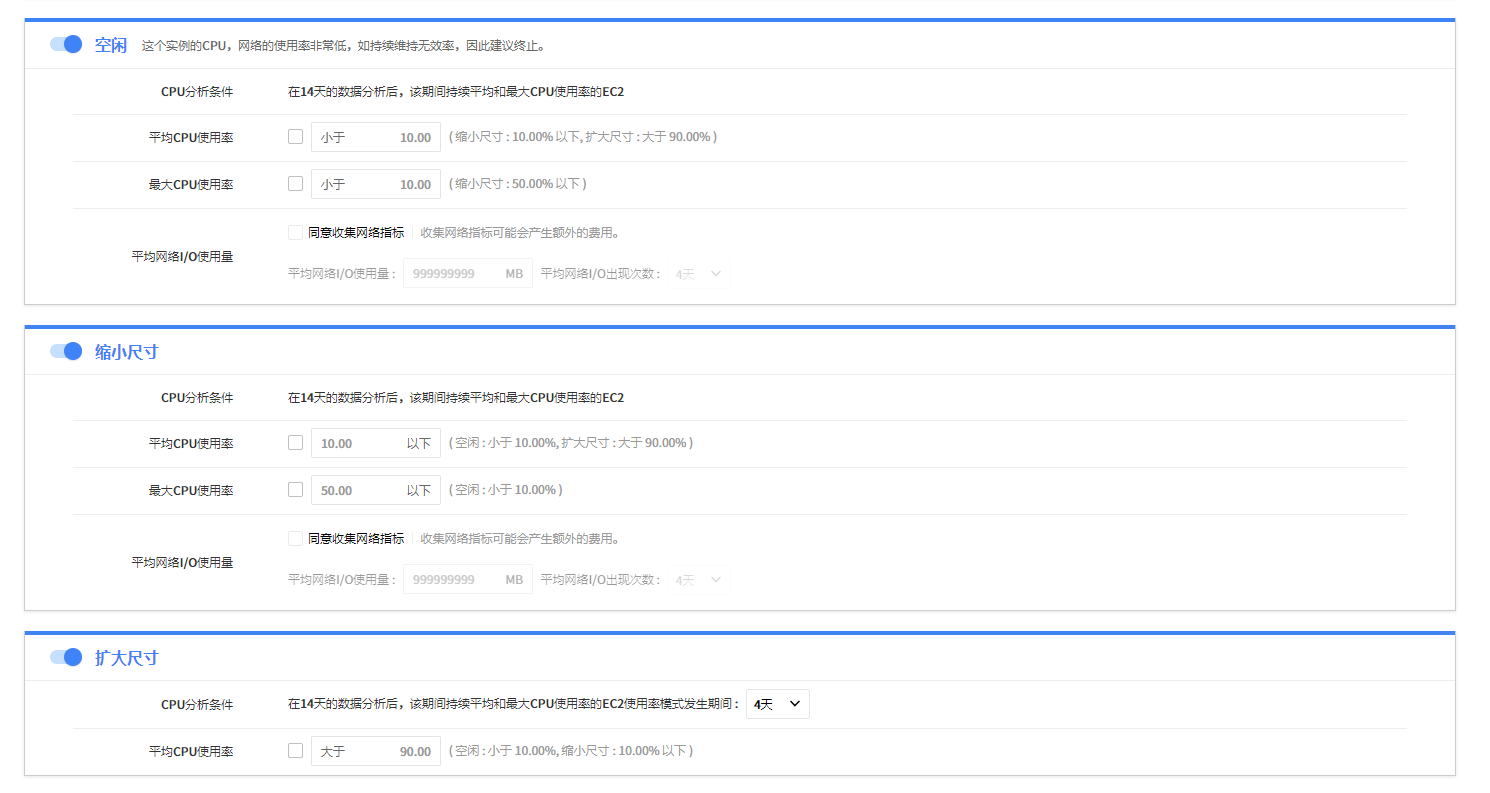
Right Sizing (EC2, RDS, VM)
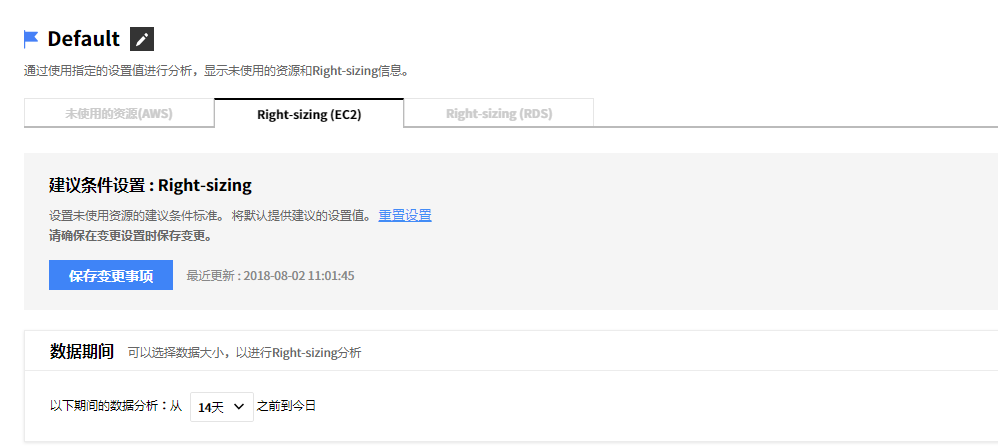
通过推荐条件设置来设置Right Sizing分析的条件内容。
数据期间
选择时间段后,将分析过去该时间段的性能数据,并推荐可优化的资源。
推荐条件设置项
| 项 | 说明 |
|---|---|
| 平均CPU使用率 | 可以通过选中复选框来选择是否设置条件。 |
| 当滑动打开Downsize时,Idle的平均CPU使用率无法高于Downsize的平均CPU使用率。 | |
| 当滑动打开Idle时,Downsize的平均CPU使用率无法低于Idle EC2的平均CPU使用率。 | |
| 当滑动打开Upsize时,Downsize的平均CPU使用率无法高于Upsize的平均CPU使用率。 | |
| 最大CPU使用率 | 可以通过选中复选框来选择是否设置条件。 |
| 当滑动打开Downsize时,Idle的最大CPU使用率无法高于Downsize的最大CPU使用率。 | |
| 当滑动打开Idle时,Downsize的平均CPU使用率无法低于Idle EC2的最大CPU使用率。 | |
| 平均Network I/O 使用量 | 如果选中复选框,则会从Cloudwatch收集网络指标数据。根据收集的数据,数据期间内保持在低于所设置容量(MB)的EC2将包括在Idle EC2,Downsize推荐条件里。 |
内存指标源
为了更准确的进行Right Sizing分析,需要在每个EC2上安装脚本并收集内存指标。
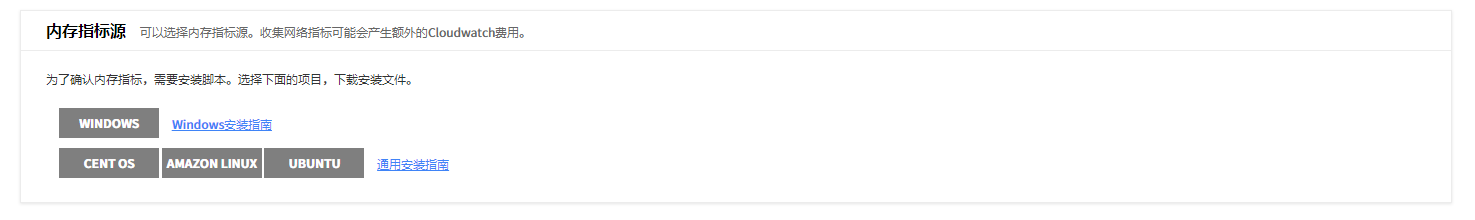
通过点击Windows / CentOS / Amazon Linux / Ubuntu 按钮,下载相应的安装脚本。
设置完成后,点击页面顶部的【保存变更】按钮以完成Right Sizing资源推荐条件的设置。
报告
提供多样的报告模板,用户可以下载Excel或PDF格式的报告。还可以配置用户所需的项目来创建自定义报告。
资产管理 > 报告
自定义报告
该功能可以根据用户的需要将资产管理中提供的数据设置为不同形态的报告。
报告列表中提供两种类型的报告。
- 模板报告:是显示基本形式的报告类型,提供组合用户常用项的报告形式。可以在模板报告的基础上创建新形式的报告,但无法更改数据。
- 自定义报告:是用户可以自行设置所需数据的报告类型,最多可以创建50个。
页面构成
自定义报告页面构成如下所示。
- 报告类型:根据用户的需要,可以选择类型来制作,根据报告类型的不同,数据查询条件也不同。
- 使用量:显示所选云服务的各个资源数,并显示当天存在的资源总数(无论当前是否存在)。
① 实例状态:以当天最后更新的资源采集为准,按实例状态计算资源数量
- Terminated:计算当天终止的所有资源数量(终止后未在AWS中显示,无法确认实例状态时也按照当天终止计算)
- 使用量菜单的当前页面中显示的“Terminated”资源数量只计算了查询时实例状态为Terminated的资源数量。
② 数量标准
| EC2 | 实例数量 |
| DynamoDB | 表格数量 |
| S3 | 存储桶数量 |
| Auto Scaling Instance | Auto Scaling组的EC2数量 |
| CloutFront | 分配数量 |
| EBS | 卷数量 |
| EIP | IP地址数量 |
| ElasticCache | 集群数量 |
| Elasticsearch Service | 域数量 |
| ELB | 负载均衡器数量(包含Application, Network, Classic Load Balancer) |
| Lambda | 函数数量 |
| RDS | 数据库实例数量 |
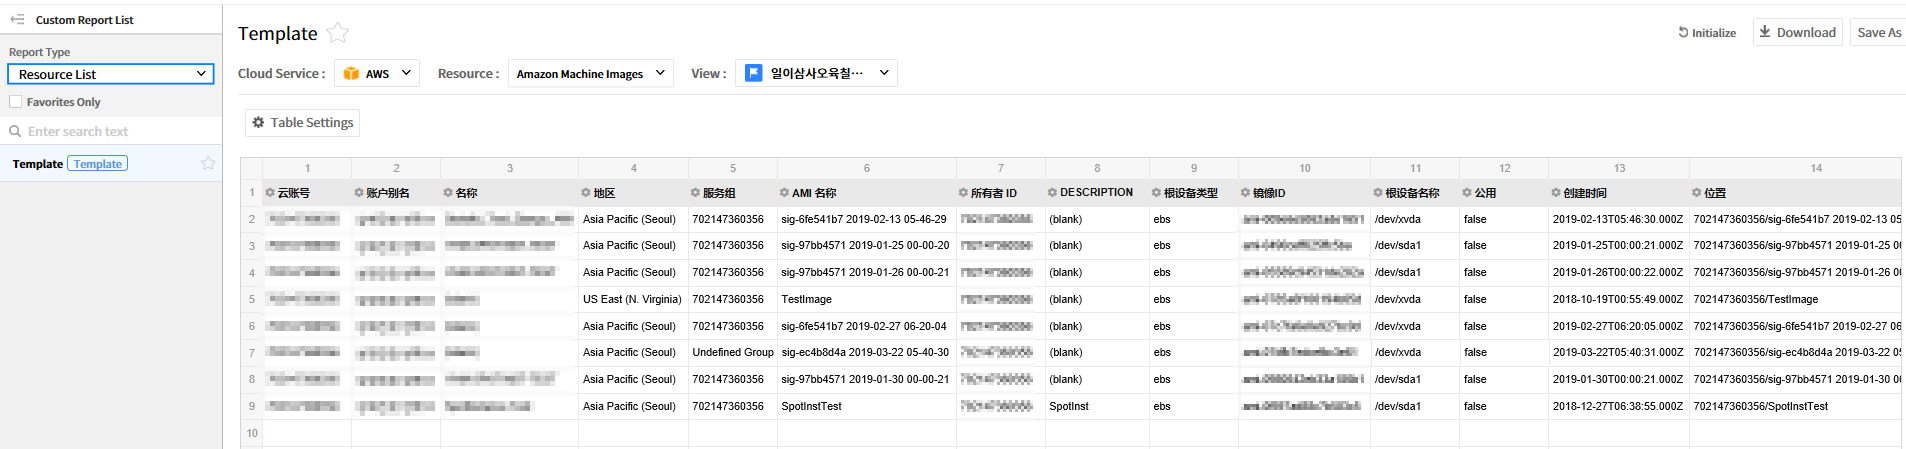
- 资源列表:显示 资产管理> Usage 菜单的当前查看数据,并可以确认当前正在使用的资源列表。
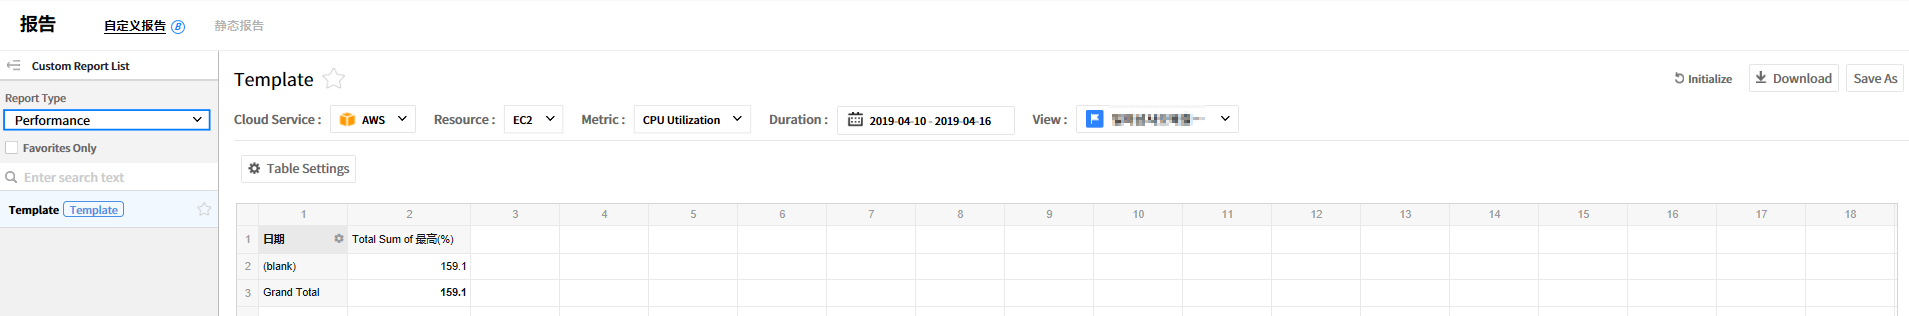
- 性能:显示 资产管理>性能 菜单中的数据,并可以确认各个资源的性能信息。
- 只查看收藏夹:选中该复选框,则只显示在收藏夹内的报告。
- 期间:可以设置您要在报告中显示的数据的期间范围。(可以选择的单位有:过去7天,14天,1个月,3个月,6个月,1年)
选择自定义期间,则会在日历中显示,您可以指定所需的期间。 - 初始化:用户设置的所有部分都将初始化。
- 下载:您的自定义报告可以下载为Excel文件格式。
- 另存为:可以更改自定义报告的名称。
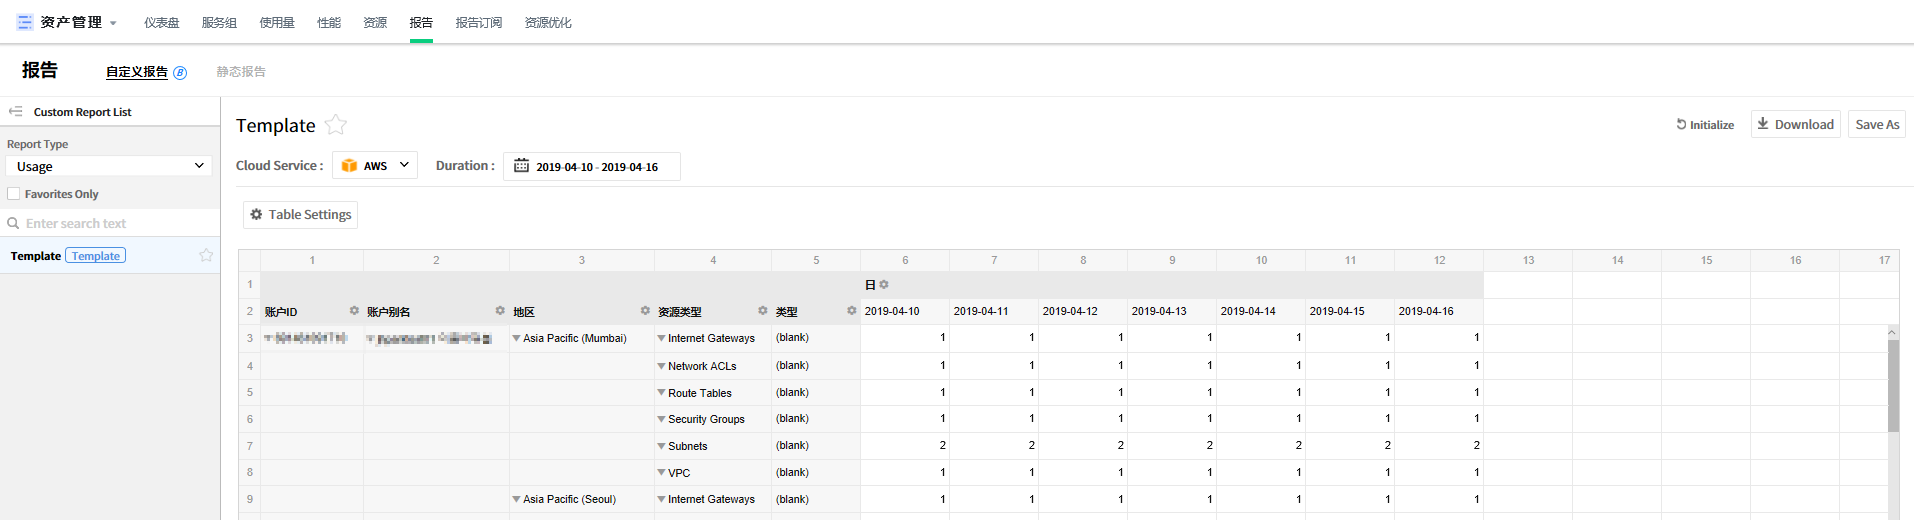
创建自定义报告
点击【创建新的报告】按钮。
![]()
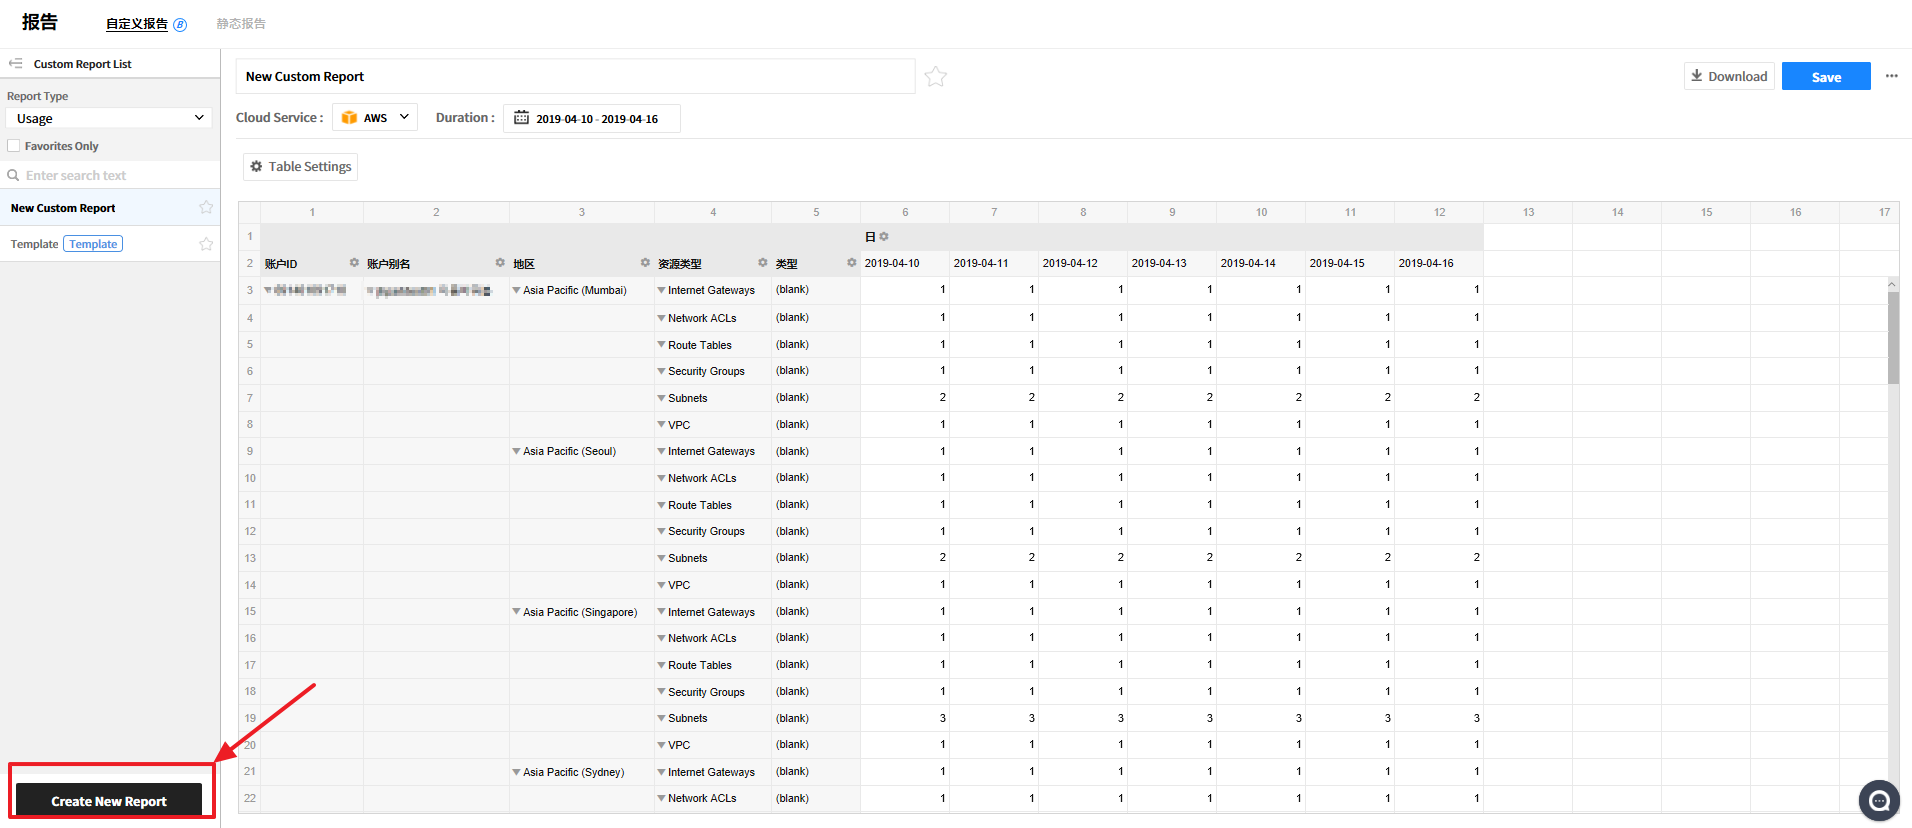
显示一个名为New Custom Report的报告。如果出现如下所示没有数据的信息,可能是由于设置的查询期间较短,所以请延长查询期间。
![]()
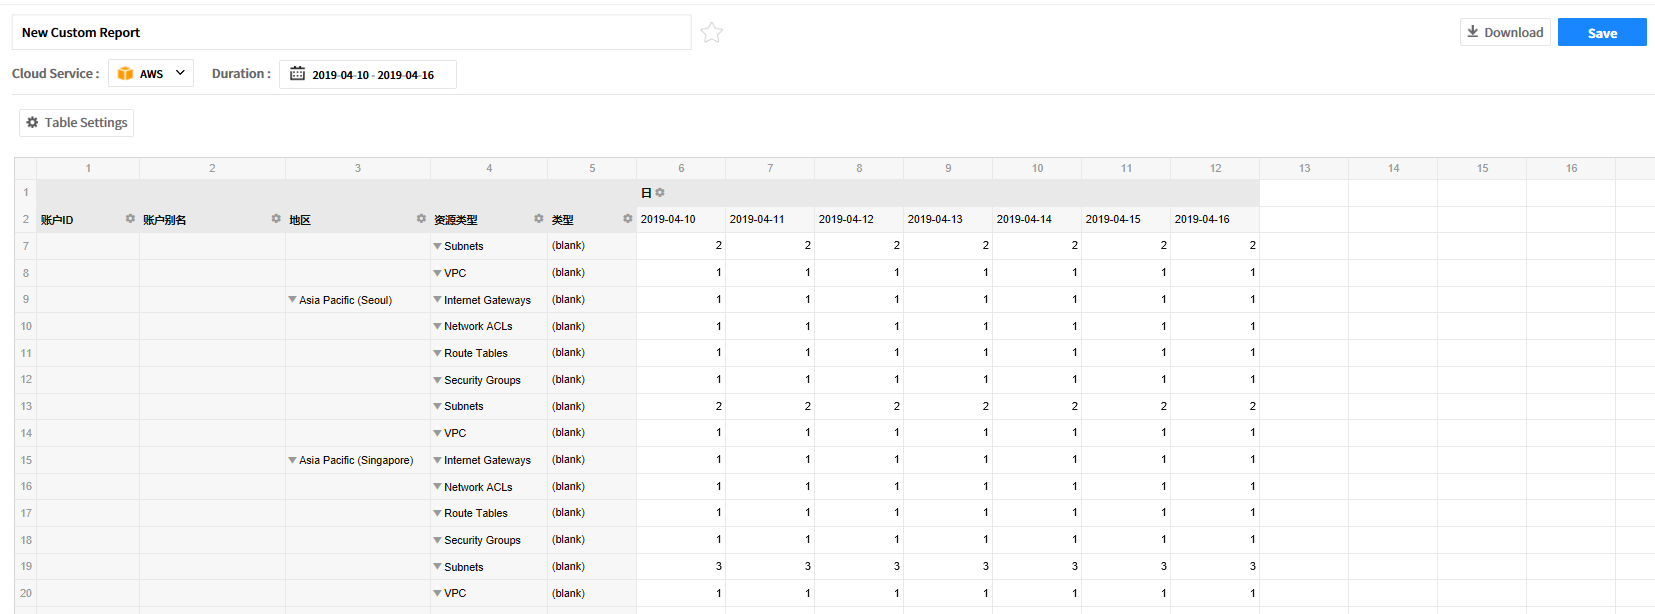
创建的自定义报告表格如下所示。选择要显示的数据条件。
![]()
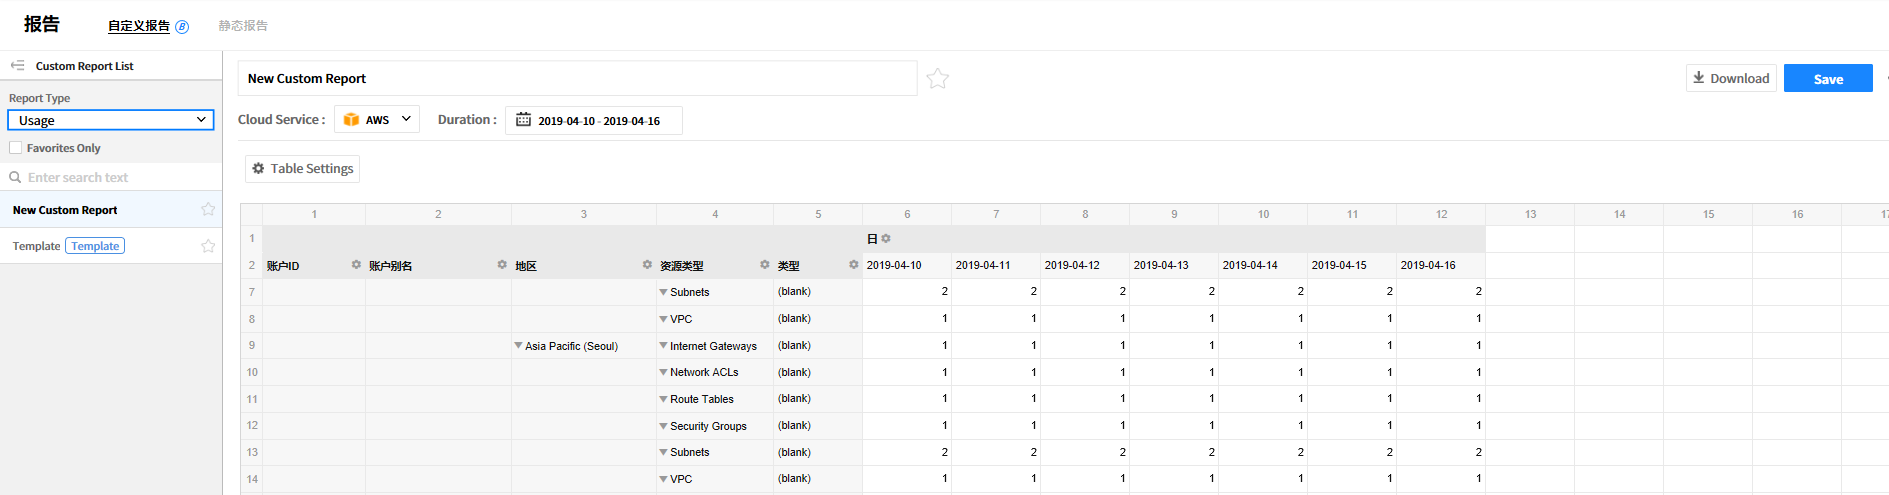
点击【表格设置】按钮来更改要在表格上显示的项。
![]()
若被选择的报告类型是Usage或Performance时,将显示如下图所示的表格设置弹出窗口。 弹出窗口左侧将显示字段目录。 把要显示的字段拖放到报表过滤器,行,列,值上,然后点击[应用]按钮,将其应用到设置的表格中。
![]()
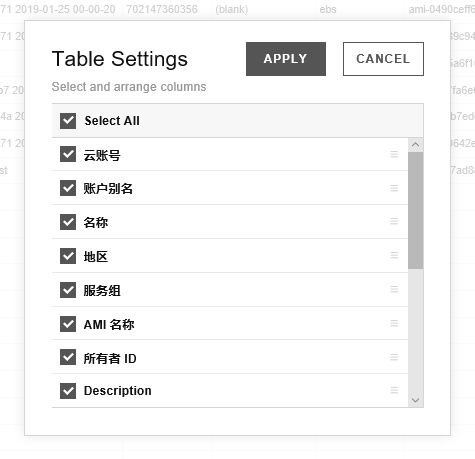
将报告类型选择为Resource List后,点击[表格设置]按钮,会出现可以选择条件的弹出窗口。设置完毕后,点击 [保存]按钮。
![]()
随着报告类型(Resource List, Usage, Performance)的不同,可以设置的数据条件将改变。 关于是否可以设置,请参考下面的表格。


| 数据条件 | 资源列表 | Usage | 性能 |
|---|---|---|---|
| 云服务 | 可以变更 | 不可变更 | 不可变更 |
| 资源 | 不可变更 | 无 | 不可变更 |
| 指标 | 无 | 无 |
不可变更 |
| 期间 | 无 | 可以变更 |
可以变更 |
| View | 可以变更 | 无 | 可以变更 |
※点击【创建新的报告】按钮创建报告,在没有保存的情况下添加其它报告的话,就会出现如下所示的是否保存变更的弹窗。

修改自定义报告
用户可以修改创建的报告的名称、数据条件、要在表格中显示的字段项、字段值,且根据报告类型不同修改的项也不同。名称可以在名称字段中直接修改或点击【另存为】按钮,然后在弹窗中修改。
修改与创建阶段一样,在完成修改事项后点击【保存】按钮。
- Usage
- 资源列表
- 性能
※对于数据条件中的云服务相关条件(云服务,指标,资源),只能在初始登录报告时设置,创建后只能修改期间和View。
删除自定义报告
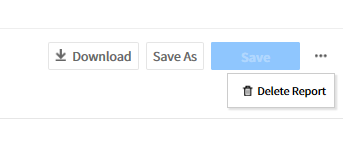
点击创建的报告页面右上角的【删除报告】按钮。
![]()
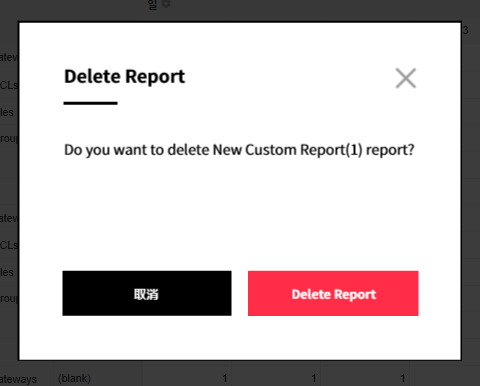
点击【删除】按钮后,则会在页面中出现名为已删除的弹出窗口,并已删除该报告。
![]()
默认报告
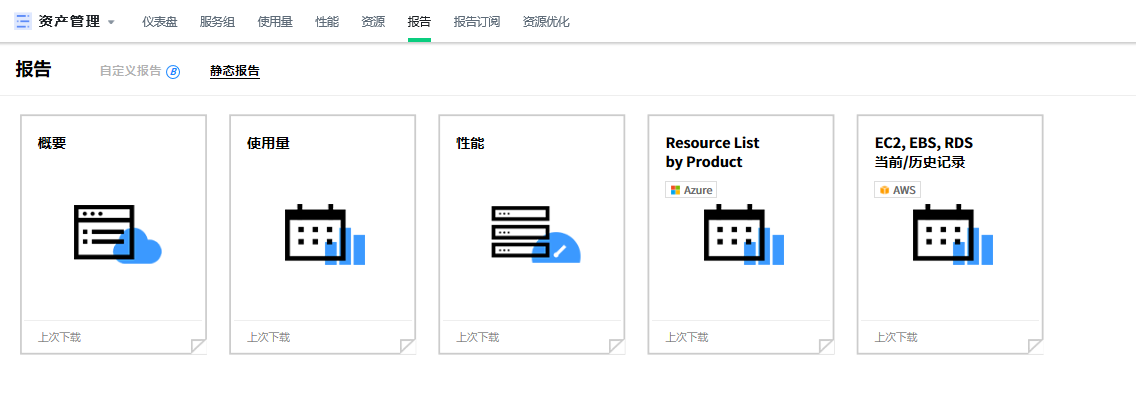
默认报告提供5种报告模板。
- 概要:可以确认账户信息及/各地区资源数量。
- 使用量:可以确认账户/各地区资源列表和状态。
- 性能:可以确认所选期间的各资源性能信息。
- 各产品资源列表:可以按Azure产品确认当前正在使用的资源列表。
- 查看EC2,EBS,RDS当前/历史:可以在AWS产品中确认EC2,EBS,RDS的当前和历史。
点击每个模板时,右侧将显示相应的报告模板设置,设置项由3个选项卡组成。
报告信息
可以下载当前时间的报告,性能可以设置期间。
选择文件格式(Excel,PDF)后点击【下载】按钮下载报告。
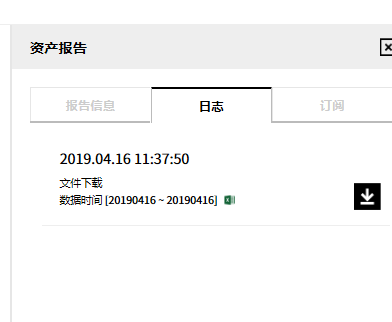
LOG
显示下载报告模板的历史记录,可以通过点击图标再次下载报告。
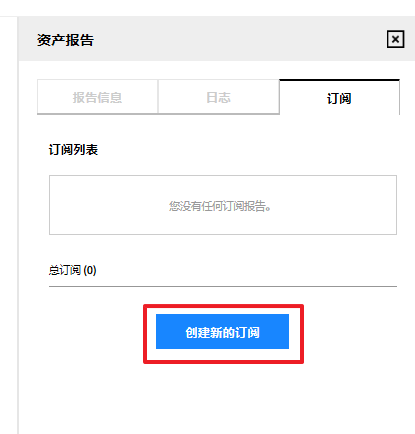
订阅
用户可以使用在服务中登录的电子邮箱订阅报告。可以选择每日,每周和每月为周期,也可以指定报告订阅的时间。
报告订阅列表包含用户自己设置的订阅、用户有订阅设置权限被指定为订阅人的订阅。可以创建,删除或修改自己设置的订阅,但授权用户指定的订阅仅可查看。
创建新的订阅:
在订阅选项卡上,点击【创建新的订阅】按钮。
![]()
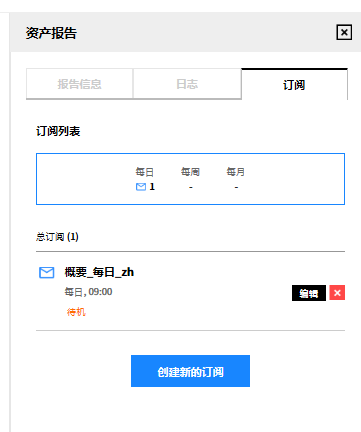
在创建页面输入项目并点击【保存】按钮。对于订阅名称,默认情况下会显示由报告模板名称、周期、语言等组成的名称。
![]()
创建的订阅显示如下所示。
![]()

修改创建的订阅:
在创建的订阅页面上点击【编辑】按钮。
![]()
应用修改后,点击【保存】按钮。
![]()

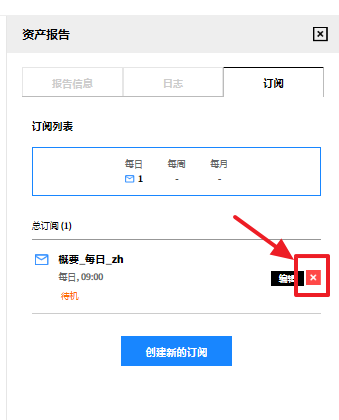
删除创建的订阅:
在创建的订阅页面上,点击【删除】图标。
![]()
点击删除订阅弹出窗口中的【删除】按钮以删除订阅。
![]()

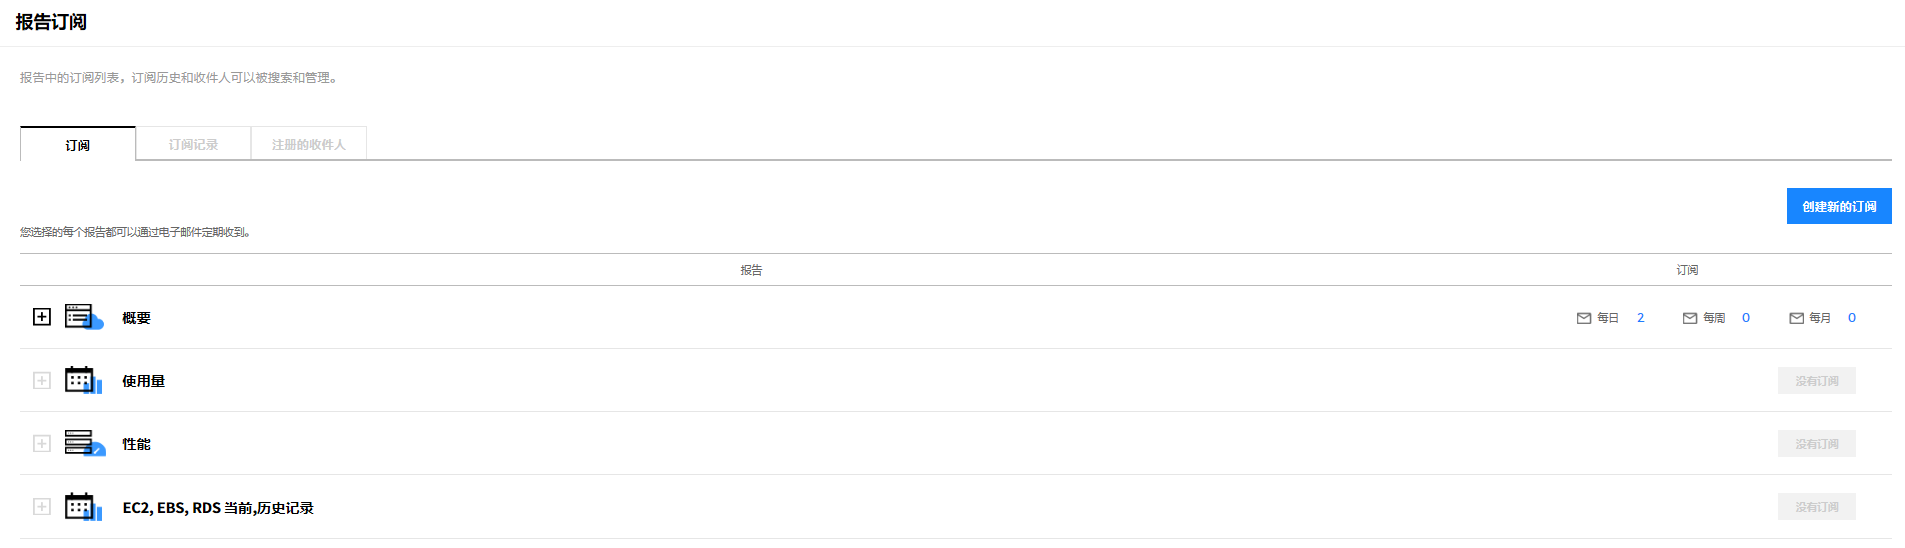
报告订阅
报告订阅提供向有权修改相应菜单的用户自动发送订阅邮件的功能。用户可以创建、修改和删除订阅、查看每个订阅的发送历史记录、再次下载已发送的报告。还可以通过创建、删除外部电子邮件或所需的电子邮件来管理收件人,在创建/修改订阅时可以指定收件人。
资产管理 > 报告订阅
订阅目录
资产管理 > 报告订阅 > 订阅
可以按报告类型(概要,使用量,性能,EC2,EBS,RDS当前/历史记录)创建订阅,定期接收订阅电子邮件,以及修改和删除创建的订阅。
创建订阅
使用以下步骤创建订阅。
在订阅列表页面上,点击【创建新的订阅】按钮。
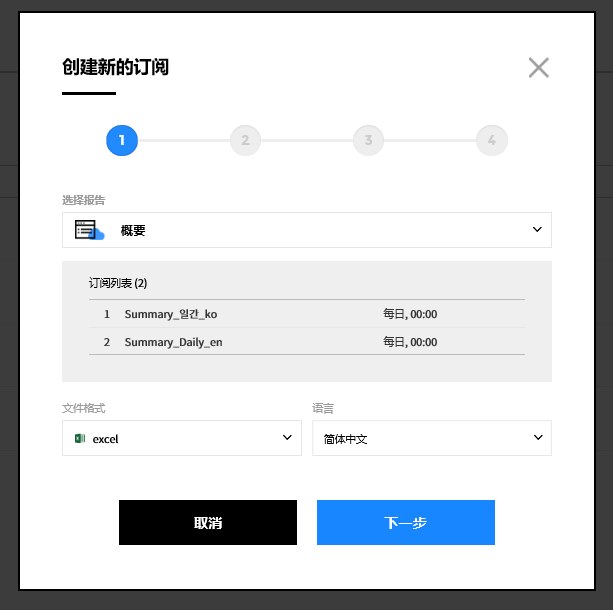
步骤1:选择报告
选择要订阅的报告类型、文件类型和语言,然后点击【下一步】按钮。![]()
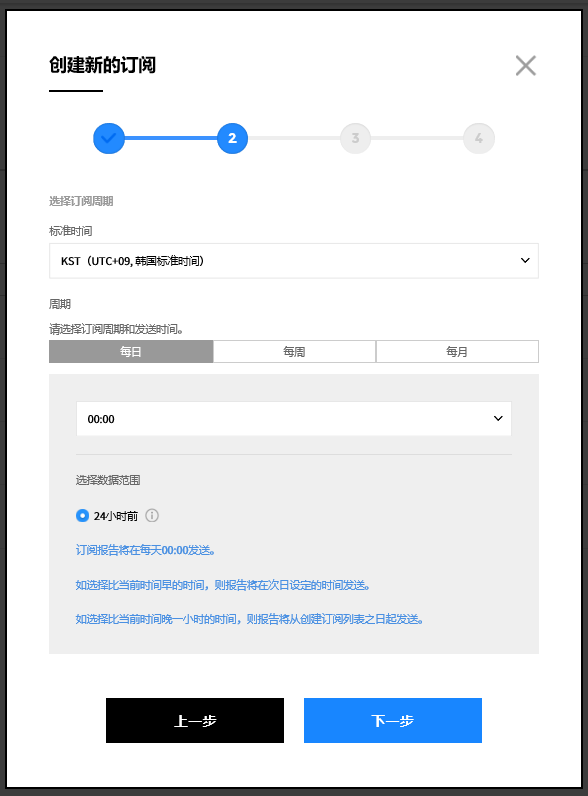
步骤2:选择订阅周期
选择时区后,选择您所需的订阅周期。(可以以每天,每周,每月为单位设置)
每天:选择发送订阅的时间。
每周:选择发送订阅的星期和时间。
每月:选择发送订阅的日期和时间。指定为31号时,如当月没有31号则将在该月的最后一天发送。
完成设置并点击【下一步】按钮。![]()
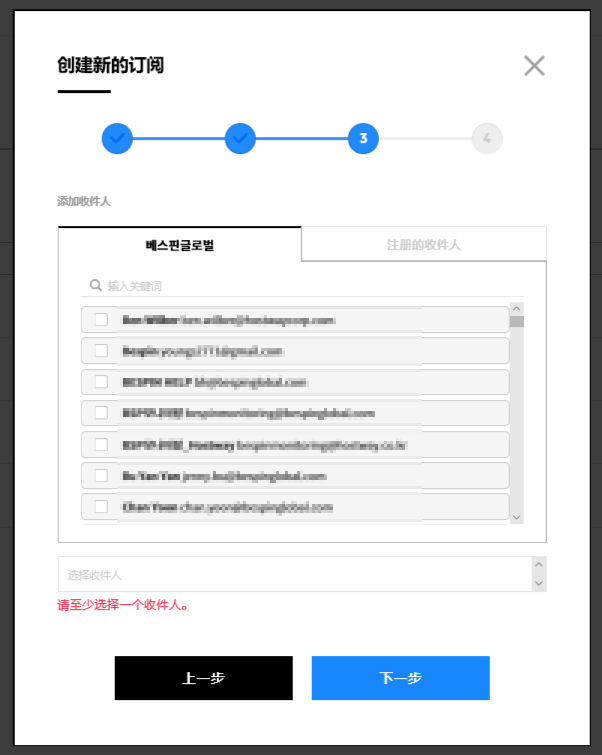
步骤3:添加收件人
最多可以指定10个收件人。收件人分为属于服务门户授权的公司的用户列表和用户自己的登录的注册收件人列表。
选择收件人,然后点击【下一步】按钮。
![]()
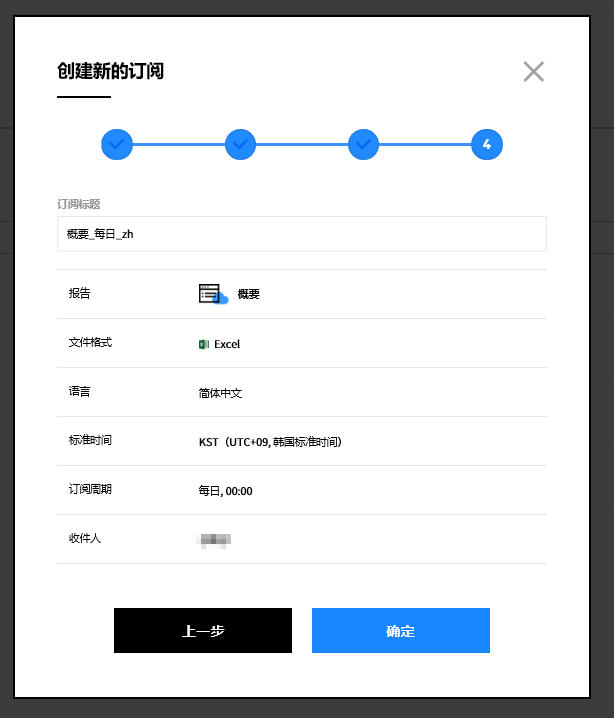
步骤4:设置订阅名称及检查
默认设置名称以“报告类型_周期_语言”为格式,可以修改。确认步骤1~3中设置的信息后,点击【确定】按钮创建订阅。![]()
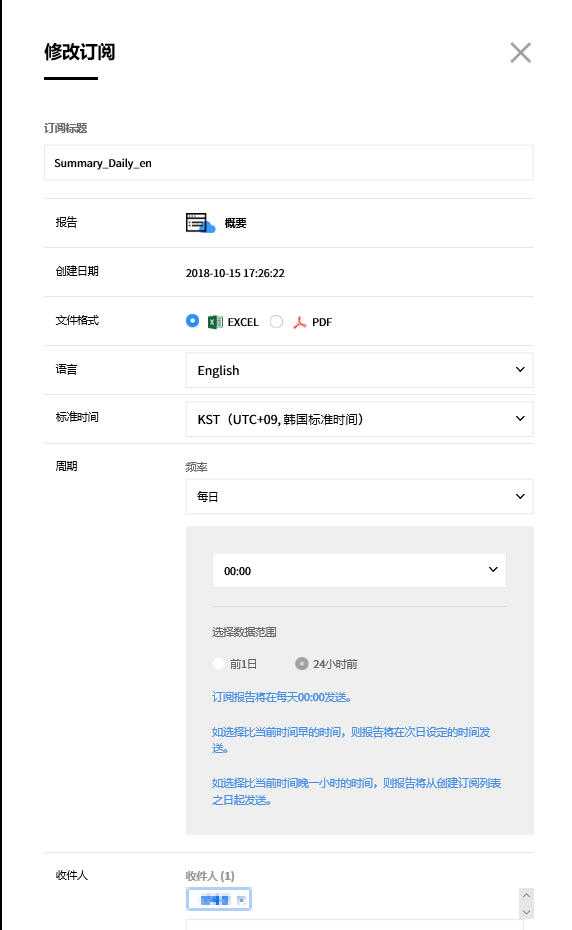
修改订阅
在创建的订阅列表中点击 修改 图标。
![]()
显示之前设置的订阅信息,选择、修改要编辑的订阅,应用后点击【修改】按钮。
![]()
删除订阅
在创建的订阅目录中点击 修改 图标。
![]()
点击【删除】按钮删除订阅。如果有该订阅以前发送的历史记录,则可以在订阅记录选项卡上查看已删除的历史记录。
![]()

订阅记录
资产管理 > 报告订阅 > 订阅记录
可以确认设置订阅后发送的记录详情,可以下载最近发送的文件。
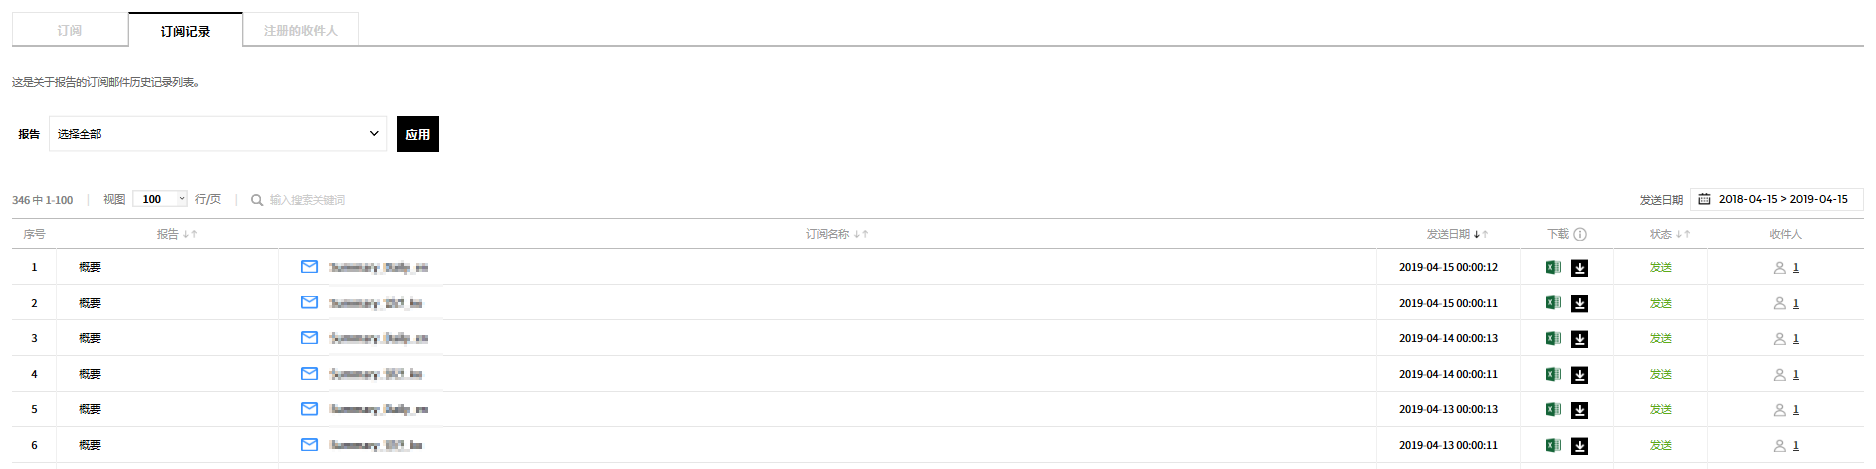
- 报告:显示创建订阅时选择的报告类型。
- 订阅名称:显示默认名称或用户设置的订阅名称。
- 发送日期:显示发送订阅的日期和时间。
- 下载:可以通过点击下载图标下载最近一个月发送的文件。如果文件发送失败或文件超过一个月,则下载按钮显示为灰色且无法下载。
- 发送状态:显示订阅邮件的发送状态。(等待/发送完成/发送失败)
- 接收:显示此订阅的收件人数。可以在点击时查看收件人列表。.
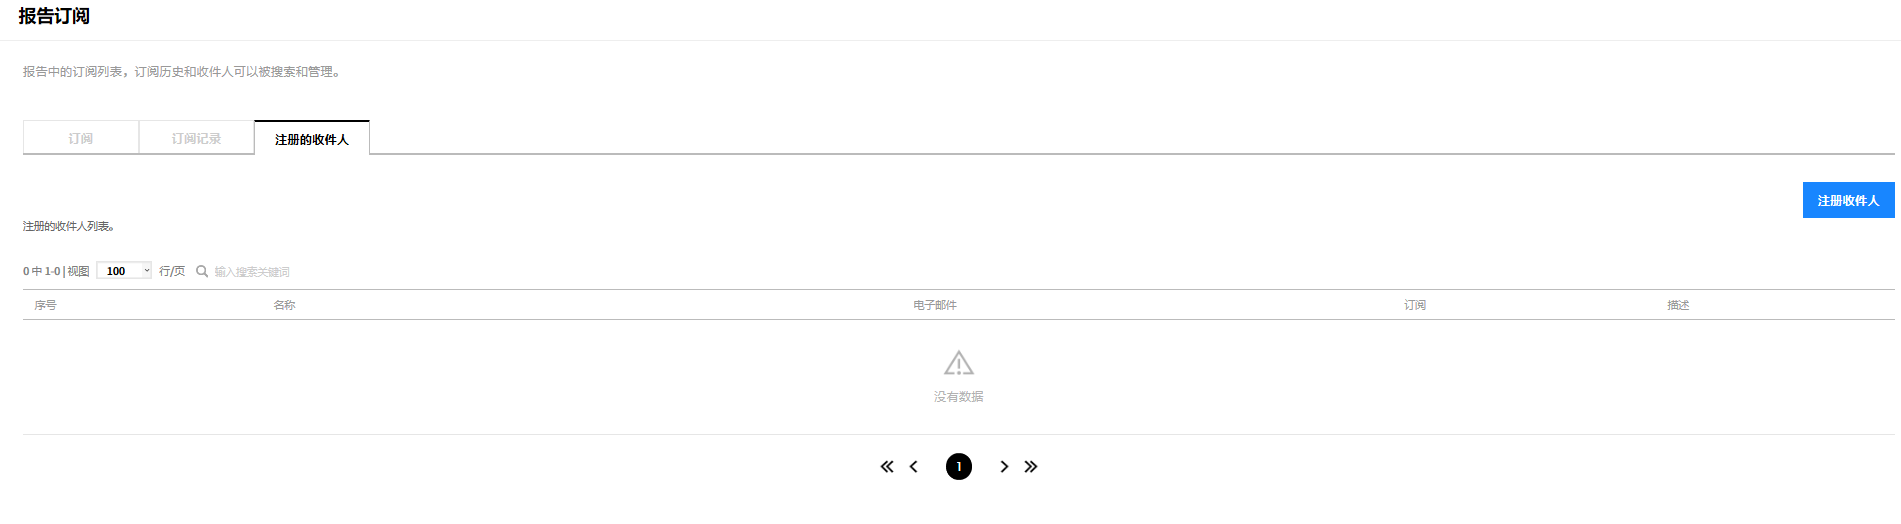
注册的收件人
资产管理 > 报告订阅 > 注册的收件人
注册的收件人中,可以注册电子邮件手动添加收件人以订阅报告,还可以修改及删除已注册的收件人。
- 名称:显示收件人名称。
- 电子邮件:显示收件人的电子邮件地址。
- 订阅:显示用户订阅的报告数量,点击时可以查看订阅的报告列表。
- 描述:显示相应订阅的描述。
添加收件人
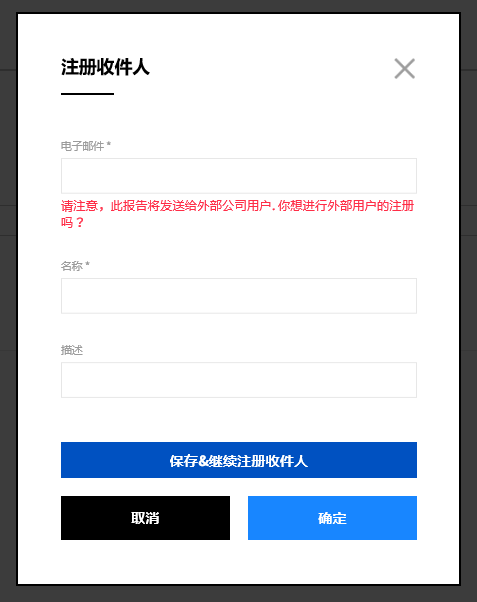
在已注册的收件人页面上,点击【注册收件人】按钮。
![]()
在注册收件人弹出窗口中输入信息后,点击【确定】按钮。要注册多个收件人时请在输入后点击【保存&继续注册收件人】按钮。窗口将不弹出且可继续注册收件人。
![]()

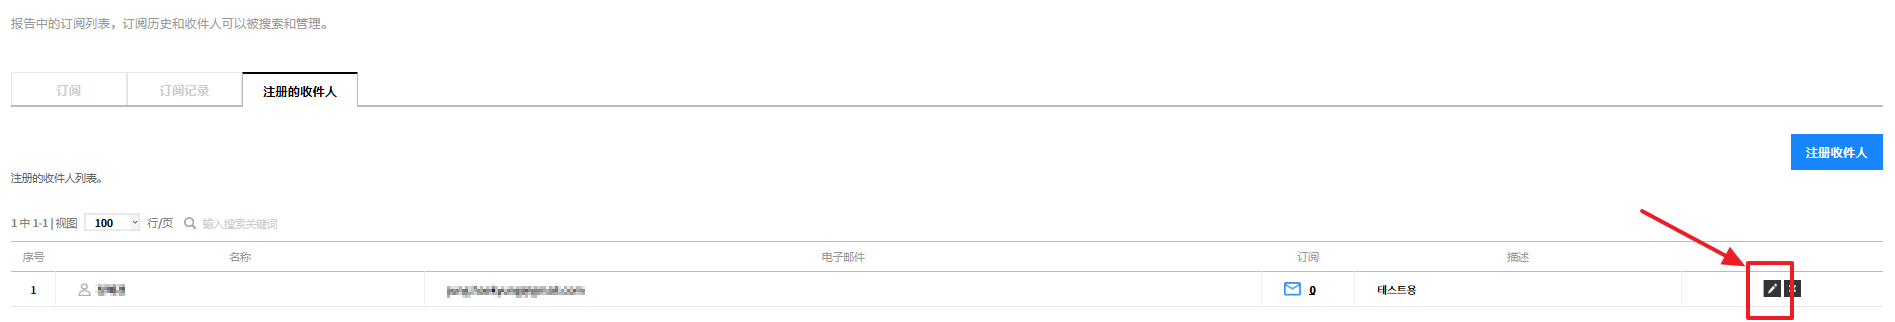
修改收件人
在注册的收件人页面中,点击编辑图标。
![]()
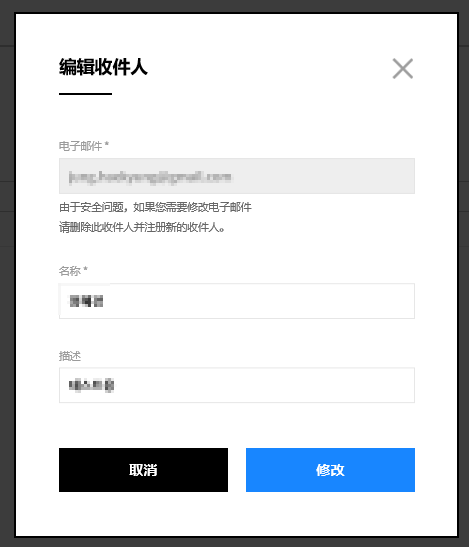
在编辑收件人弹出窗口中应用修改后,点击【修改】按钮。无法在弹出窗口中修改电子邮件,如要修改,则需要删除后重新注册收件人。
![]()
删除收件人
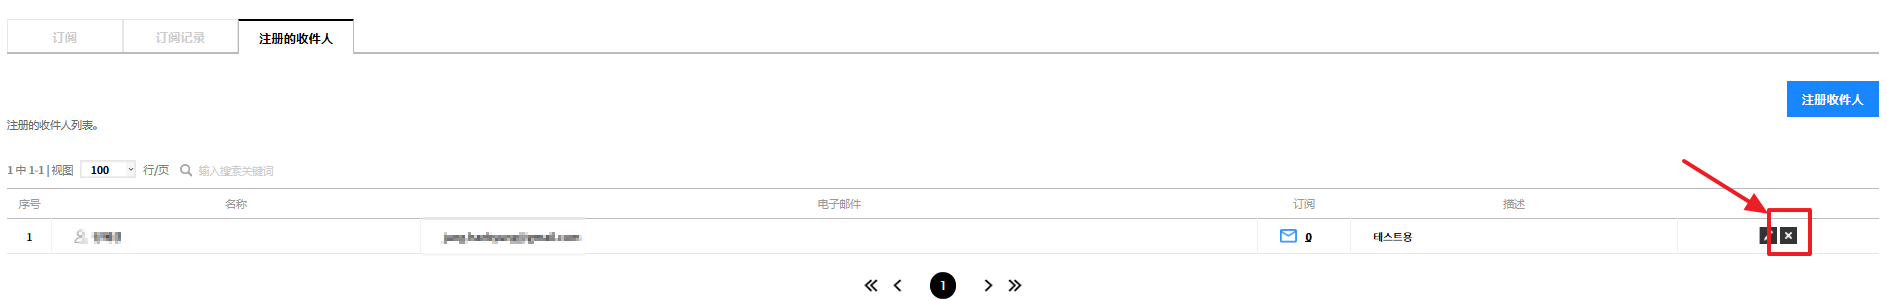
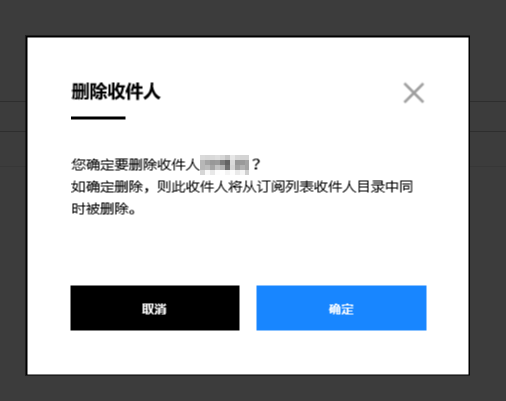
在注册的收件人页面上,点击删除图标。
![]()
点击【确定】按钮删除收件人。删除时,将从订阅列表选项卡上的收件人列表中删除。
![]()
资源告警
Asset > Resource Alert
Resource Alert detects resource anomalies based on the specific rules set in advance and sends alerts immediately. Resource anomalies are directly related to the resource cost and therefore it is important to monitor the resources more closely and not miss the anomaly event. In the Resource Alert menu, you can set specific alerts by cloud service, resource, account, and region, and individual alerts are triggered depending on the data collection cycle. Manage alert settings and view alert history in one place.
Alert Settings
Adding Alerts
Asset > Resource Alert > Alert Settings Tab
Create or add a new alert setting to receive alerts when a resource anomaly event occurs.
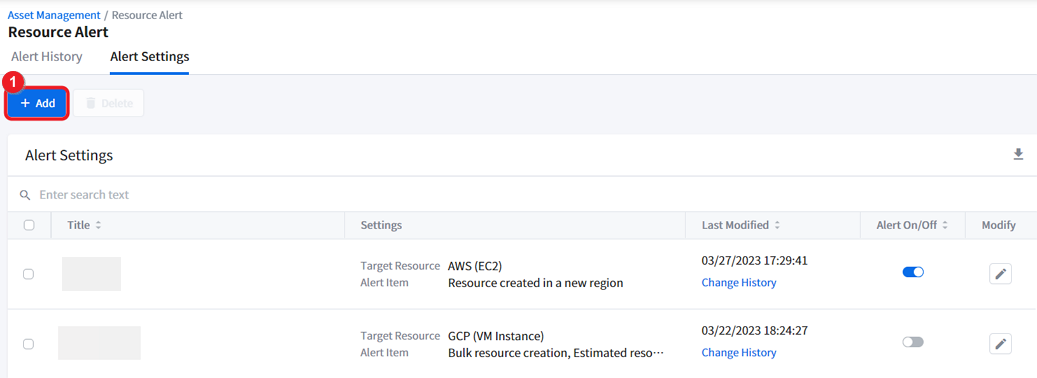
① Click [+ Add] in the Alert Settings tab menu.
② When the [Add Alert] window appears from your right side, enter the Alert Title of your new alert setting and select Alert Channel to receive the alert. For example, if you select Email, you will receive a alert by email in the event of an resource anomaly, and the alert title you entered will be shown in the title of the alert email.
③ Search and add the alert recipients who will receive the alert. You can only add up to 50 recipients.
📜 Note: You can unsubscribe by clicking the [Unsubscribe] button at the bottom of the email.
④ Select a language of your alert. Currently, Korean and English are supported.
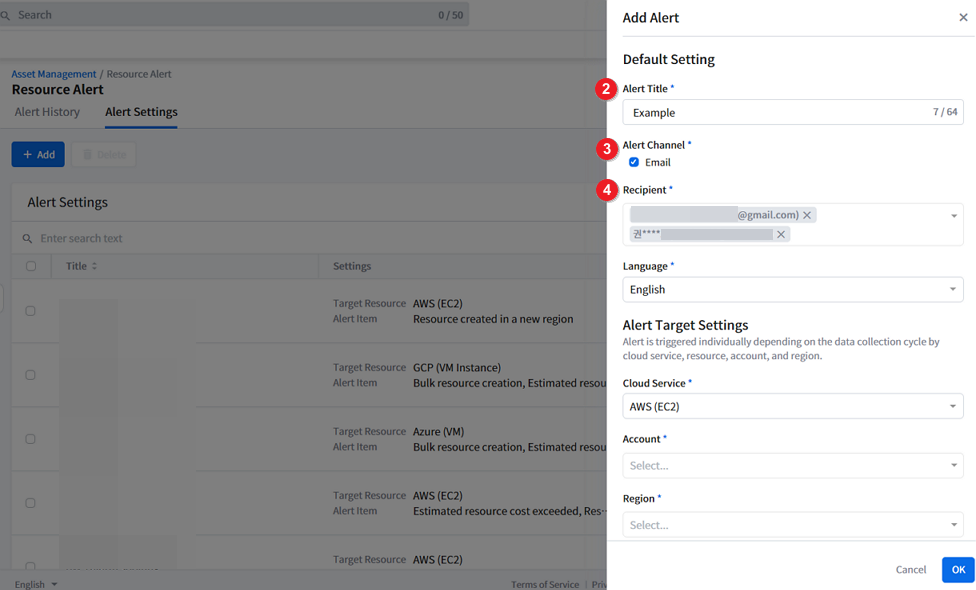
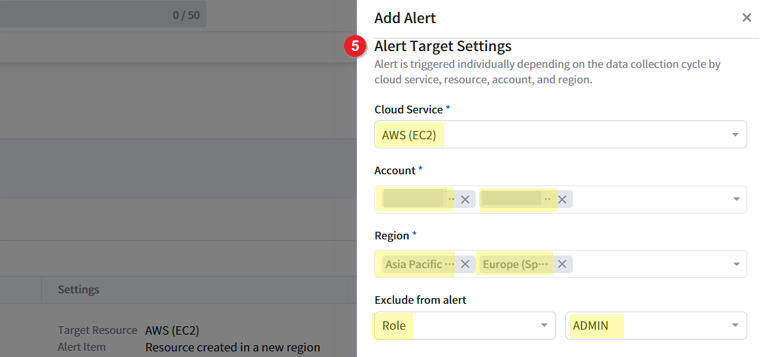
⑤ Now, let’s set the specific resource alert targets. Select the Cloud Service, Account, Region, and Tags to exclude from the alert.
🔎 Supported Cloud Services and Resource Types:
- AWS EC2
- Azure VM
- GCP VM Instance
📜 Note: Alert is triggered and sent individually depending on the data collection cycle by cloud service, resource, account, and region.
Therefore, if you have selected 2 or more accounts or regions and if the resource anomaly event is triggered in the relevant account or region, you would receive individual alerts accordingly.
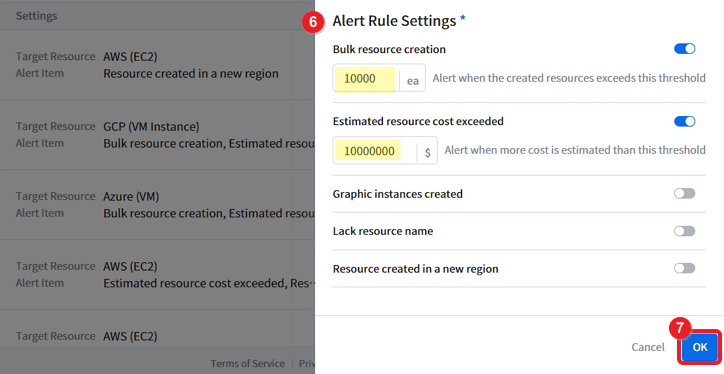
⑥ Select and turn on the toggle switch of the Alert Rule that you want to set and enter the threshold value. Supported rules by cloud service are listed below. Please note that you can only set the alert rule for a maximum of USD 100,000,000 and 10,000 resources.
| Rules | Description | Cloud Services |
|---|---|---|
| Bulk resource creation | Alert is triggered when the created resources exceed the threshold. | AWS, Azure, GCP |
| Estimated resource cost exceeded | Alert is triggered when more cost is estimated than the threshold | AWS, Azure, GCP |
| Graphic instances created | Alert is triggered when the created graphic resources exceed the threshold | AWS, Azure, GCP |
| Lack resource name | Alert is triggered when resources more than the threshold lack resource name | AWS, Azure |
| Resource created in a new region | Alert is triggered when a resource is created in a new region | AWS, GCP |
| New resource group created | Alert is triggered when a new resource group is created | Azure |
⑦ Click [OK] to save the alert setting.
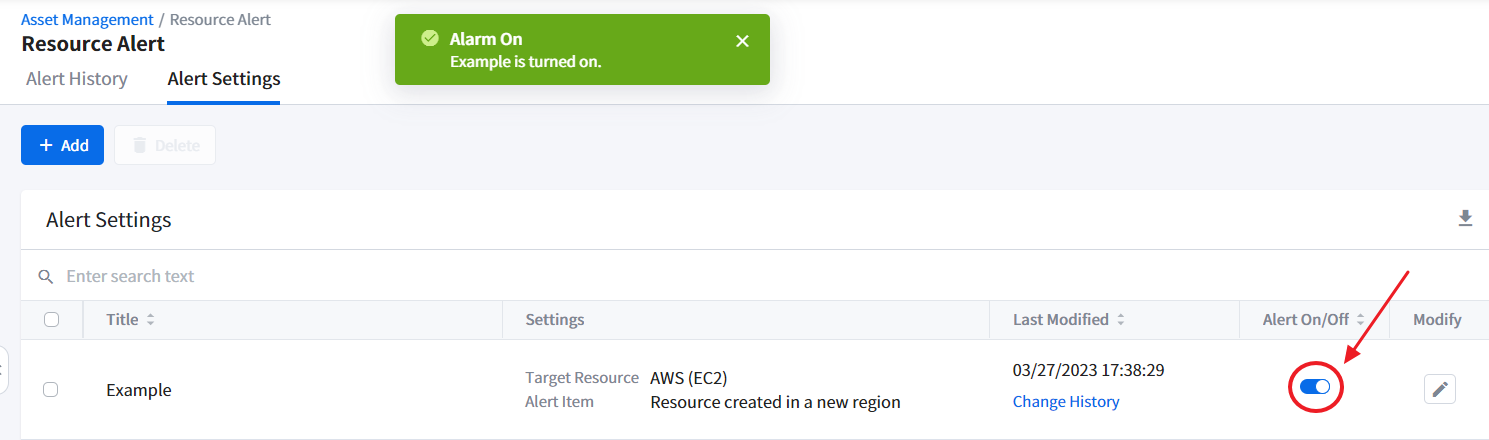
Turning On and Off Alerts
The alert setting must be turned on or activated to receive the resource alert. From the list of alert settings, click the toggle switch to turn [Alert On/Off]. When a resource anomaly event, which violated the alert setting rule, is detected, Resource Alert immediately sends the alert through the channel of your choice.
If the resource activity is detected as long as it violates the rules set, an alarm will be sent to the set alarm channel.
In case you want to temporarily deactivate the alert to stop receiving them, simply turn off the alert by switching off the [Alert On/Off] toggle switch.
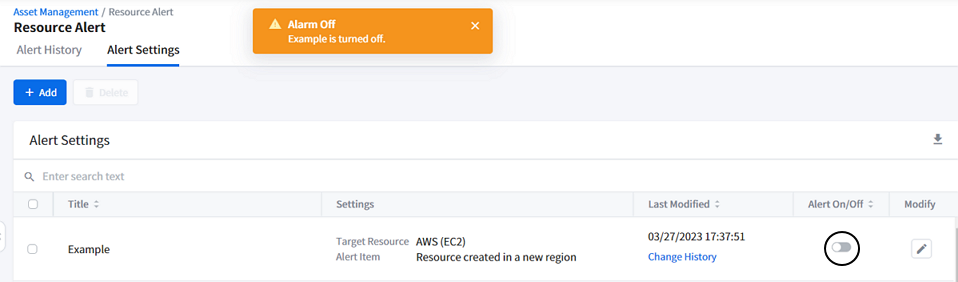
On the other hand, if you no longer need to receive the alert, delete the alert setting permanently instead of deactivating or turning it off. Please see the Deleting Alert Settings Guide for more.
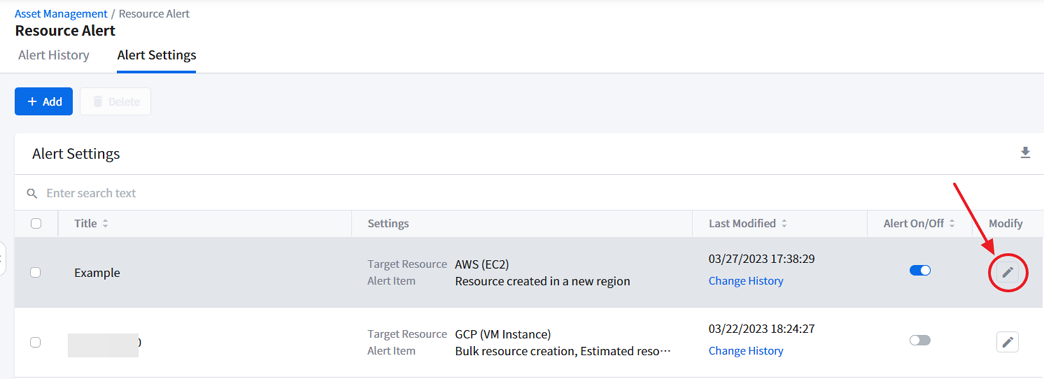
Modifying Alerts
To modify the alert setting, click the pencil icon in the Alert Settings list. Modify Alert window appears from the right. Make changes and click [OK] to save the changes.

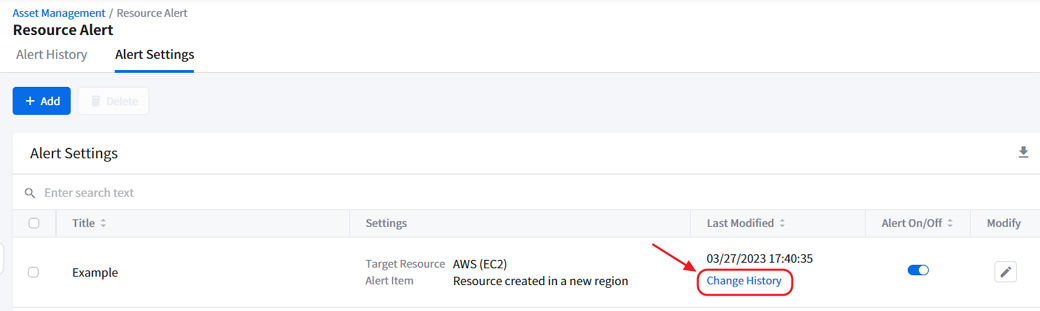
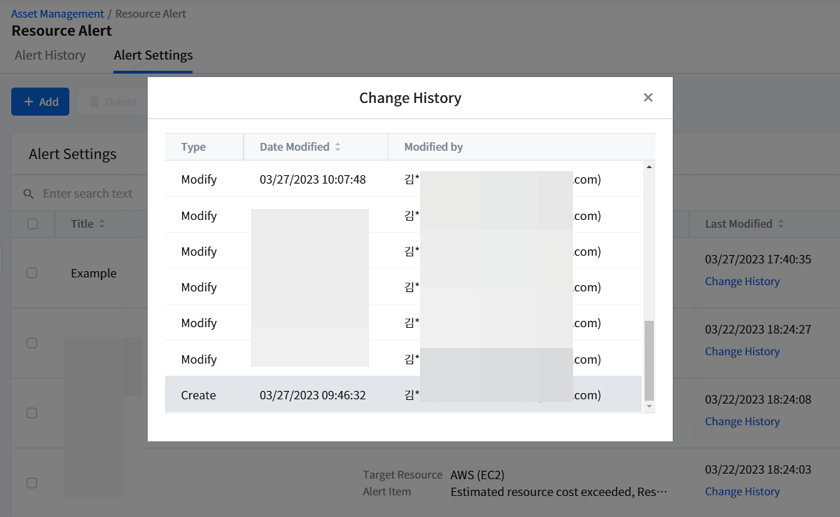
Viewing Change History
To learn more about who created the alert setting or when it was modified, click [Change History] on the Alert Settings list.
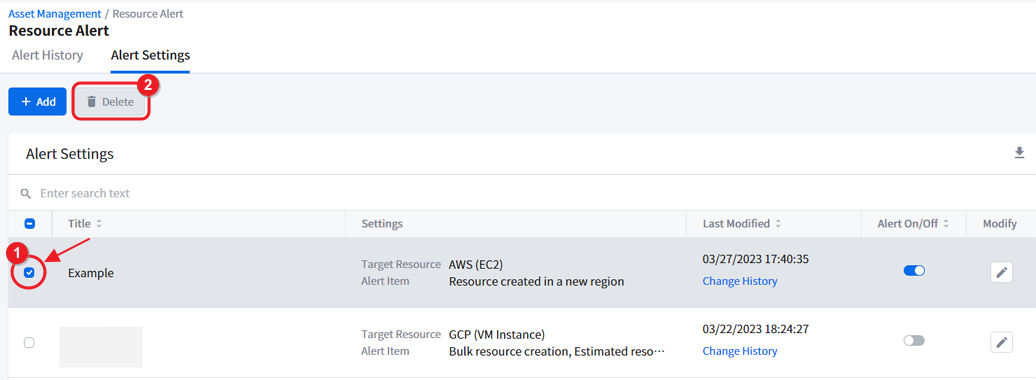
Deleting Alert Settings
① To delete the alert setting, select one and click the check box on the left of the list.
② Click [Delete], located next to the [+ Add] button.
📌 Attention: Once you delete the alert setting, it cannot be restored. Please review carefully when deleting.
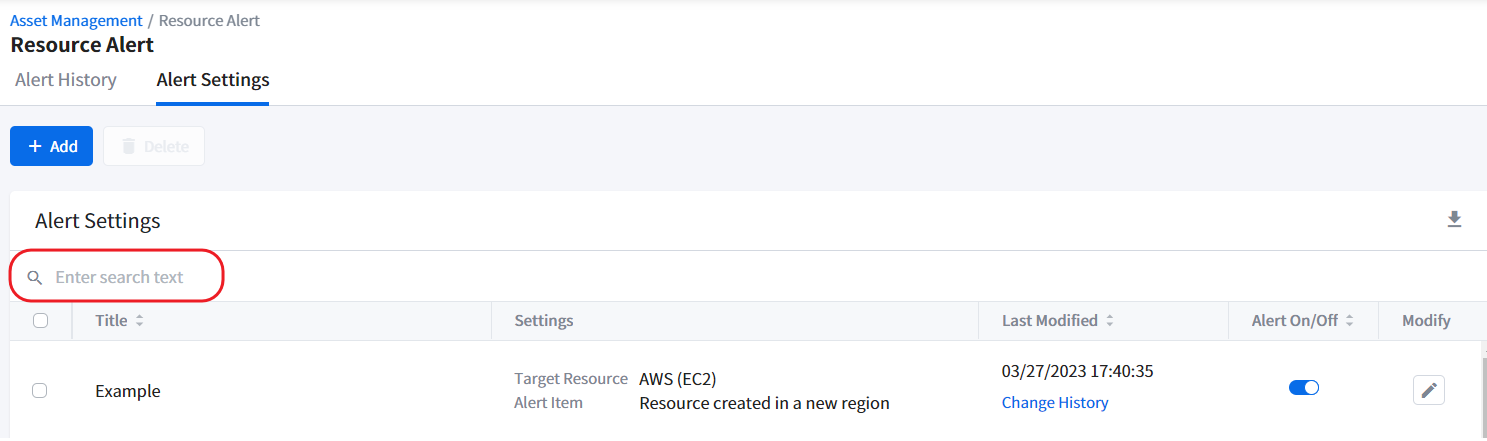
Searching Alert Settings
Use the Search feature to quickly find the alert setting you want. You can search for the alert setting’s Alert Title, Cloud Service, Resource Type, and/or Alert Rules.
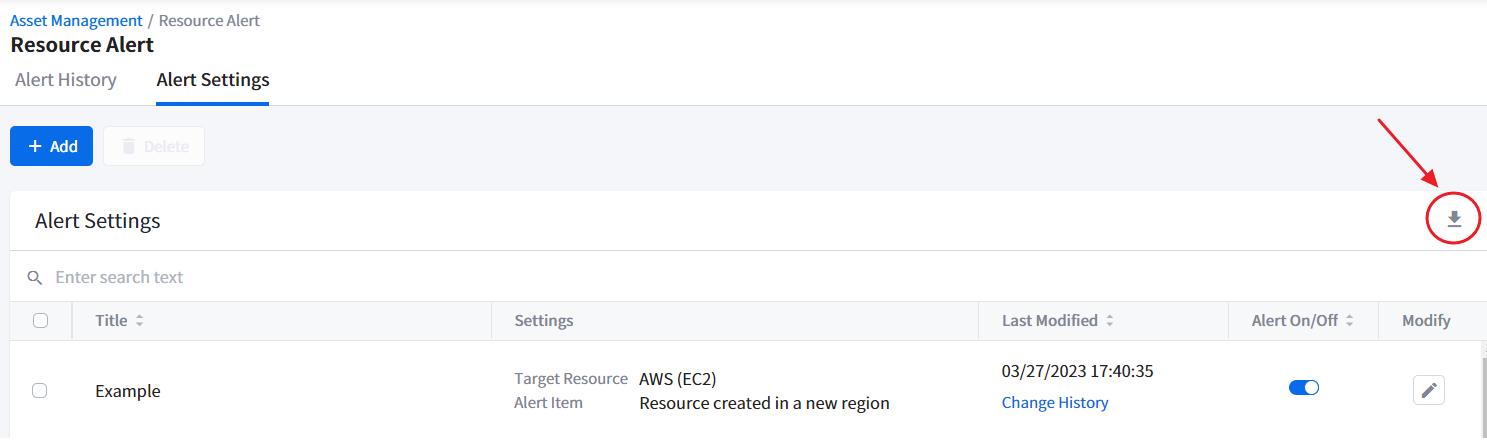
Downloading Alert Settings Data
If you want to share the alert settings data or archive it, you can download the data in Excel (.xlsx) by clicking the Download icon.
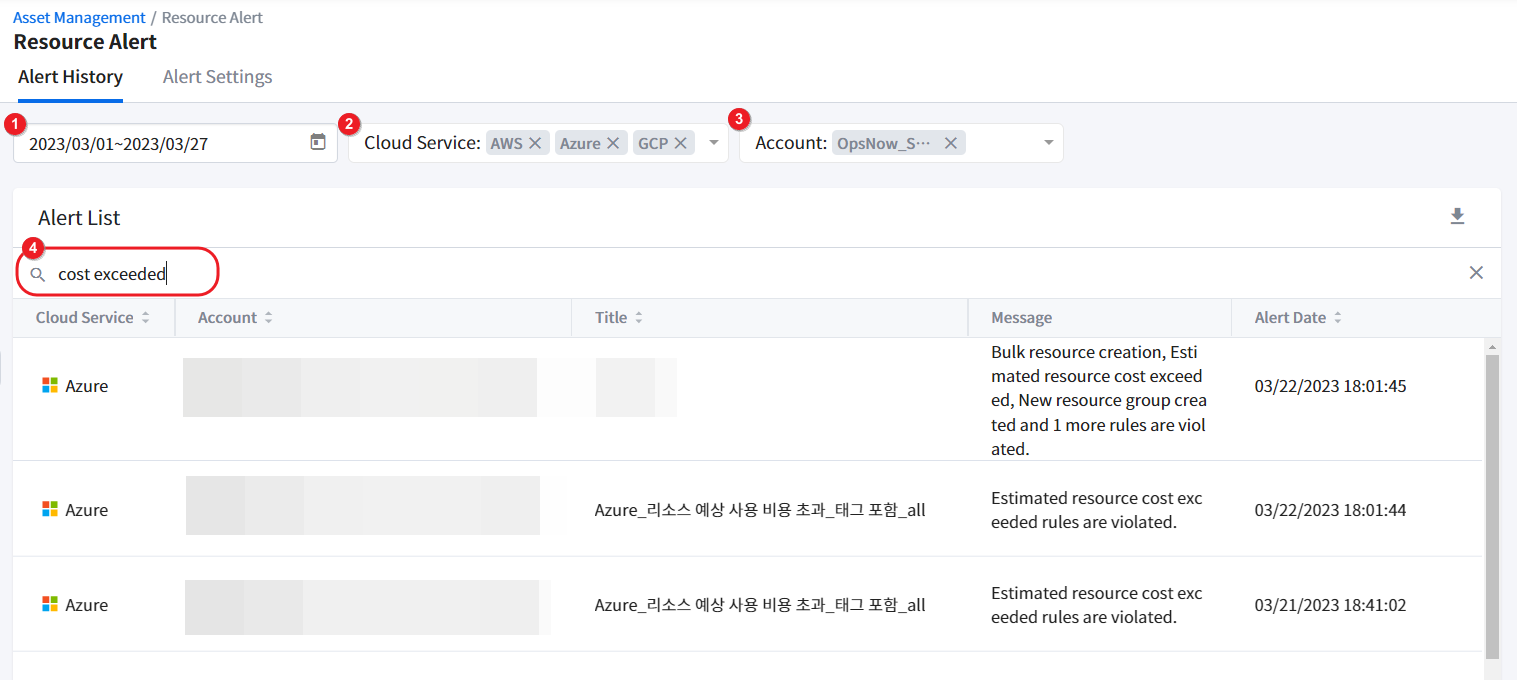
Alert History
Asset > Resource Alert > Alert History Tab
When a resource anomaly is detected and an alert is triggered, as you set in Alert Settings, the triggered alerts are listed on the Alert History page. You can apply multi-filters on this page to refine the alerts.
① Select a date range to query the alerts.
② Select one or more cloud services.
③ Select one or more accounts.
④ If you get too many search results or cannot find the data you want, enter search text in the search bar to get more specific search results.
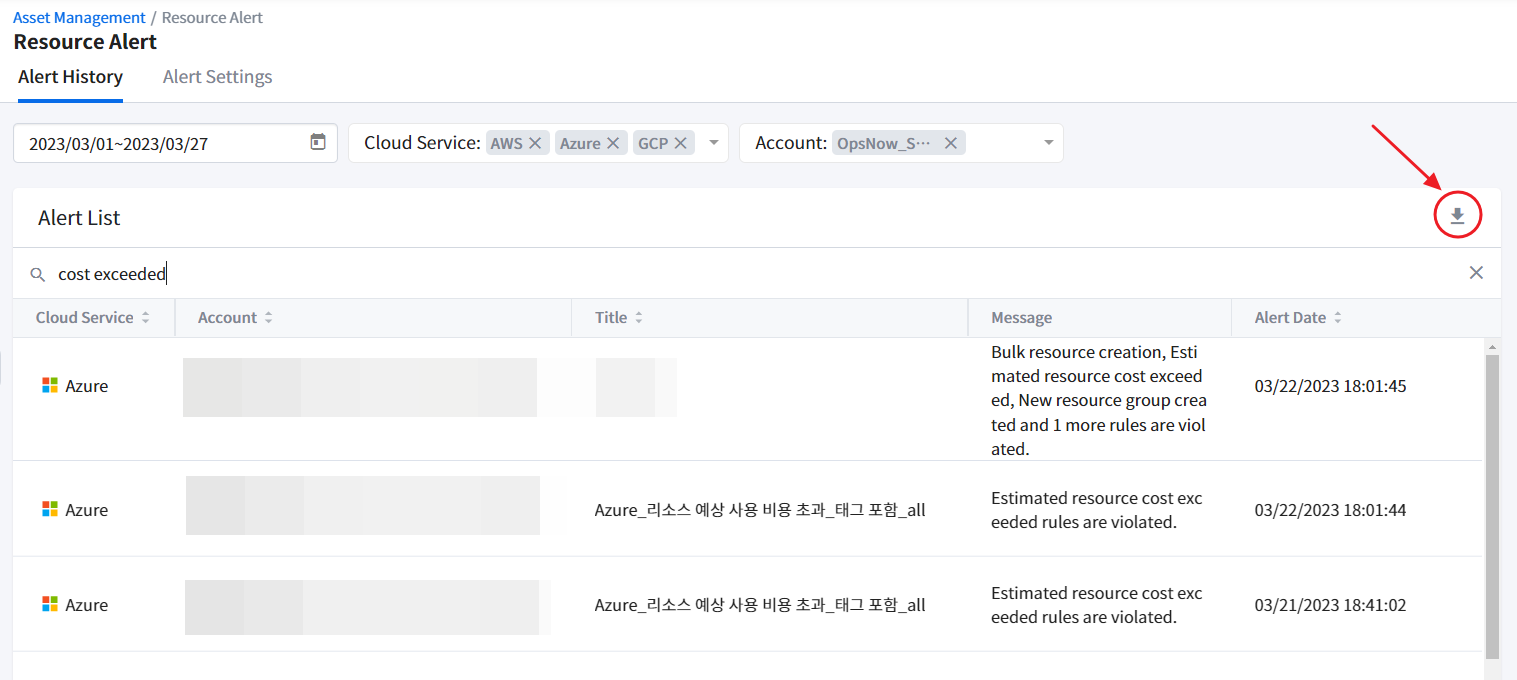
Downloading Alert History Data
If you want to share the alert history data or archive it, you can download the data in Excel (.xlsx) by clicking the Download icon.
Resource Scheduler
Depending on your country or region, this feature may not be available.
With Resource Scheduler, you can schedule instances to start or stop automatically whenever you want. Only run the resources when you are actually using them and save cloud costs dramatically by turning off the unused resources. Resource Scheduler starts and stops resources based on AWS resource tags or GCP resource labels.
Required Permission to Use Resource Scheduler
You need to grant Start Instances and Stop Instances permissions to the System to use the Resource Scheduler.
AWS Permissions
To grant permissions that would allow the System to start and stop AWS resources, you need to do the following in Service Portal > Cloud Account.
A. Add your AWS account in Cross-Account Access method, or
B. Update your stack template if you have already registered your account in the cross-account access method, including the following JSON data on the AWS console.
                    {
                      "Version": "2012-10-17",
                      "Statement": [
                        {
                          "Action": [
                            "ec2:StartInstances",
                            "ec2:StopInstances"
                          ],
                          "Resource": "arn:aws:ec2:*:*:instance/*",
                          "Effect": "Allow",
                          "Sid": "Scheduling"
                        }
                      ]
                    }
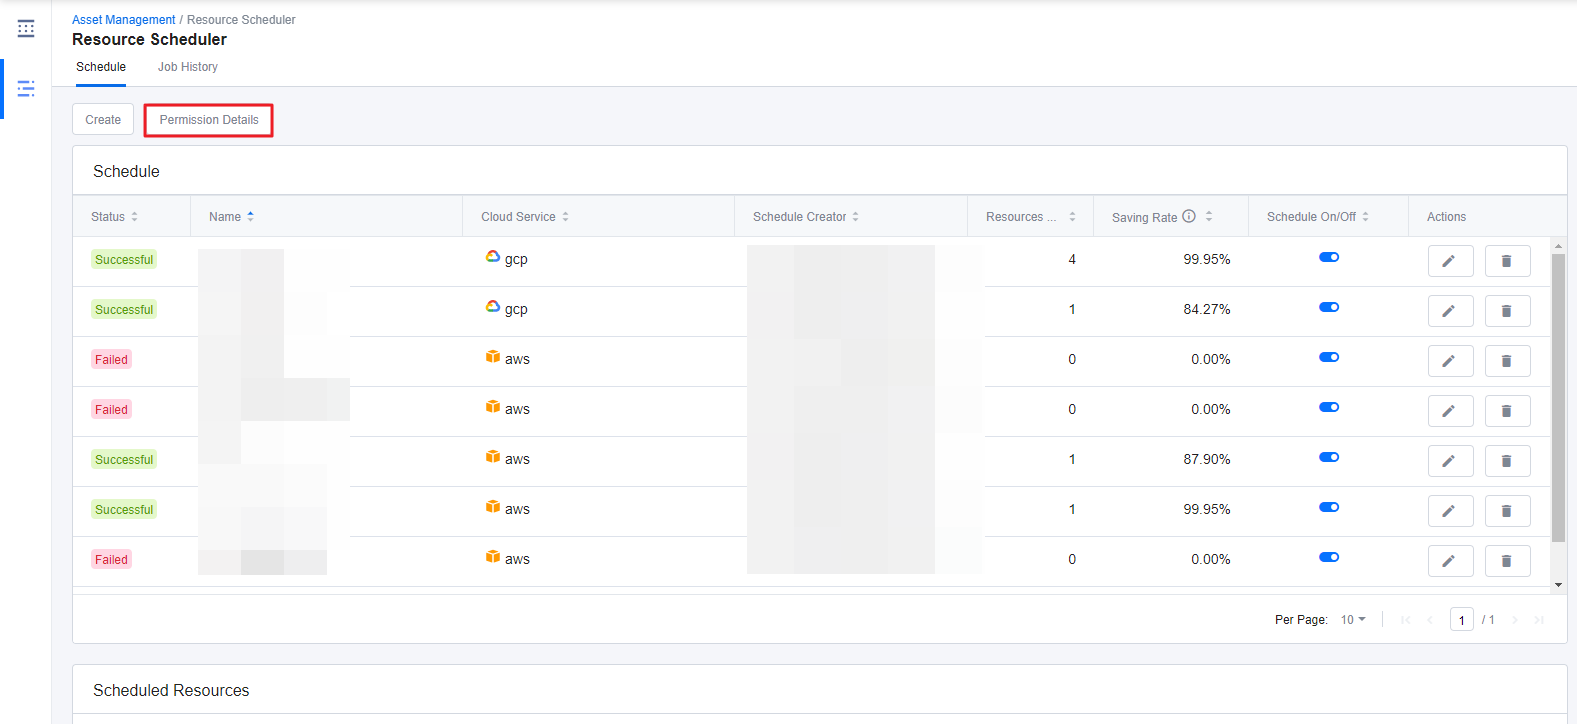
You can check out the details by clicking the Permission Details button on the Schedule page.
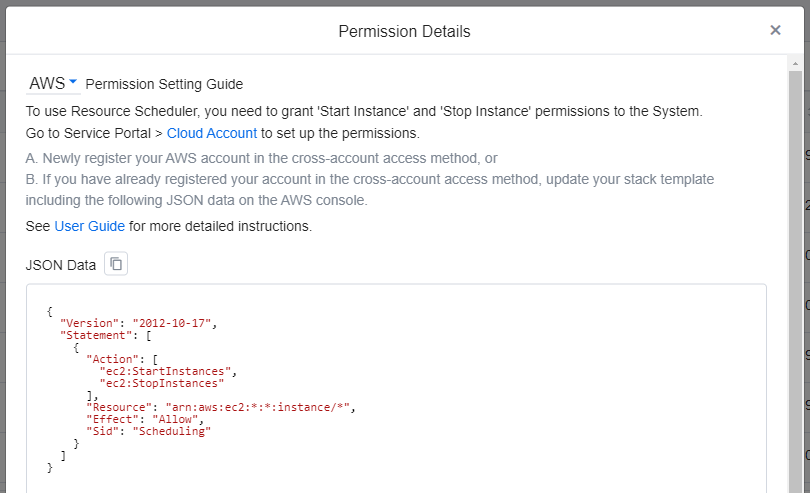
📜 Note: When registering AWS accounts, the System strongly recommends the cross-account access method, and therefore, Resource Scheduler only supports the accounts that registered with cross-account access method.
GCP Permissions
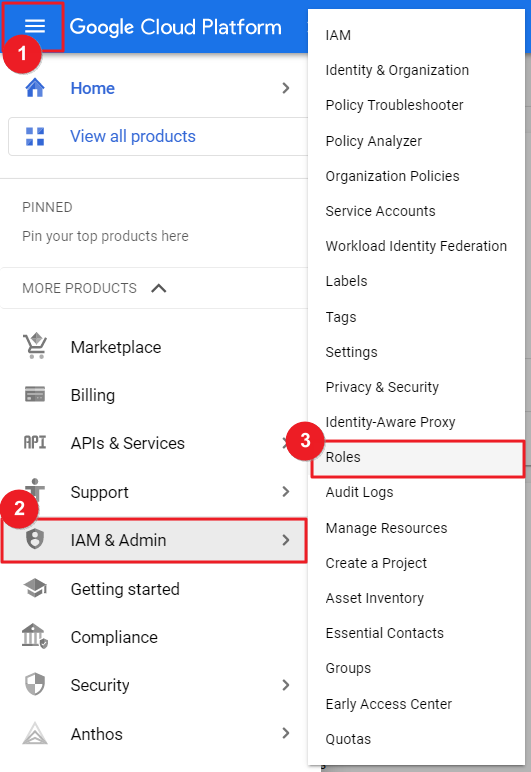
You need to grant ‘compute.instances.start’ and ‘compute.instances.stop’ permissions to the System to use Resource Scheduler. Follow the instructions below to grant necessary permissions by creating a role on the GCP console to the System.
📜 Note: Only the Owners who has the permissions to create a role can grant such permissions to the System.
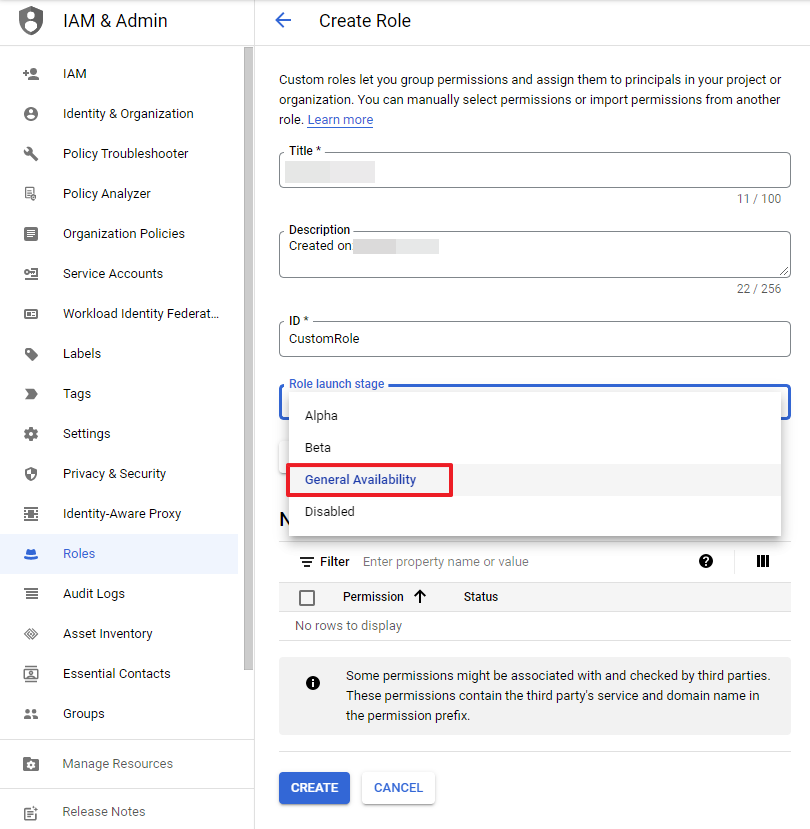
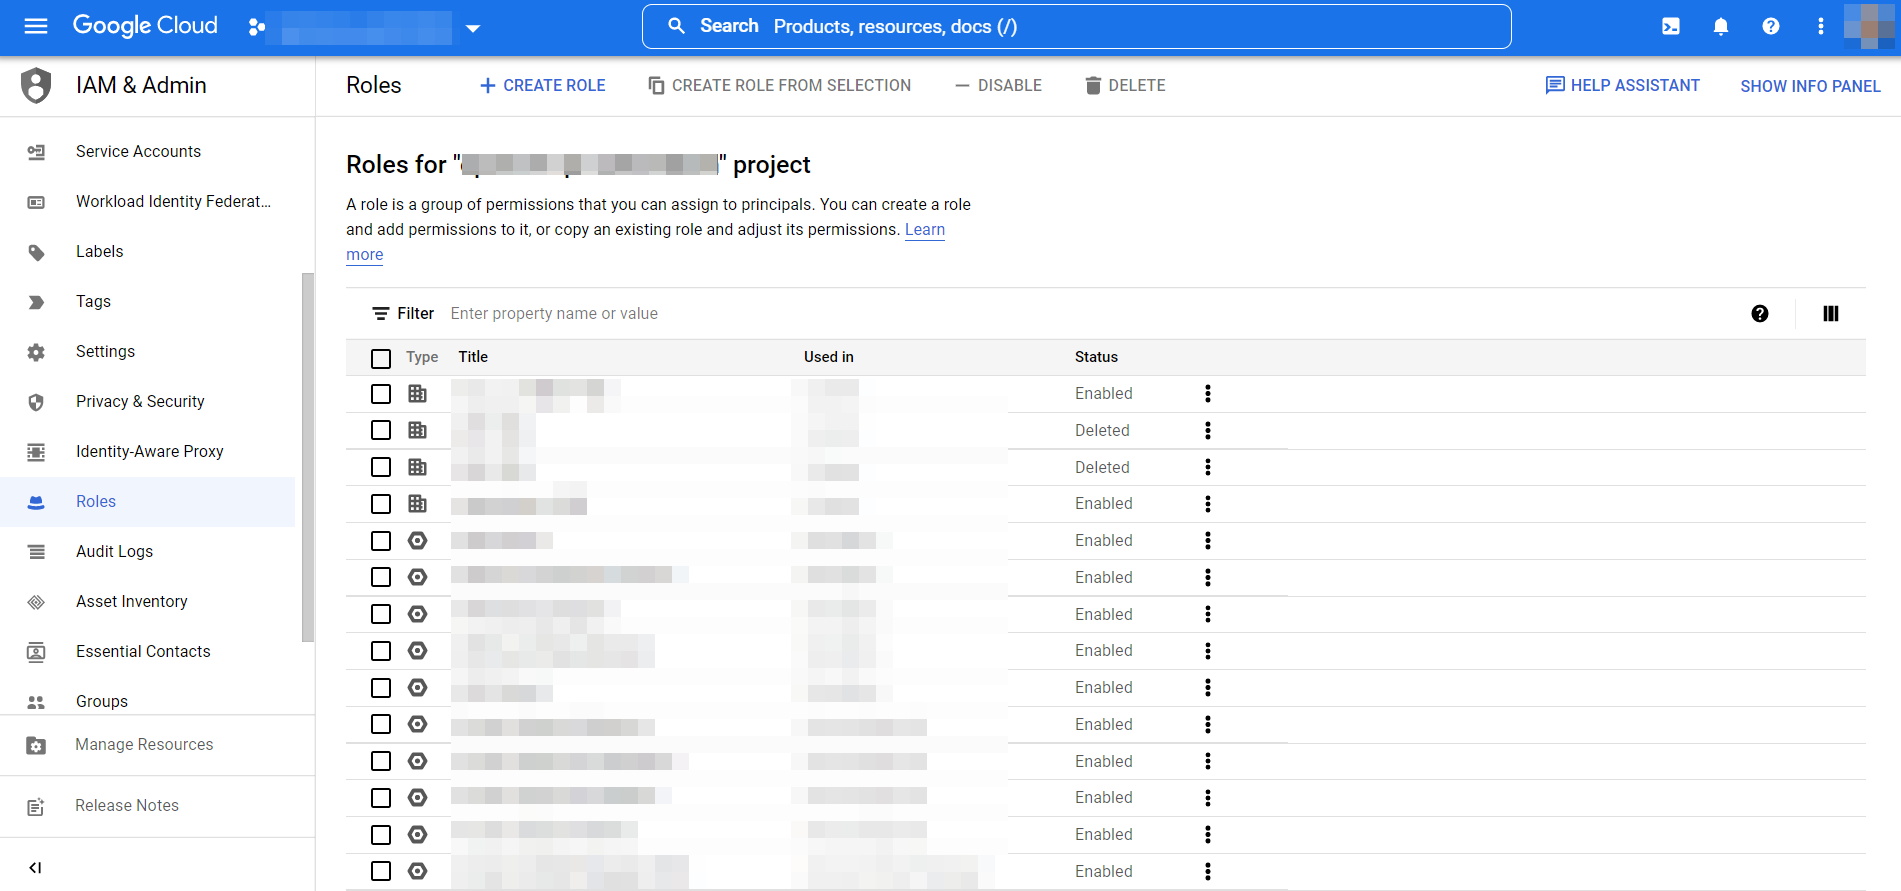
① Go to GCP Console Home and move to IAM & Admin > Roles page.
② Click CREATE ROLE.
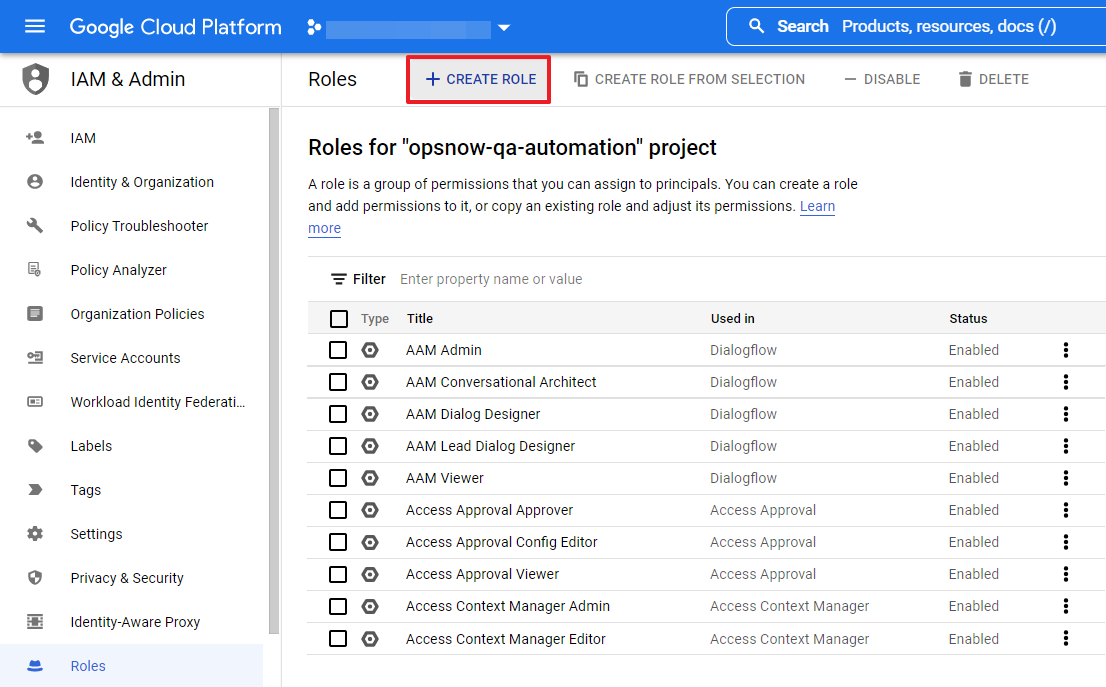
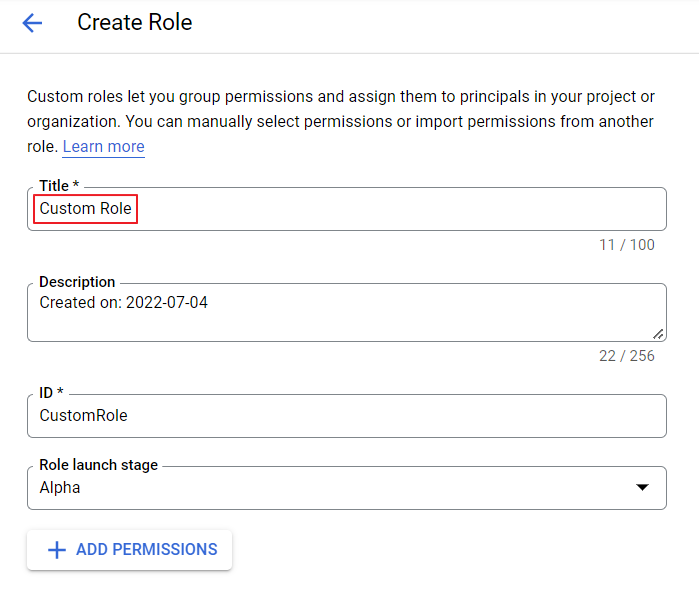
③ Enter Title and ID and select General Availability for the Role launch stage.
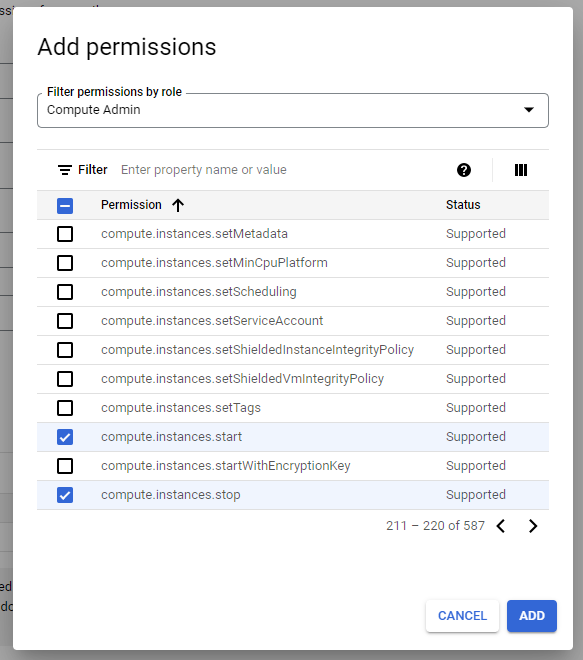
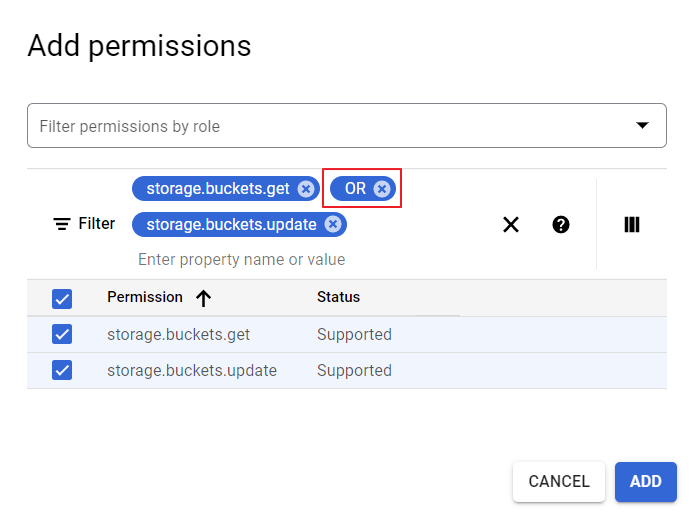
④ Click the ADD PERMISSIONS button and select Compute Admin from the Filter permissions by role drop-down list. And then search and select compute.instances.start and compute.instances.stop from the permissions list. Click the ADD button.
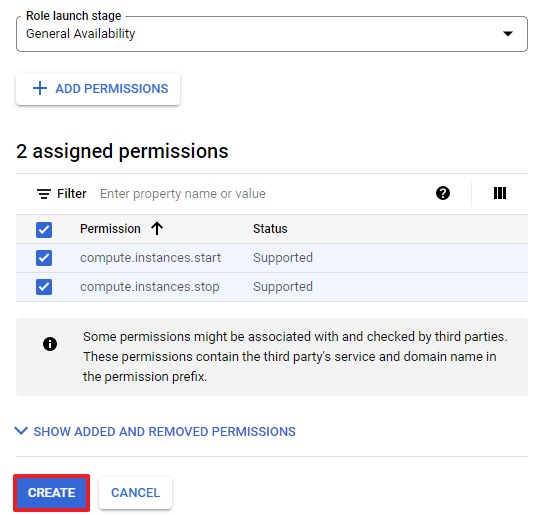
⑤ Click CREATE to complete creating a role.
⑥ Now, go to IAM & Admin > IAM page to edit the current permissions. To edit the principal (service account) permission linked to the Resource Scheduler menu, click the pencil icon on the right.
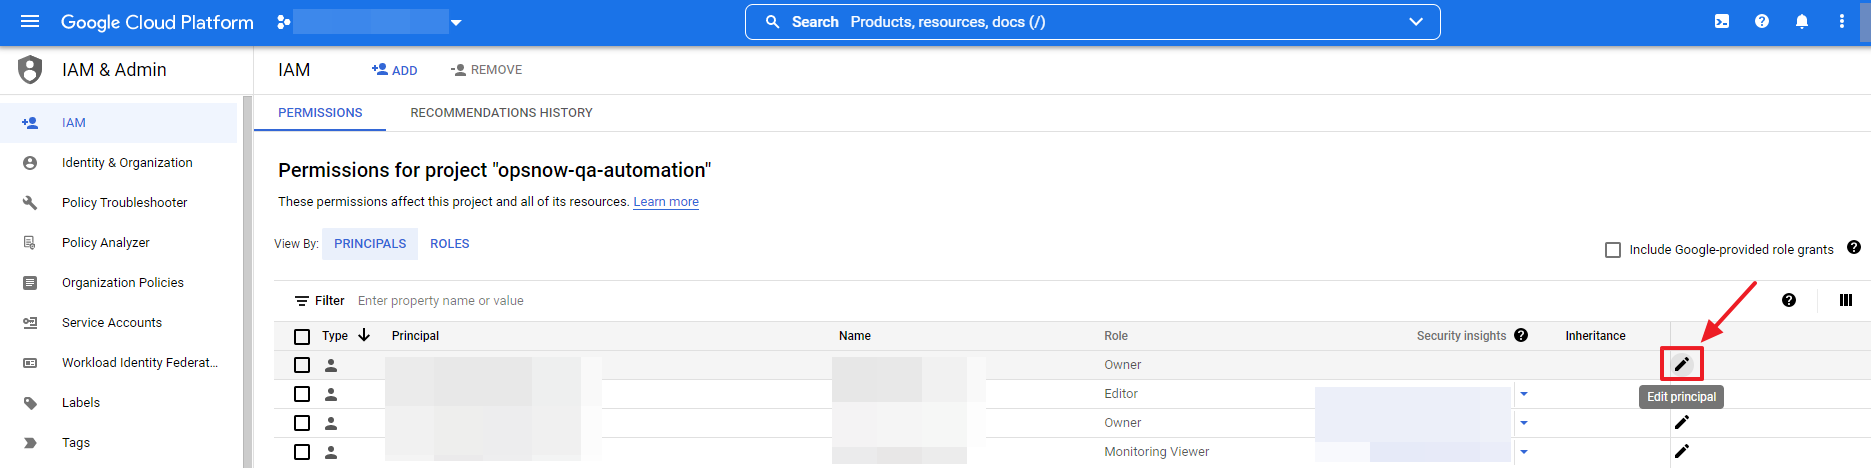
⑦ Click ADD ANOTHER ROLE and select Custom for the Select a role field and then select the created Role.
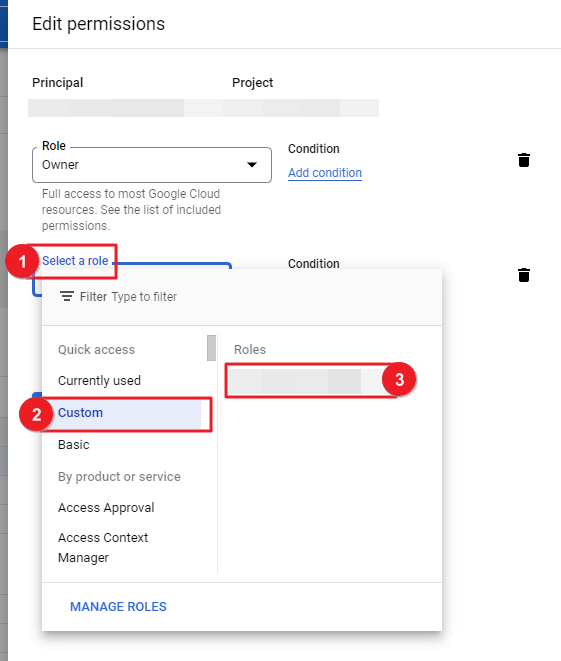
⑧ All required permission settings are now completed.
Create Resource Schedule
This section explains how to create a Schedule to start or stop the instances whenever you want.
① Go to Asset Management > Resource Scheduler > Schedule tab, and click Create.

② Enter a Name, without any space, and select a Cloud Service Provider as well as a Resource Type for this schedule.
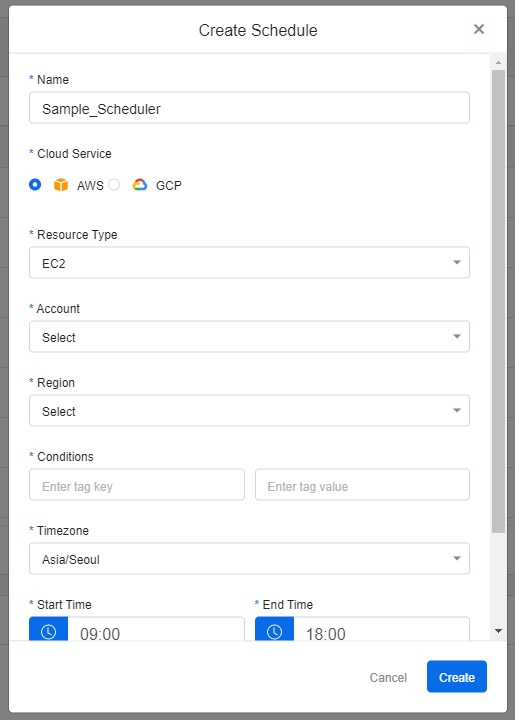
③ Fill in all items as they are required to create a schedule.
| Item | Description |
|---|---|
| Account/Project | Registered accounts on the Cloud Accounts of the Service Portal are provided in the dropdown options. Select the cloud account alias. |
| Region | Select a region for the resource. |
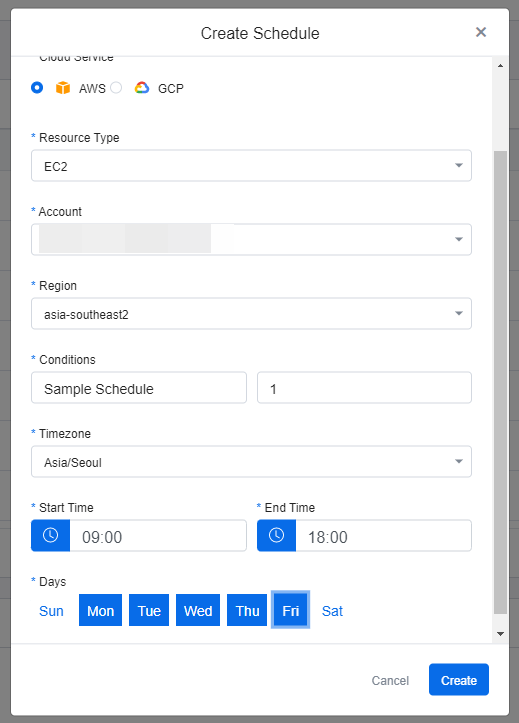
| Conditions | Enter value and key, which are the conditions for this schedule. For AWS resources, enter tag key and tag value. For GCP resources, enter label key and label value. Only the resources matching the given key and value are subject to this schedule. The AWS tags can be applied in the Service Portal > Tag Assistant. |
| Timezone | Select a timezone. |
| Start and End Time | Enter the start and end time for the Scheduler. You can either enter the time directly or click the Clock icon to select the time. When you are setting the time for the schedule, you can only enter the time in H:mm form. You cannot enter any other special characters or letters here. |
| Days | Select one or more days that you want the Schedule to run. |
💡 Go to Tag Assistant Guide for more information.
④ Click Create to create a new Schedule.
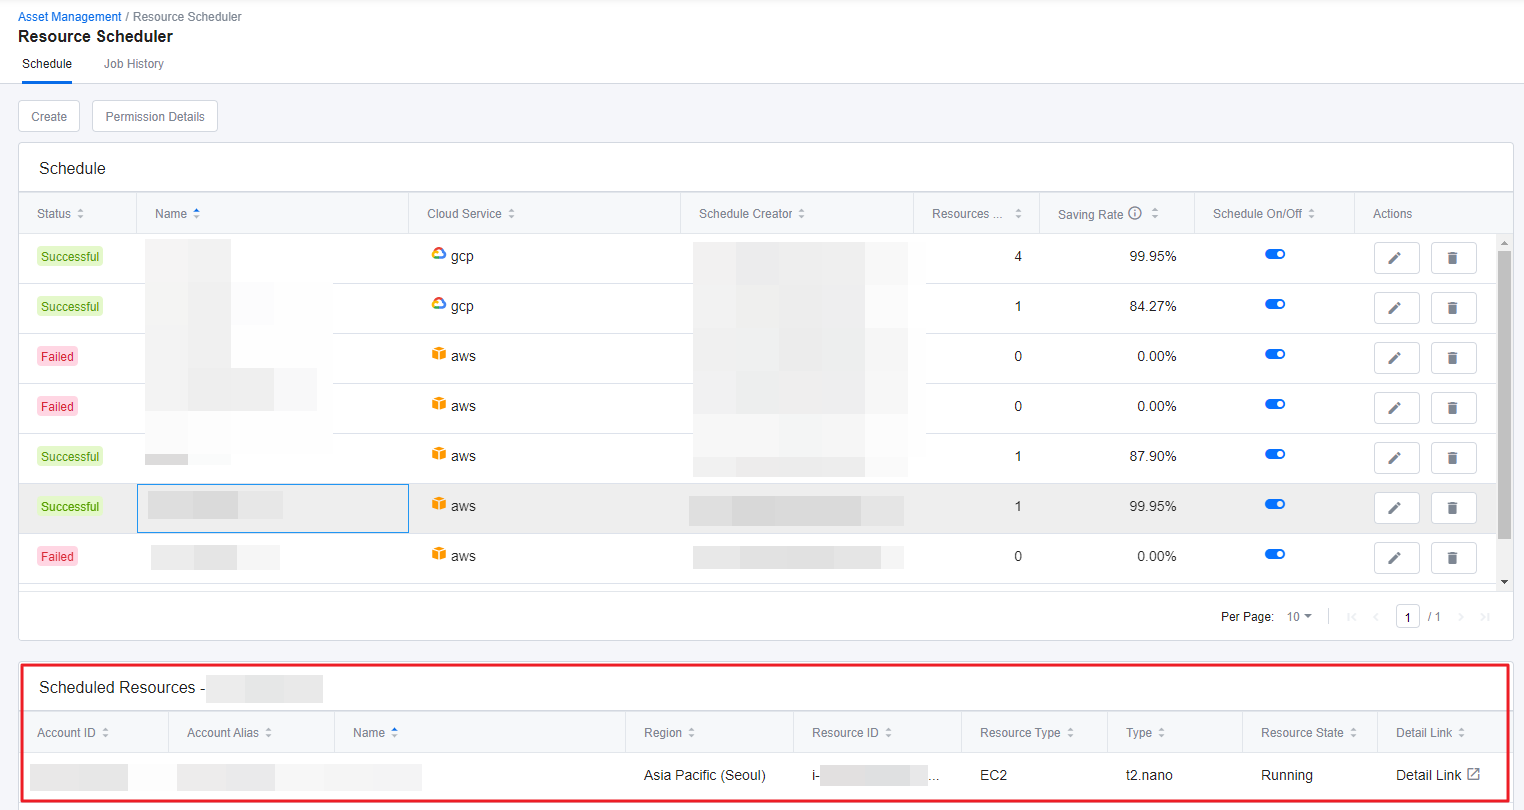
View Scheduled Resources
This section explains how to view the created schedules and the scheduled resources.
① Click a schedule from the list on the Schedule tab. If the number of scheduled resource is 0, then no resources are shown in the Scheduled Resources table.
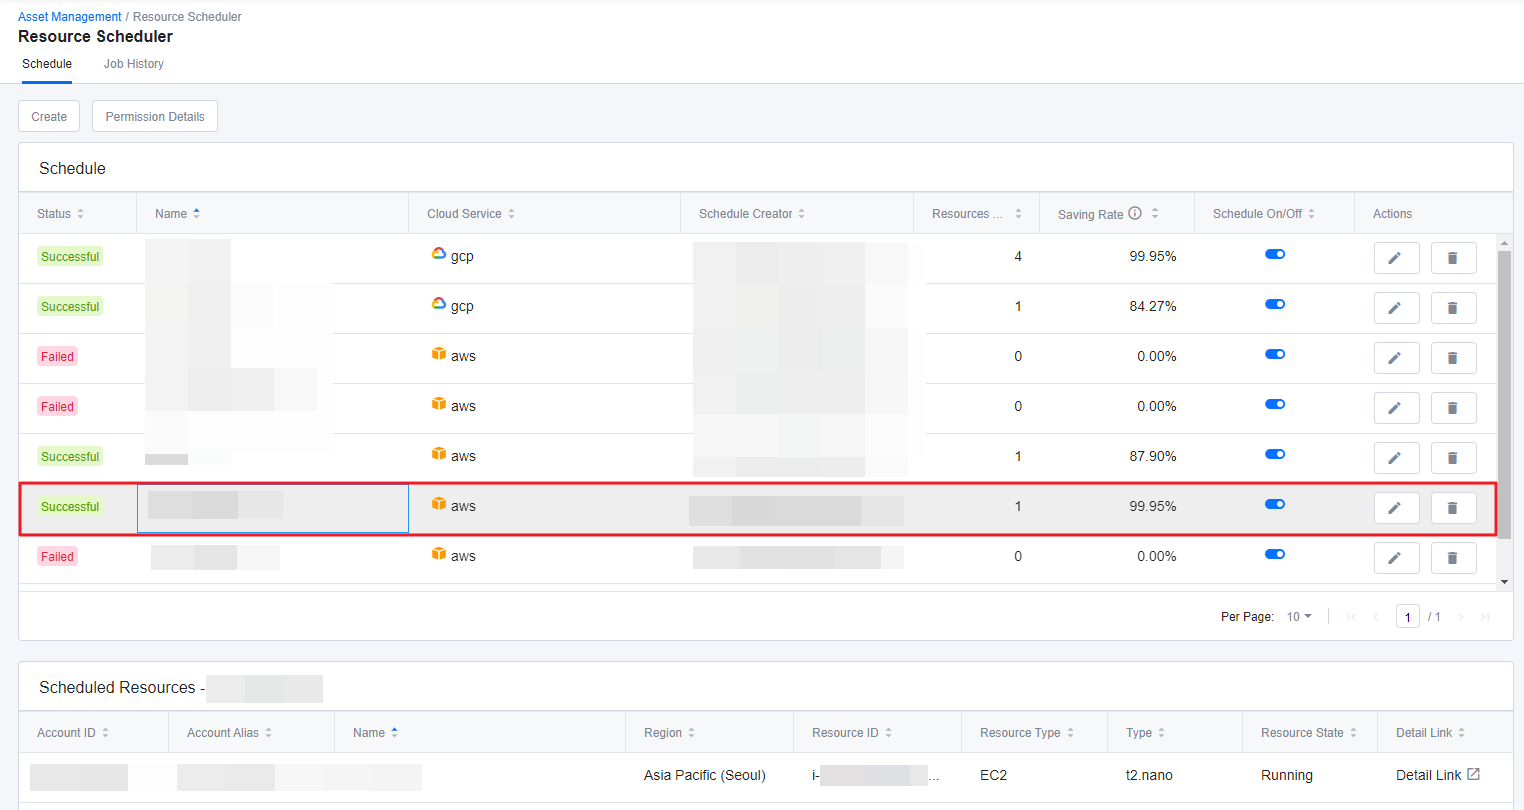
② You can view Account/Project ID, Account/Project Alias, Schedule Name, Region, Resource ID, Resource Type, Instance Type, and the resources’ current State under the Scheduled Resources table. If you want to view more details about the resource, click Detail Link.
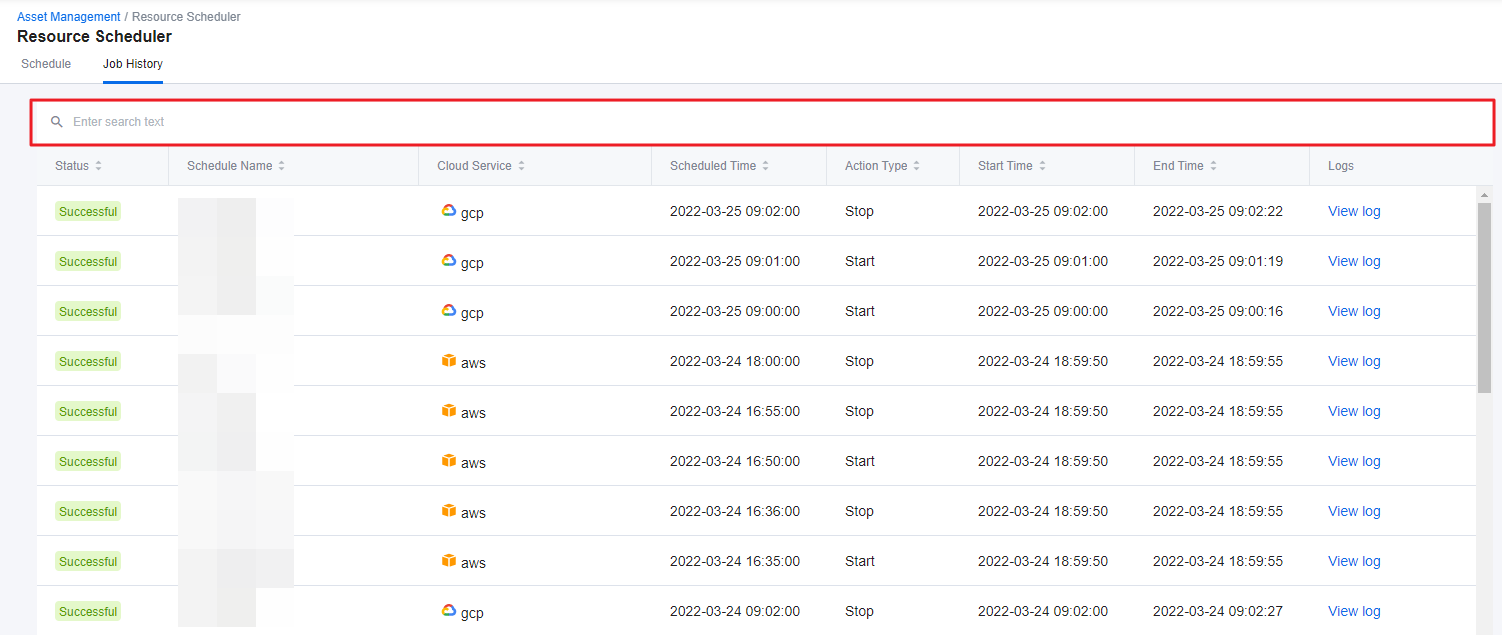
View Schedule History
This section explains how to view the history of previously executed schedules.
① Go to Job History tab.

② You can view all of the executed schedules when the resource was Started or Stopped, and you can also search for specific job history from the top of the page.
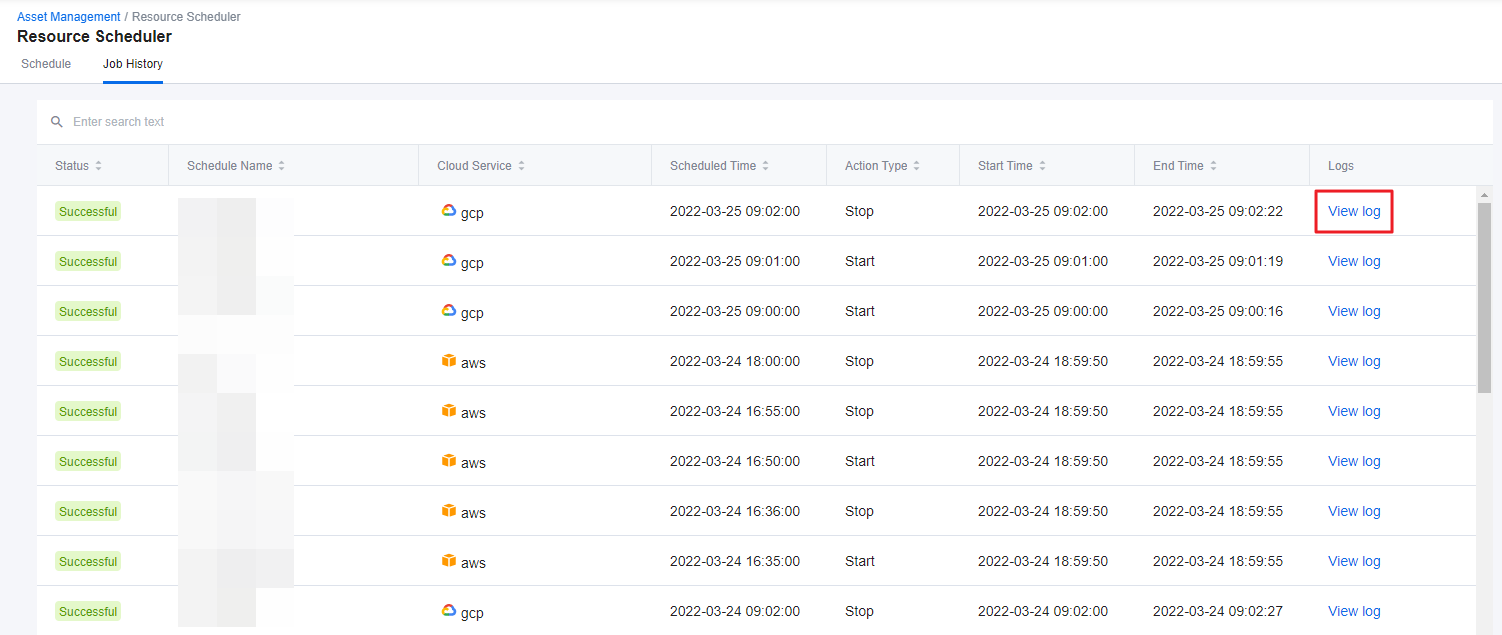
③ Click View log to see refined and summarized version of the job log.
Turn On and Off Schedule
This section explains how to turn on or off the Scheduler.
① Select a resource schedule from the Scheduler tab and click the On/Off toggle switch.
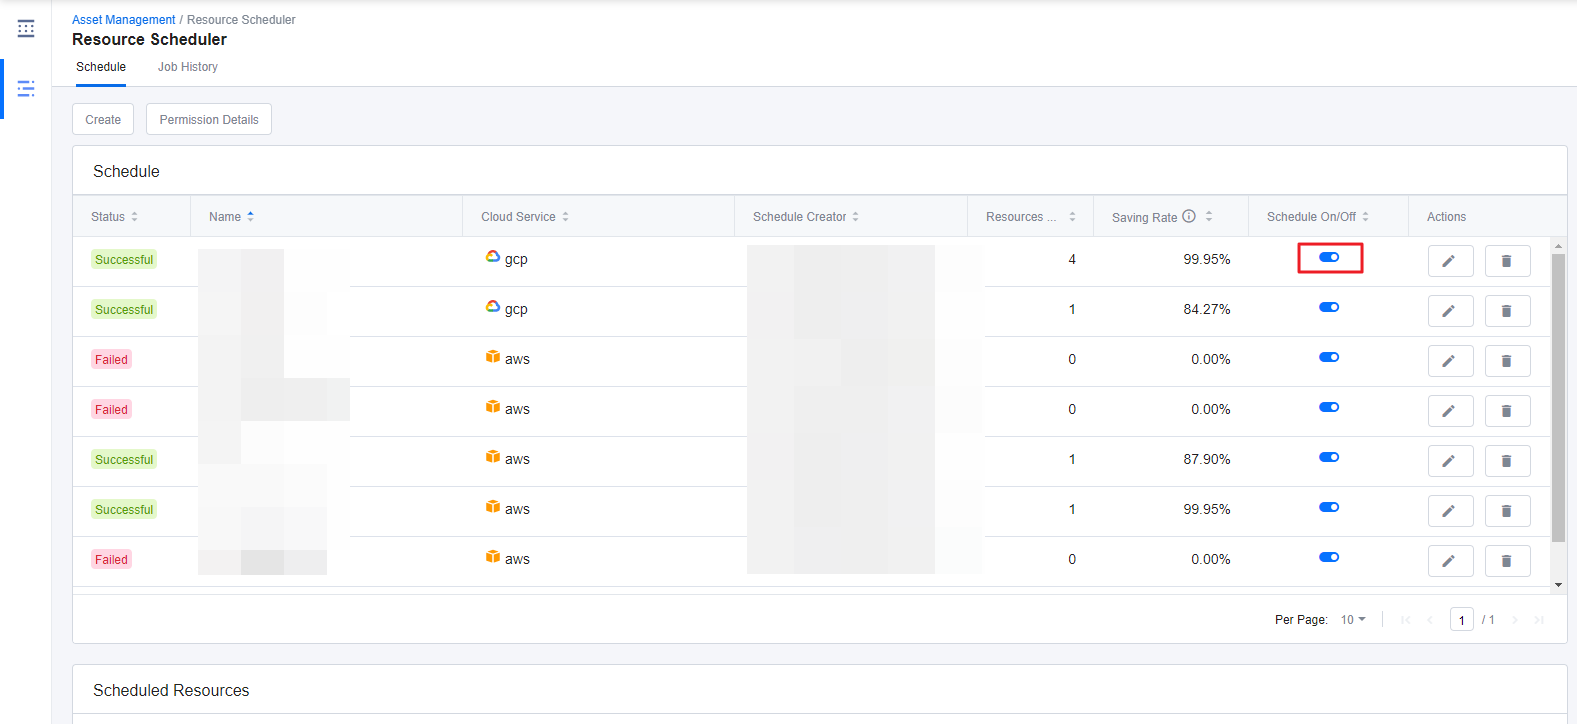
② When the schedule is running or on, it displays blue color, and when it is not, it displays gray color, meaning the schedule is currently off.
Modify Resource Schedule
This section explains how to modify a created resource schedule. Only the Schedule Creator who created the schedule can modify it.
① Select the schedule that you want to modify and click the Pencil icon.
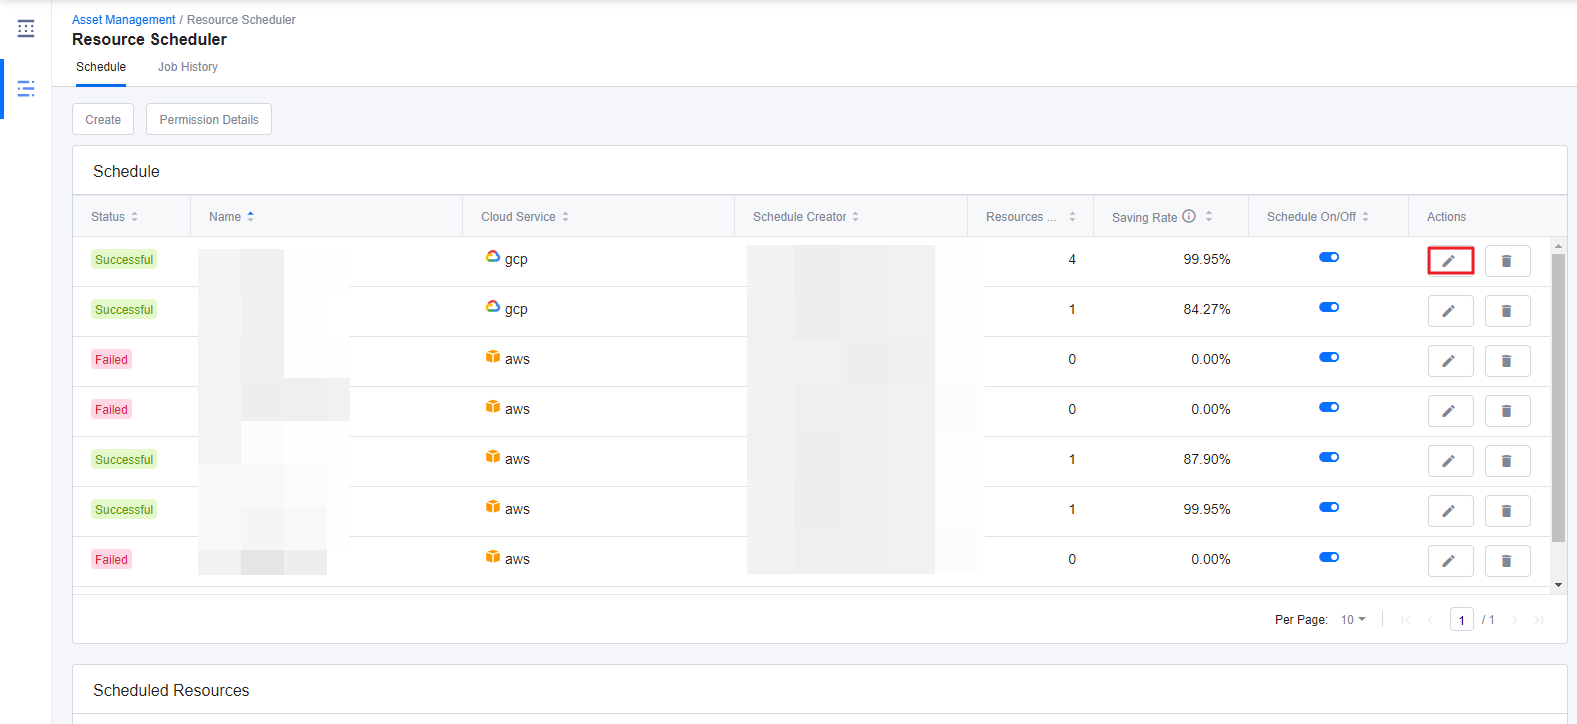
② Modify Schedule window that looks exactly the same as the Create Schedule appears. Make changes and click Save on your lower right.
Delete Resource Schedule
This section explains how to delete a created resource schedule. Only the Schedule Creator who created the schedule can delete it.
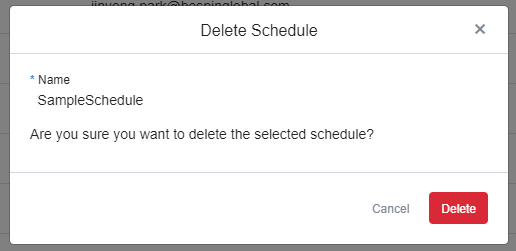
① Select the schedule that you want to delete and click the Trash bin icon.
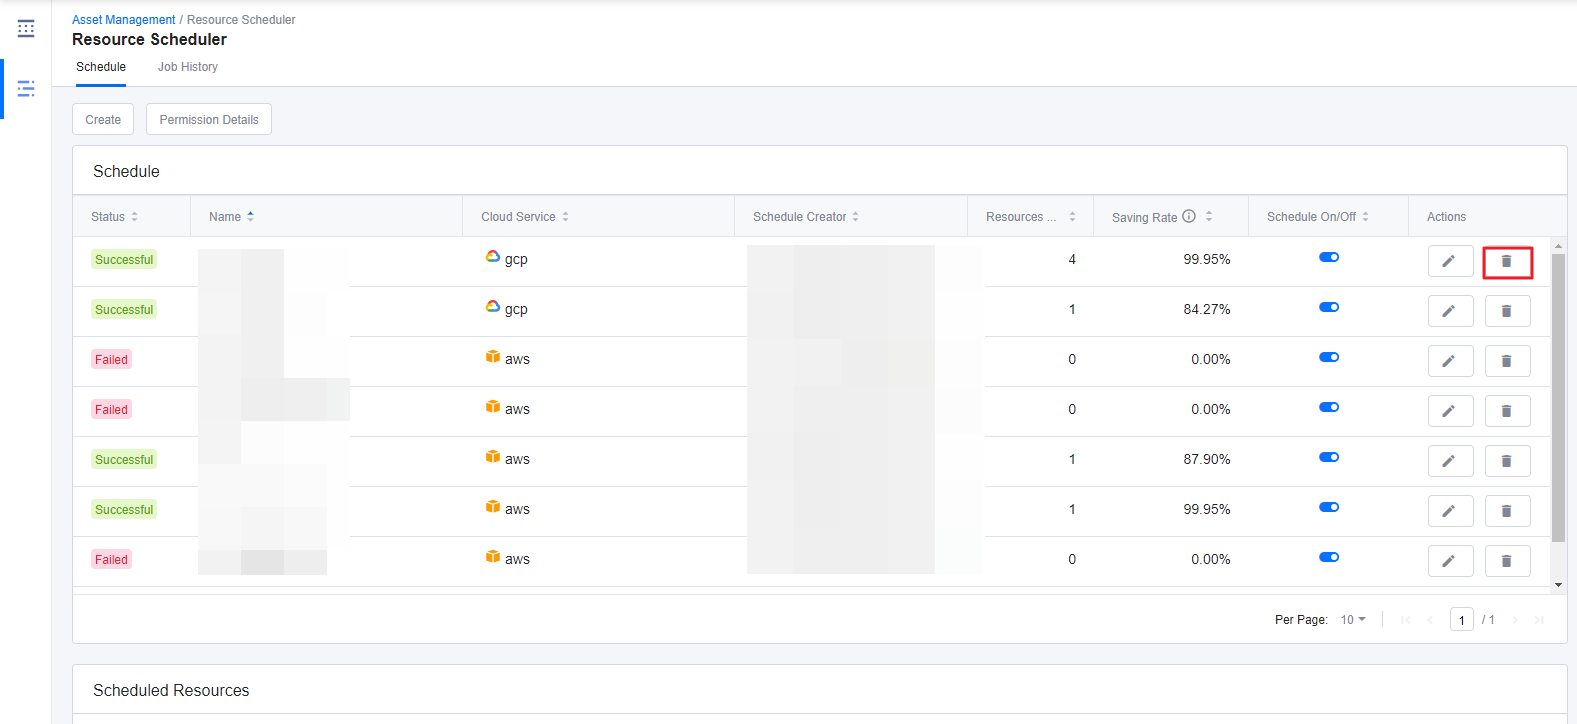
② A window appears to confirm the delete action. Click Delete to go ahead and delete the schedule.
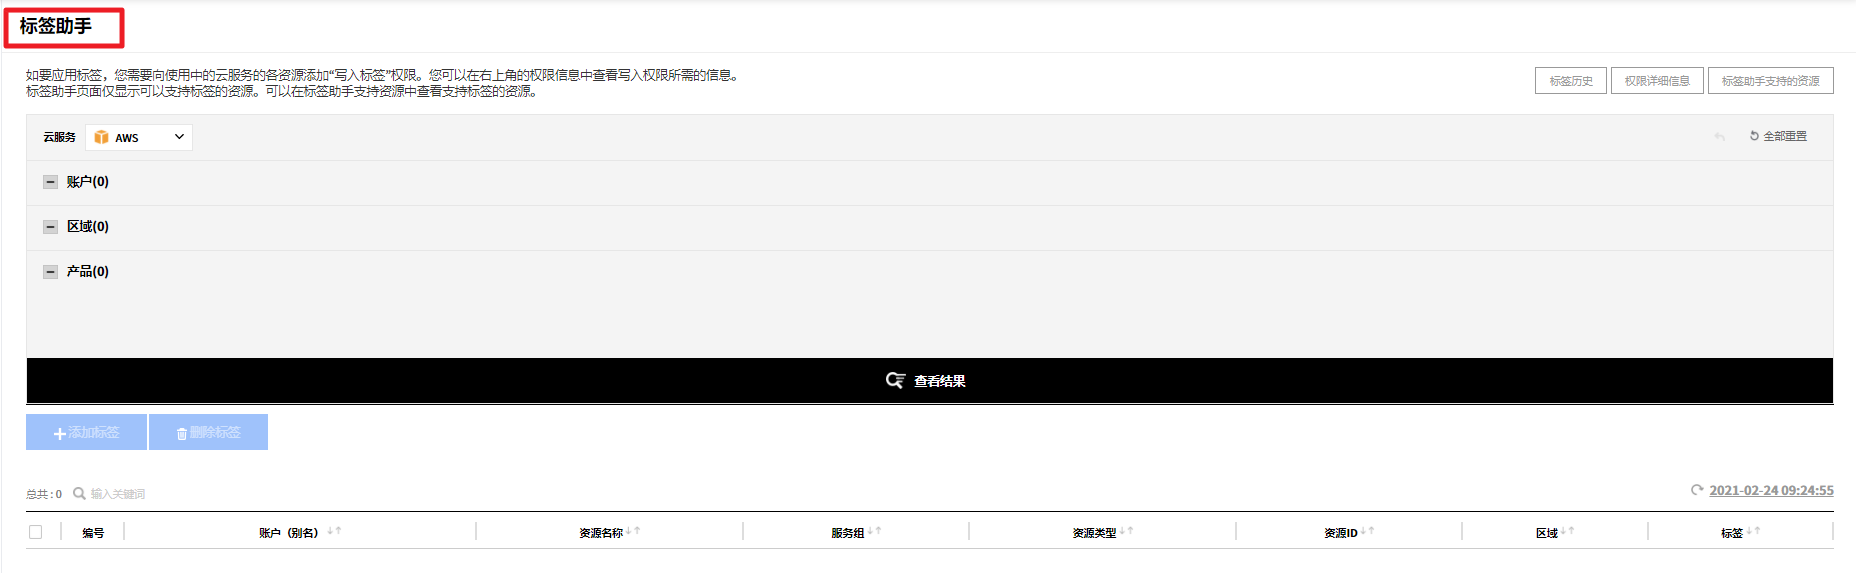
标签助手
标签可以根据使用目的、所有者、环境等,以不同的方式对资源进行分类。同时支持在为账户、区域、产品等资源指定标签后按标签搜索及筛选,实现资源的便捷管理。标签助手是一个帮助您快速为资源指定标签的功能。
标签助手无需访问AWS控制台,可直接从服务门户为资源添加或删除标签。由于AWS控制台要求每个账户都必须登录,且每个产品都提供标签编辑,因此实际进行标签编辑时会花费很多时间,也可能导致人为错误。另一方面,标签助手允许用户自由地为多个账户、区域和资源批量应用及删除标签,同时支持便捷管理标签历史记录。
添加权限
使用标签助手需要标签写入权限。请复制标签助手权限信息菜单提供的JSON文件,然后将其粘贴到AWS控制台中以添加权限。此外,必须为每个账户添加标签写入权限才能使用标签助手功能。
添加权限的有如下两种方式。
根据您在登录云账户时使用的IAM访问密钥方式或是跨账户访问方式,选择以下一种方法进行操作。

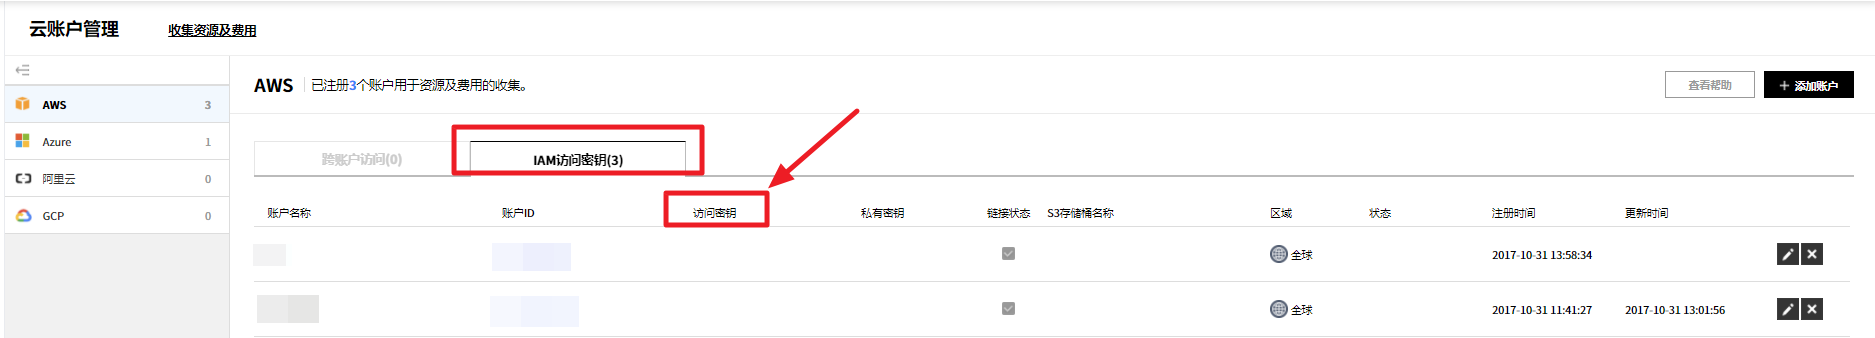
使用IAM访问密钥方式登录账户时
在服务门户->云账户-> IAM访问密钥选项卡中,复制要授予账户的访问密钥。
![]()
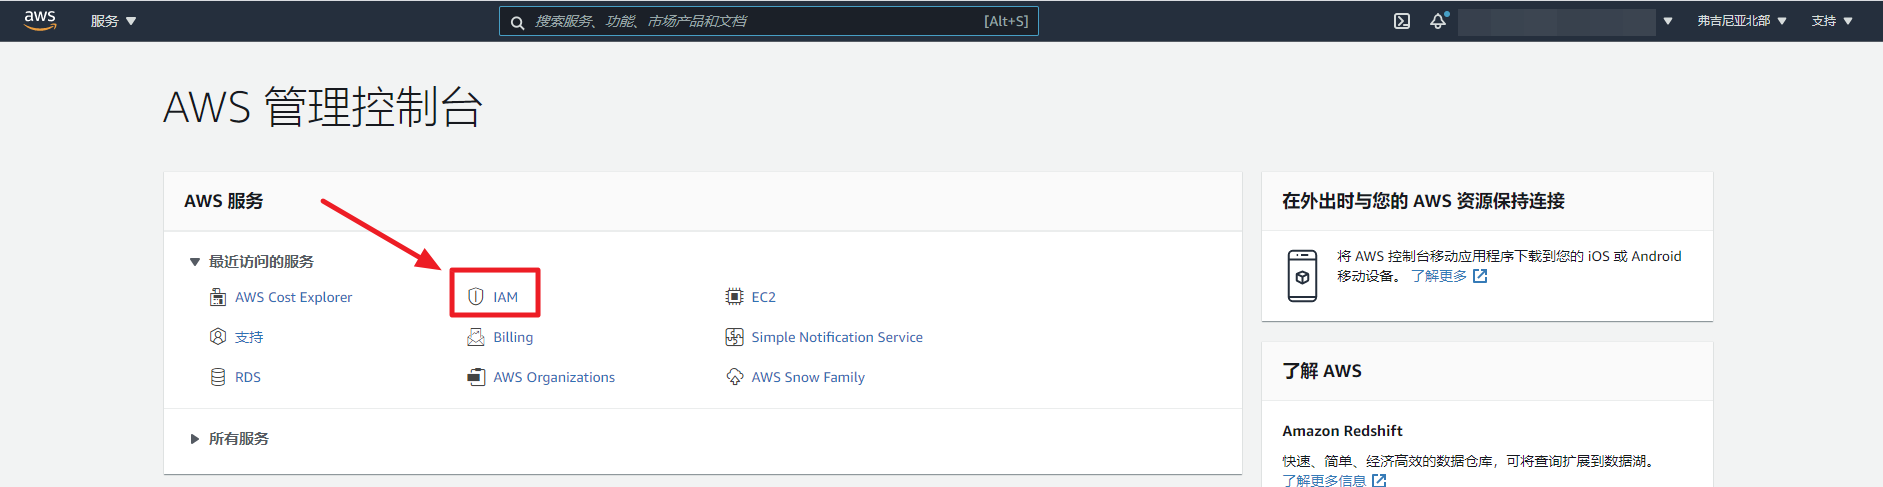
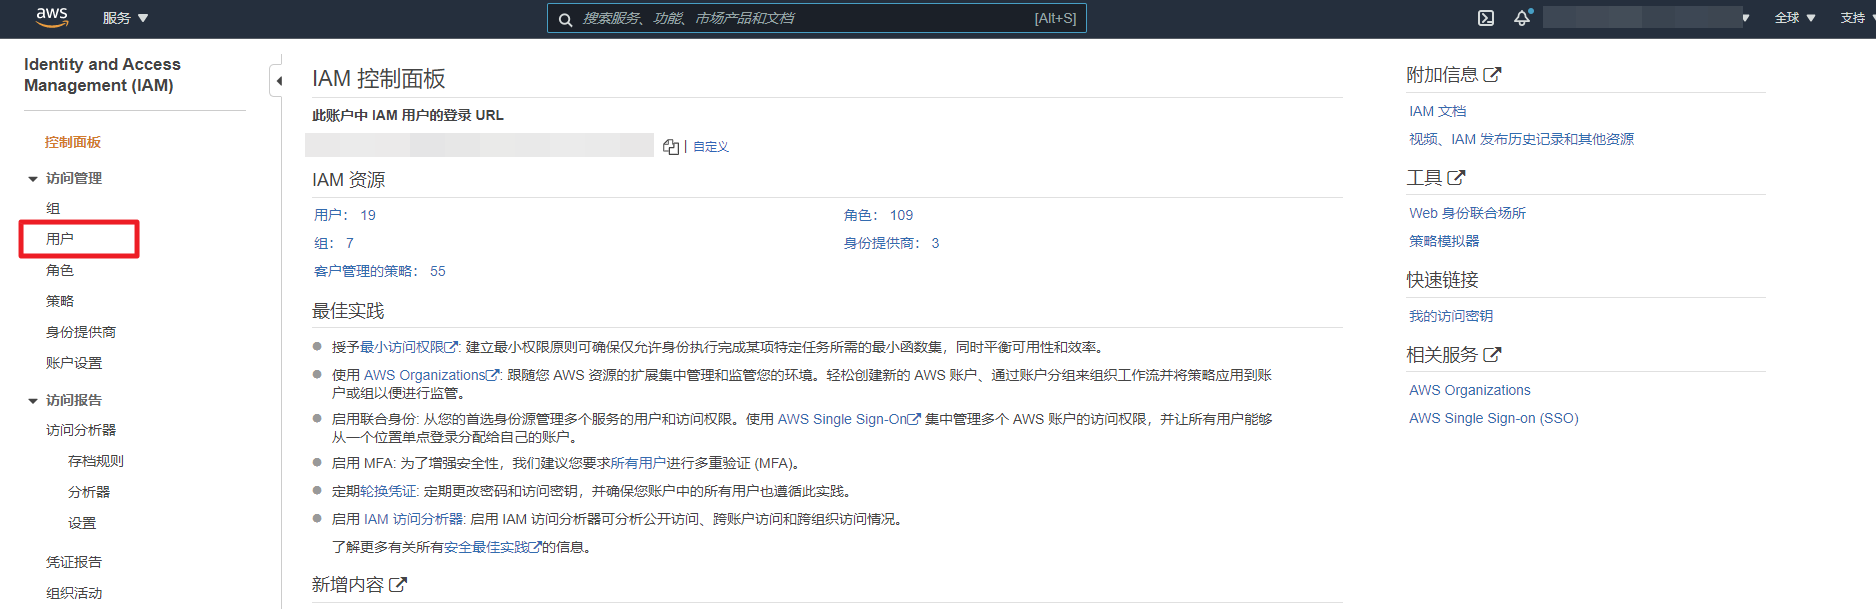
在AWS控制台的IAM菜单中,点击左侧导航栏中的用户。
![]()
![]()
使用从服务门户复制的访问密钥来搜索用户。
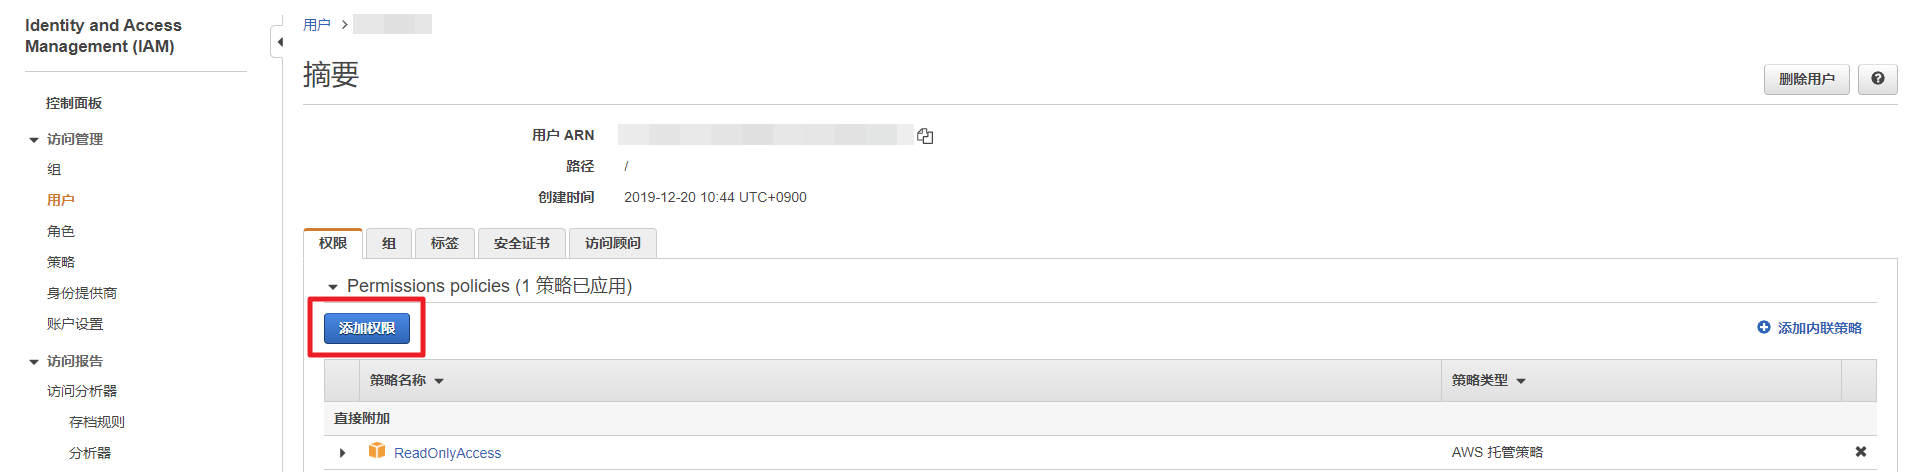
从列表中选择一个用户,然后点击添加权限按钮。
![]()
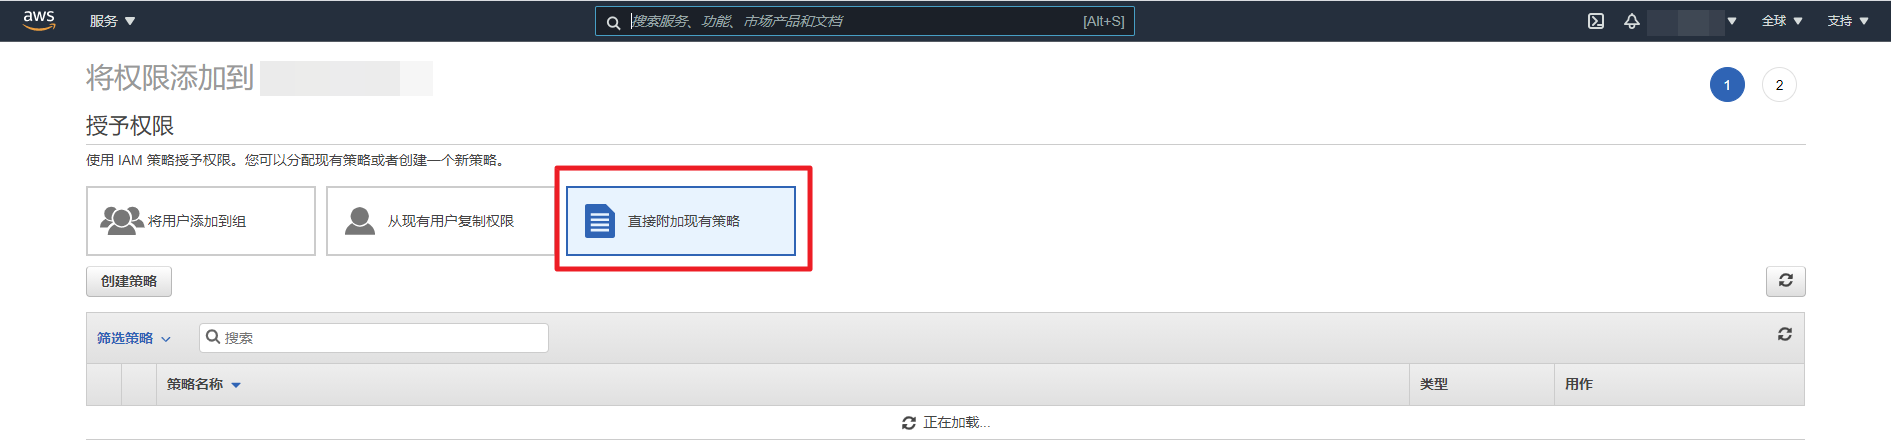
在授权页面中选择直接附加现有策略。
![]()
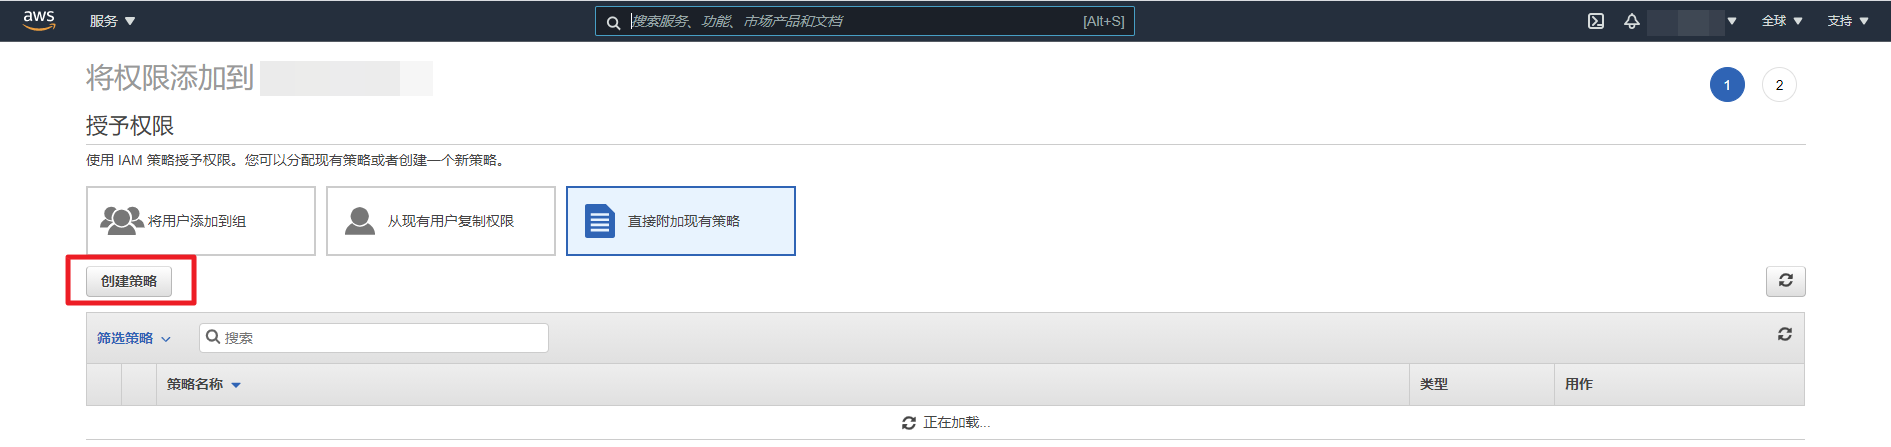
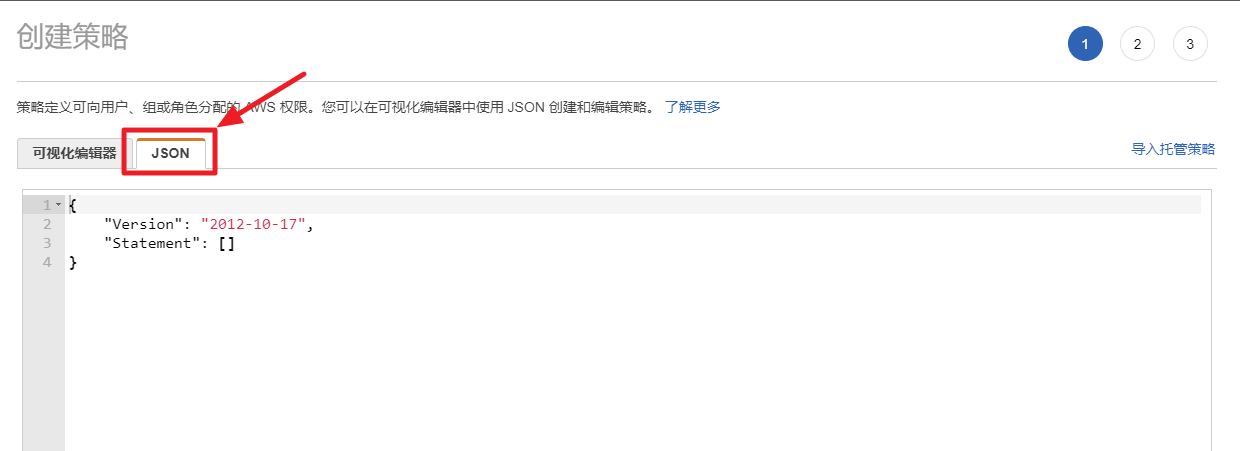
选择创建策略,然后点击JSON选项卡。
![]()
![]()
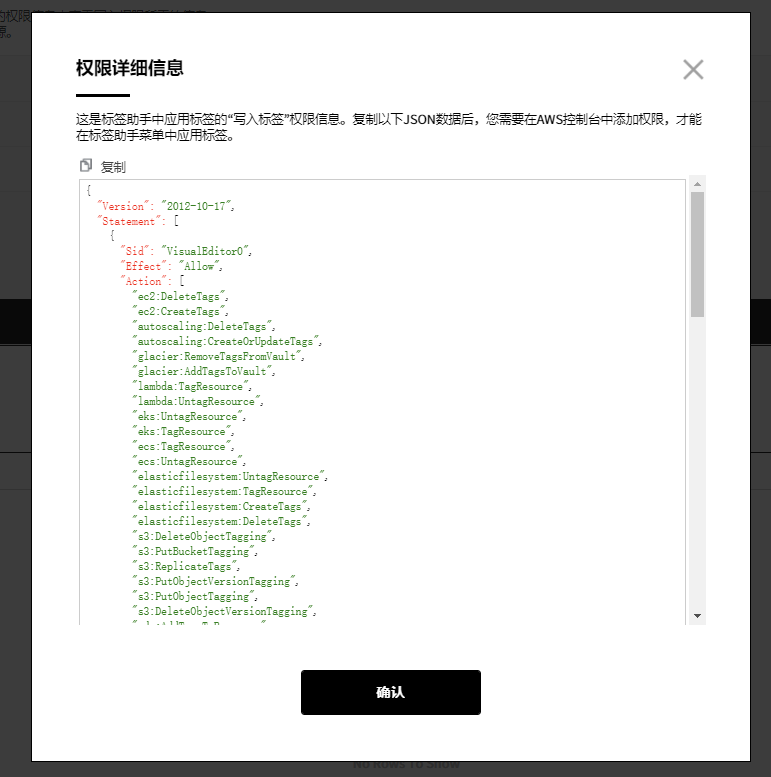
在服务门户的标签助手页面中点击授权信息后,在弹出的窗口中复制JSON信息。
![]()
![]()
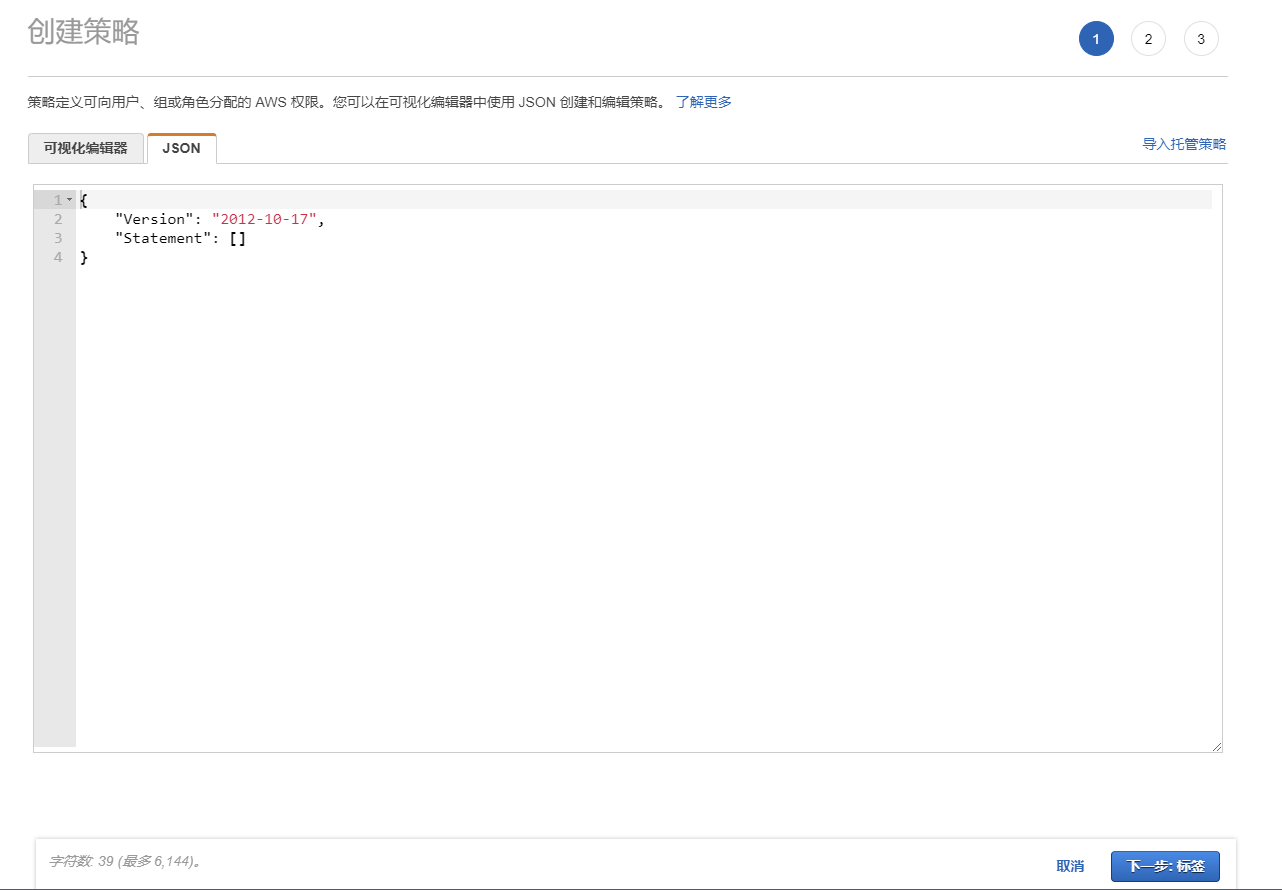
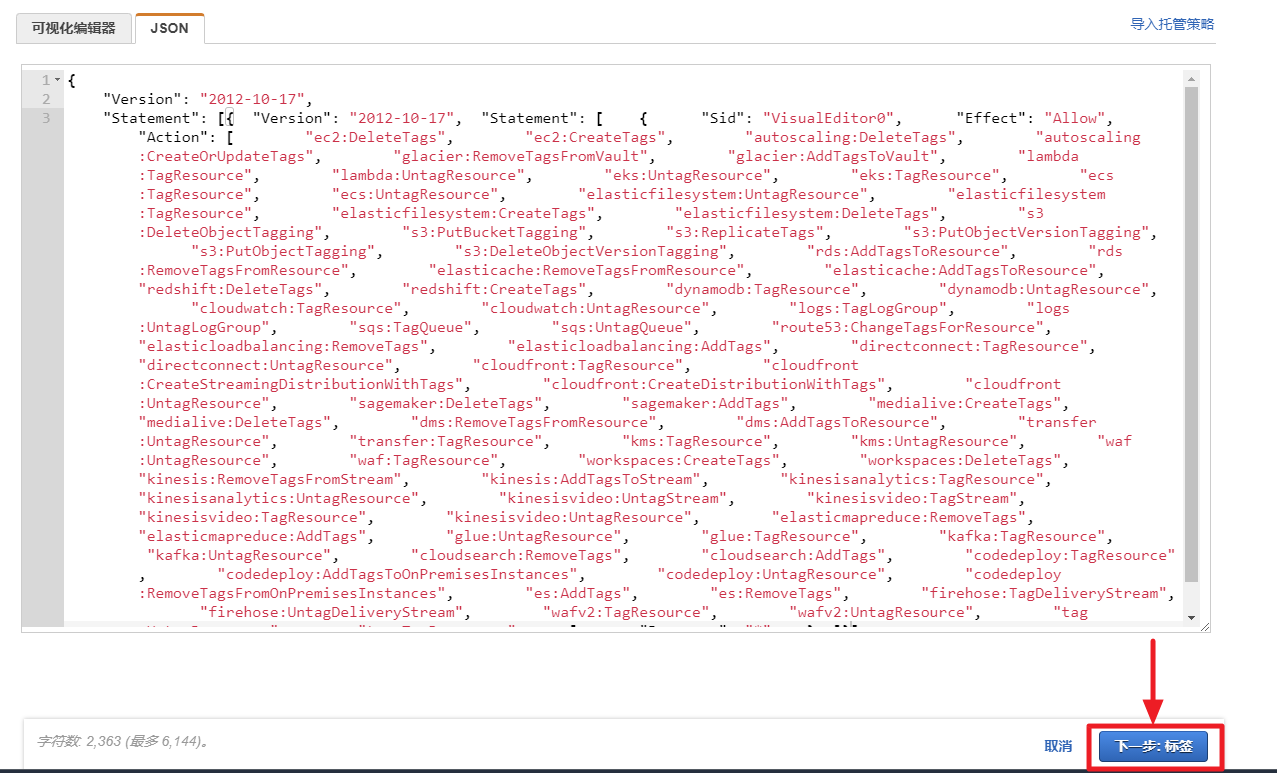
将复制的JSON信息粘贴到AWS控制台的JSON选项卡中,然后点击策略检查按钮。
![]()
在策略检查页面中输入必填项名称和描述,然后选择创建策略按钮。
![]()

使用跨账户访问方式登录账户时
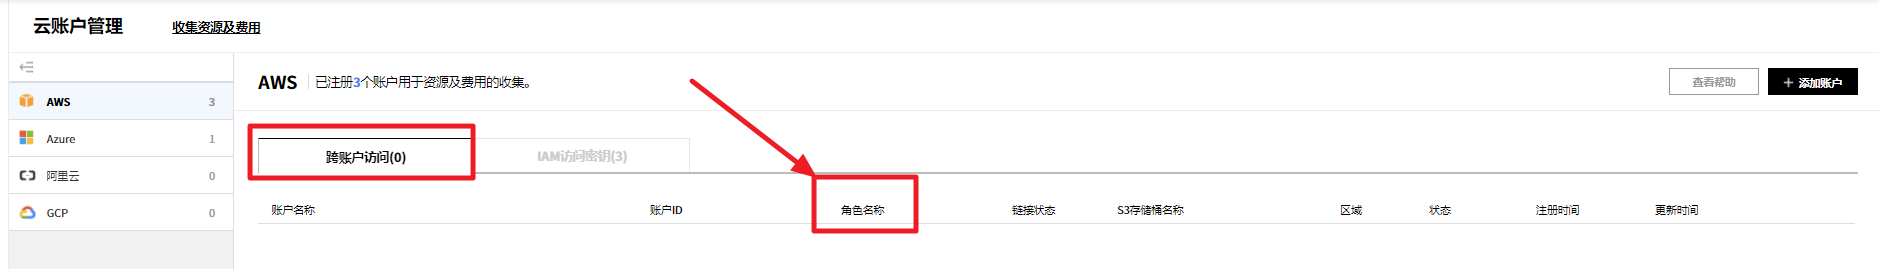
在服务门户->云账户->跨账户访问选项卡中,复制要授予账户的角色名称。
![]()
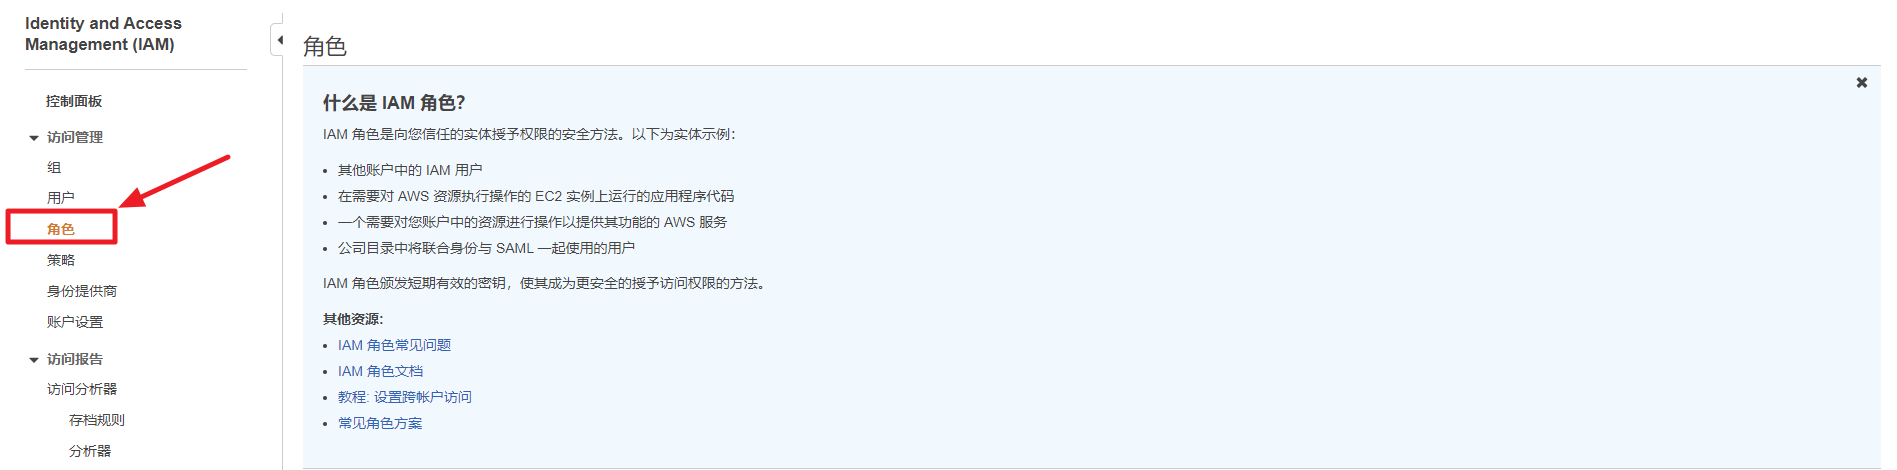
在AWS控制台的IAM菜单中,点击左侧导航栏中的角色。
![]()
![]()
使用从服务门户复制的角色名称搜索角色。
从列表中选择角色后点击关联策略按钮。
![]()
在关联权限页面中选择创建策略按钮。
![]()
在策略创建页面中点击JSON标签。
![]()
在服务门户的标签助手页面中点击授权信息后,在弹出的窗口中复制JSON信息。
![]()
![]()
将复制的JSON信息粘贴到AWS控制台的JSON选项卡中,然后点击策略检查按钮。
![]()
在策略检查页面中输入必填项名称和描述,然后选择创建策略按钮。
![]()
Add Permission - GCP
To add labels to Google Cloud resources through Tag Assistant, you must add permissions on the Google Cloud console first.
Select GCP for the cloud service and click [APPLY].
![]()
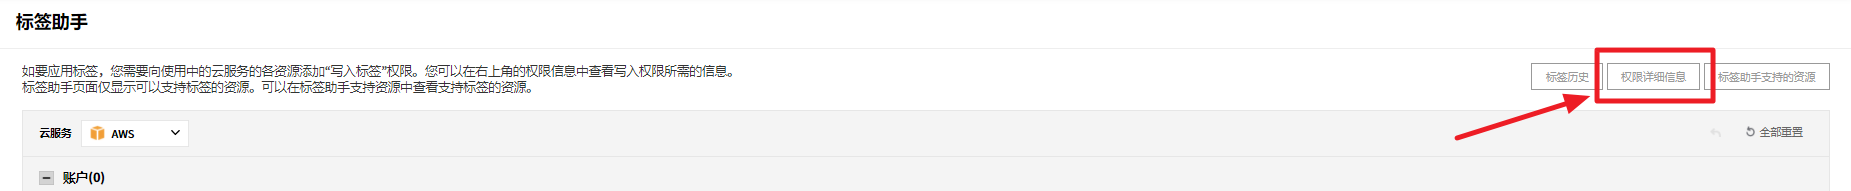
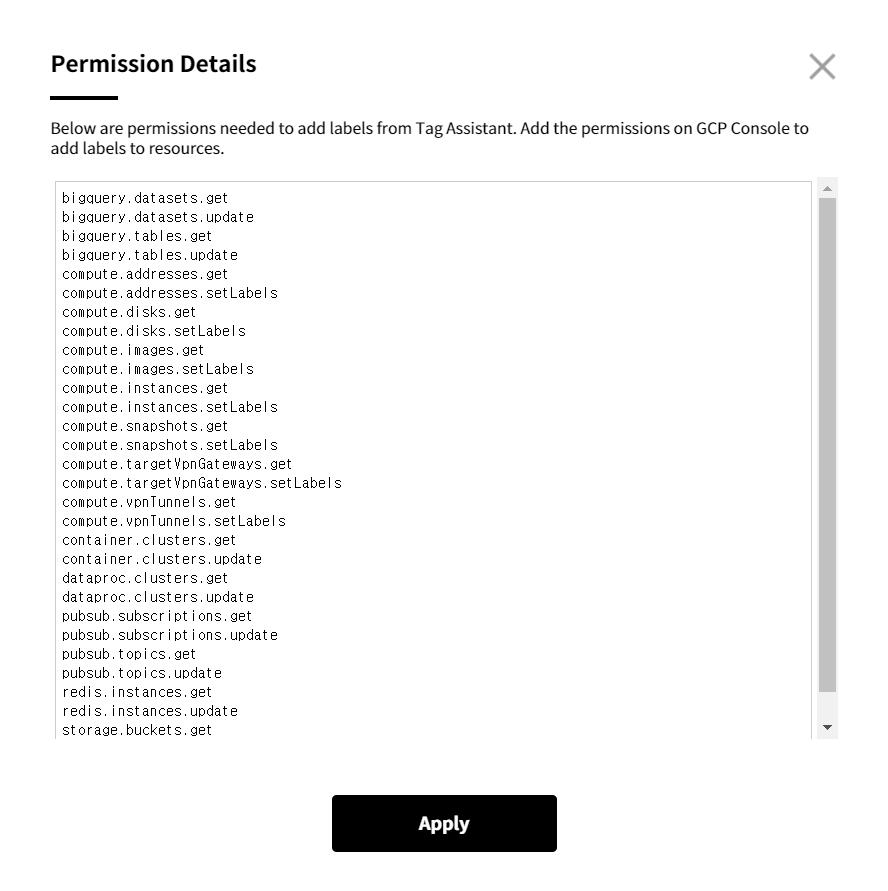
Click [Permission Details] on top right and check permissions to add.
![]()
Log in to the Google Cloud console on a new window, go to IAM & Admin > Roles and click [CREATE ROLE].
![]()
Enter a title and click [+ADD PERMISSIONS].
![]()
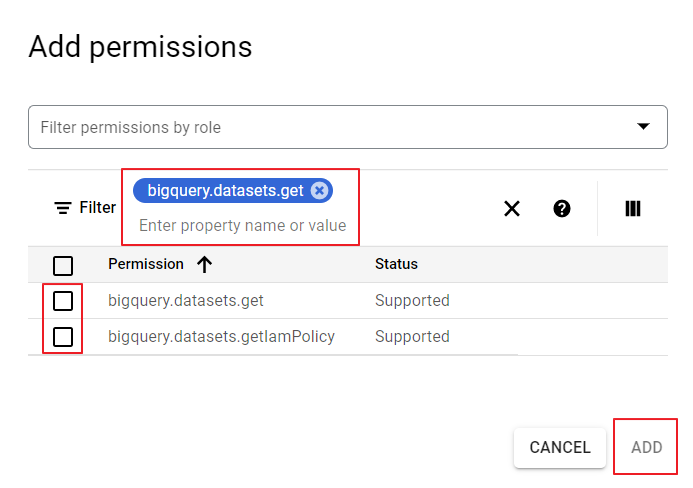
Enter permissions on the Permission Details page of Tag Assistant. Add them one by one without omission.
![]()

- Use OR as a classifier to have permissions displayed on the list below. If you copy and paste all permissions at once, the [Add] button is not activated and you will not be able to add them.
![]()
After adding all permissions, click [UPDATE] to create a role.
![]()
Click Service Accounts under the IAM & Admin tab and copy the Email address registered on OpsNow.
![]()
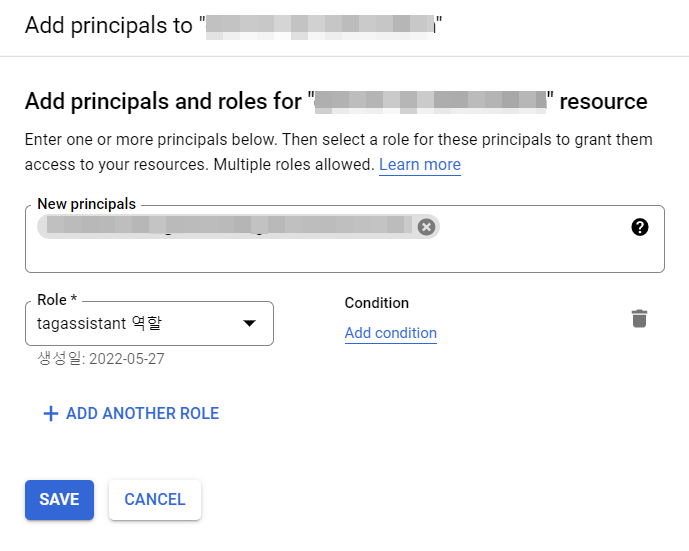
Click Manage Resources on bottom left, select the account registered on OpsNow and click [ADD PRINCIPAL] from the page unfolded on the right.
![]()
Paste the copied Email address in the New principals field, click the Select a role field below and select the role you created in Step 4-7 from the Custom filter.
![]()
Click [Save] to have the permissions added.


添加及删除标签
Add Tags
从资源列表中选择要添加标签的资源,然后点击添加标签按钮。
![]()
当出现标签添加弹出窗口时,选择标签键和标签值,然后点击应用按钮。标签键和标签值可以使用现有值或新值/键。
![]()
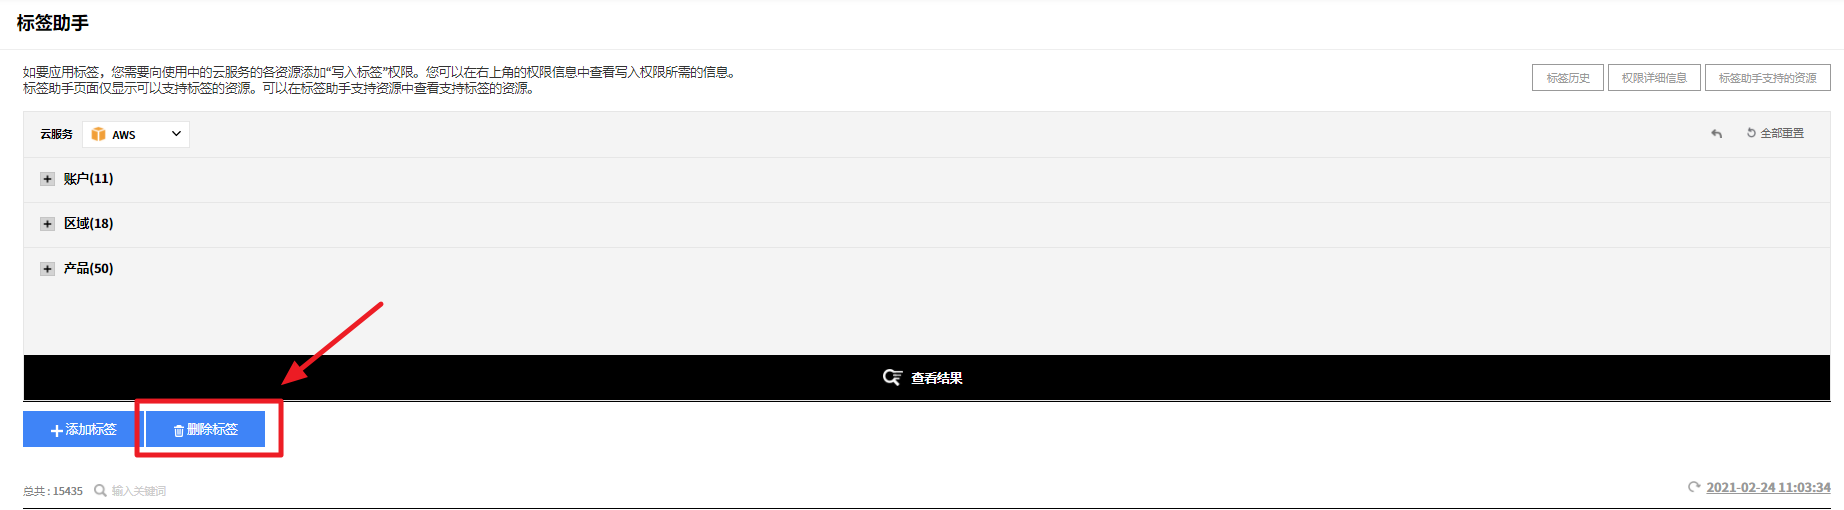
从资源列表中选择要删除标签的资源,然后点击删除标签按钮。
![]()
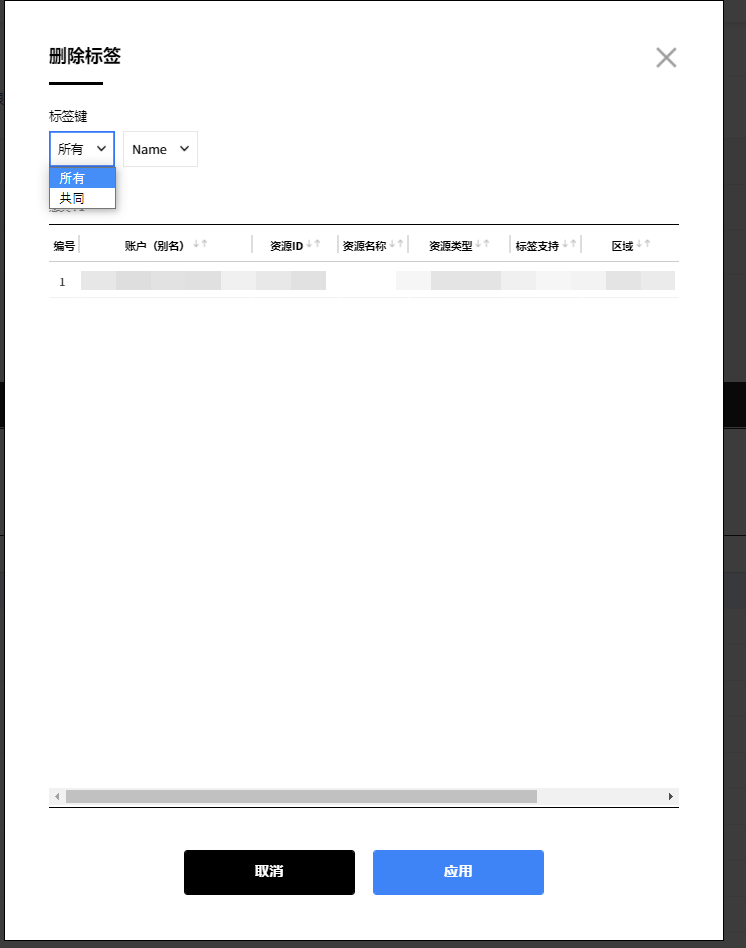
出现标签删除弹出窗口时,从标签键的下拉列表中选择全部或通用,然后点击应用按钮。
![]()


⚠️Note: Requirements for GCP tags
Unlike AWS, GCP resources have requirements for tag keys and values. Therefore, if you wish to add new tag keys and values to GCP resources, they must meet the following requirements.
• Each resource can have multiple tags, up to a maximum of 64.
• Keys have a minimum length of 1 character and a maximum length of 42 characters, and cannot be empty. Values can be empty, and have a maximum length of 42 characters.
• Keys and values can contain only lowercase alphabets, international characters (Korean, Chinese, Japanese, German, French, Spanish and Portuguese characters using UTF-8 enconding), numeric characters, underscores and hyphens.
• Keys must start with a lowercase alphabet or international character.
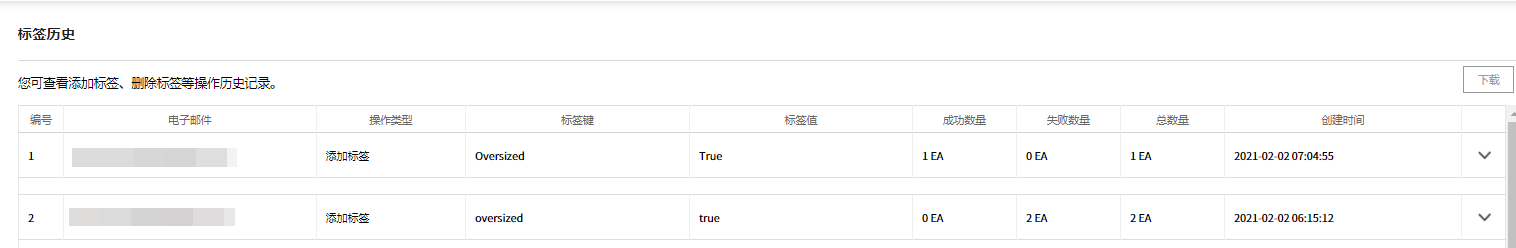
标签历史记录
标签助手提供标签历史记录功能,可让您检查何时、何地、谁、应用了什么标签,以及标签操作是否成功。您可以通过点击右上角的标签历史记录按钮,在出现的弹出窗口中查看标签历史记录,也可以将其下载为Excel文件查看。

标签助手支持资源
可以在标签助手中查看支持标签功能的资源信息。